We launched product analytics for web

The addition of web marks a big milestone in UXCam's mission to simplify product analytics.
Last year, we noticed customers wanting more value out of their tools as vendor consolidation became an increasing priority.
With our market leading mobile SDK, we're already bridging the gap from quantitative to qualitative data — and now we wanted to help people further by closing the gap between web and mobile to unify teams further.
With product analytics for web, you can enjoy:
A single contract for your web and mobile analytics needs
One onboarding for the web and mobile team. We brought all the features from mobile to the needs of web-specific data.
Lower learning curve for those who are already using our mobile analytics


Before expanding into this broader market, our product team identified gaps that still plagued the web analytics ecosystem. By speaking to people who use analytics to make decisions in their everyday job, we realized that user behavior data was still scattered across multiple tools and departments within a single organization.
So why are both individuals and teams within a single organization using different types of analytics tools, despite all the tools that exist?
Session replay tools lack deep analytics capabilities for hypothesis validation
Analytics platforms offer deep segmentation but miss the contextual 'why' without session replays
Add-on session replay capabilities that are built on top of analytics platforms come with technical overhead.
Ultimately, this means organizations are likely spending more time and resources trying to piece together insights from multiple tools, while still not getting a complete, accurate picture of their users' behavior. This can lead to misguided product decisions.
"In our research, we learned that people want a tool that helps them manually do less, not spend MORE time in their product analytics tool. That's why we wanted to give customers that analyst support in a single click."

Fragmentation isn't the only challenge faced by product teams who were constantly struggling to balance three critical needs when shopping for an analytics tool:
Quick set up: Seamless native, single data connection between quantitative metrics with qualitative data in a unified platform. Piecing together insights makes it difficult to trust the data.
Depth and customizability: Advanced segmentation and custom properties are essential for meaningful analysis but sometimes the tools were too complex and expensive. On the other hand, while free analytics tools offer cost savings, they lack sophisticated insight capabilities and flexible data modeling.
Time to insight: Product owners don't want an analytics tool that overwhelms their teams, they want a solution that's easy to kick off and enables their team to self serve reports.


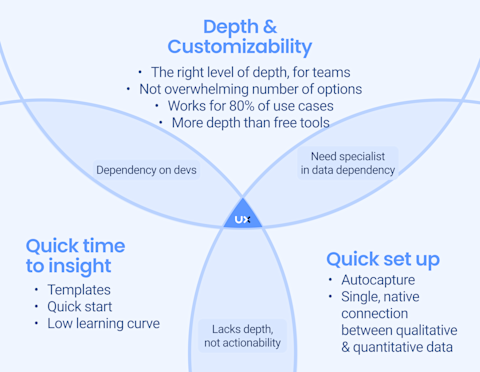
Many tools require teams to compromise - choosing power at the cost of complexity, or speed at the cost of depth. By bringing our proven mobile capabilities to web, UXCam offers a unique solution that balances all three needs. Even better, existing UXCam users don't have to learn a new tool - the same powerful features they trust on mobile are now available for web.
Let's dive into how UXCam for web delivers on all these fronts:


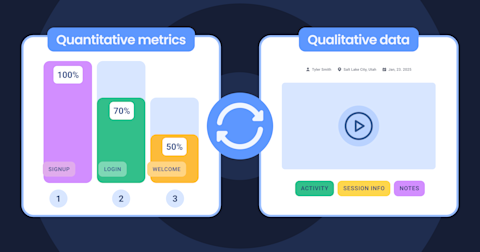
Native connection between quantitative and qualitative
Both our web and mobile product bridges the gap between quantitative and qualitative analytics. While many tools offer session replay as add-ons that require additional configuration, we provide native session replay alongside product analytics through a single SDK.
This means when you spot an unusual pattern in your conversion funnel or metrics, you can immediately watch the actual user sessions for that specific segment without switching tools or dealing with data inconsistencies.
Experience this connectivity when you:
Watch user session replays directly connected to their analytics data
Click directly into corresponding sessions from reports
Jump from high level trends to session replays in a single click
Quick time to set up


Autocapture technology has been foundational to our approach since day 1, with the aim of reducing engineering overhead. By autocapturing device behavior, and user data automatically, you get a rich list of filters to work with outside of the box.
Despite this variety, we believe powerful analytics shouldn't require an analyst background. That's why we've also developed an extensive library of customizable report templates that teams can quickly adapt to their specific needs.
The key to a successful analytics onboarding is getting the whole team on the same page. Our dashboard sharing features make it simple for you to collaborate with stakeholders across the organization, making sure everyone has access to the insights they need.
Depth and customizability
During our research interviews, we noticed that there was a fine line between customizability and complexity. Too many options can be confusing, but not enough means you can’t get actionable insight. We give users the flexibility to analyze their user behavior data without overwhelming them with too many options.
Our filters and feature set focuses on covering 80% of product analytics use cases so the whole team can use them. Yet, we offer more depth and customizability than free tools.
Here are a few examples of what you can do with our filters and custom events:
Track payment abandonment: See where users drop off during checkout flows across different browsers and network conditions to identify technical barriers preventing transactions
See feature usage: Track how specific subscription users navigate between dashboard screens to understand if key features are being overlooked by specific user segments
Monitor account activation: Track the path new business users take from signup to connecting their first account, focusing on where different company sizes get stuck
User engagement: Identify when and why different customer segments (by company size or industry) show declining weekly active usage of core features over time
Registration friction: Track how different company domains and user roles progress through multi-step registration flows, identifying where enterprise teams abandon team creation
Time to insight


In our research, we learned that people want a tool that helps them manually do less, not spend more time in their product analytics tool. That's why we wanted to give customers that analyst-level automation. In just one click, you can:
Analyze an event in a session to see how frequently it occurs
Jump from funnels to session replays
Create a dashboard on a cohort automatically
Quick filter for rage clicks in a session list
We also understand that time-to-value is crucial for growing organizations. That's why we've built our web analytics solution with intelligent autocapture technology at its core. This means:
Automatic segmentation out of the box
Minimal engineering overhead for implementation
The difference between auto-capture and traditional event analytics is the default approach. With event analytics, everything starts blank - you have to purposely set up each thing you want to track, create all your filters, and build reports from scratch. It's like starting with an empty canvas where you have to learn all the painting techniques before you can make anything.
But with auto-capture, we flip this on its head. We start by gathering tons of useful data automatically, right out of the box. This means I can immediately jump in and start getting insights through our pre-made filters and report templates. I don't have to figure out what to track or how to track it - it's already happening.
The beauty of this is that users can discover patterns and behaviors they might never have thought to track with a traditional event-based system. Since we're capturing comprehensive session data by default, they might notice unexpected user flows or pain points that wouldn't have been visible if they had to pre-define everything they wanted to monitor.
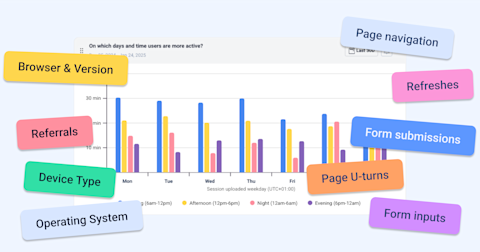
Product analytics for web automatically captures:
Form submissions
Page U-turns
Form inputs
Refreshes
Page navigation
Browser and versions
Referrals
Device types
Operating systems
Designed for web products


Product analytics for web goes beyond traditional website analytics by focusing on the complex user journeys users take while navigating a dynamic web product. While standard tools track page views and URLs, our solution captures the full context of user interactions - from critical product actions to friction points like rage clicks.
We're built to handle modern web architectures, including single-page applications and dynamic states, giving you a complete picture of how users truly engage with your product.
Start unifying your analytics with web today. As digital products become increasingly complex, the ability to understand and optimize user experiences is more critical than ever. UXCam's web analytics solution eliminates the need for multiple tools, reduces implementation overhead, and provides teams with immediate access to both quantitative and qualitative insights.
Ready to unify your product analytics and streamline your team's workflow? Get in touch with us to see how UXCam's web analytics can transform your product process.
AUTHOR
Jane Leung
Product Analytics Expert
Jane is the director of content at UXCam. She's been helping businesses drive value to their customers through content for the past 10 years. The former content manager, copywriter, and journalist specializes in researching content that helps customers better understand their painpoints and solutions.


Related articles


Website Analysis
21 Website Visitor Tracking Tools with Top-Rated User Reviews
Discover the 21 best website visitor tracking tools, featuring top-rated user reviews to help you choose the perfect solution for understanding and enhancing your site’s...


Tope Longe
Product Analytics Expert


Website Analysis
14 Website Analytics Metrics to Track for Product Teams
Discover 14 essential website analytics metrics every product manager should track to improve user experience, boost conversions, and drive product...


Website Analysis
Top 14 SaaS Product Usage Metrics and How to Improve Them
Discover the top 14 SaaS product usage metrics to track, including engagement, retention, and conversions, plus actionable strategies to optimize and drive...
Tope Longe
Product Analytics Expert