What is a North Star Metric? The Complete Framework Guide


A North Star Metric (NSM) is the single measurable value that best captures the core value your product delivers to customers. The North Star Metric framework is the full system around that metric: the input metrics that drive it, the work that moves those inputs, and the business outcomes it predicts.
I've reviewed hundreds of product dashboards across UXCam's 37,000+ installed products, and the pattern I see most often with struggling teams isn't a lack of data. It's a lack of alignment on what "winning" looks like. One team optimizes for daily active users, another chases revenue per account, a third tracks session length, and nobody can explain how those numbers relate. A good NSM framework fixes that.
This guide walks through what a North Star Metric actually is, how the framework components fit together, and how to implement it without turning your roadmap into a spreadsheet exercise.
Key takeaways
A North Star Metric is one measurable number that reflects the value customers get from your product, not a vanity count like registered users.
The NSM framework has three layers: the North Star itself, the input metrics that feed it, and the work (features, experiments, research) that moves those inputs.
The metric you pick depends on the "game" your product plays: attention, transaction, or productivity.
NSMs fail when they're not actionable. If your team can't influence it directly through product work, it's the wrong metric.
You need qualitative context, not just dashboard numbers. Session replay and heatmaps show why input metrics move, not just whether they did.
Tara AI, UXCam's AI analyst, surfaces the friction points that block your NSM so you stop hunting through sessions manually.
What is the North Star Metric framework?
The North Star Metric framework is a complete map of how a single success metric connects to the work your team does and the outcomes your business cares about.


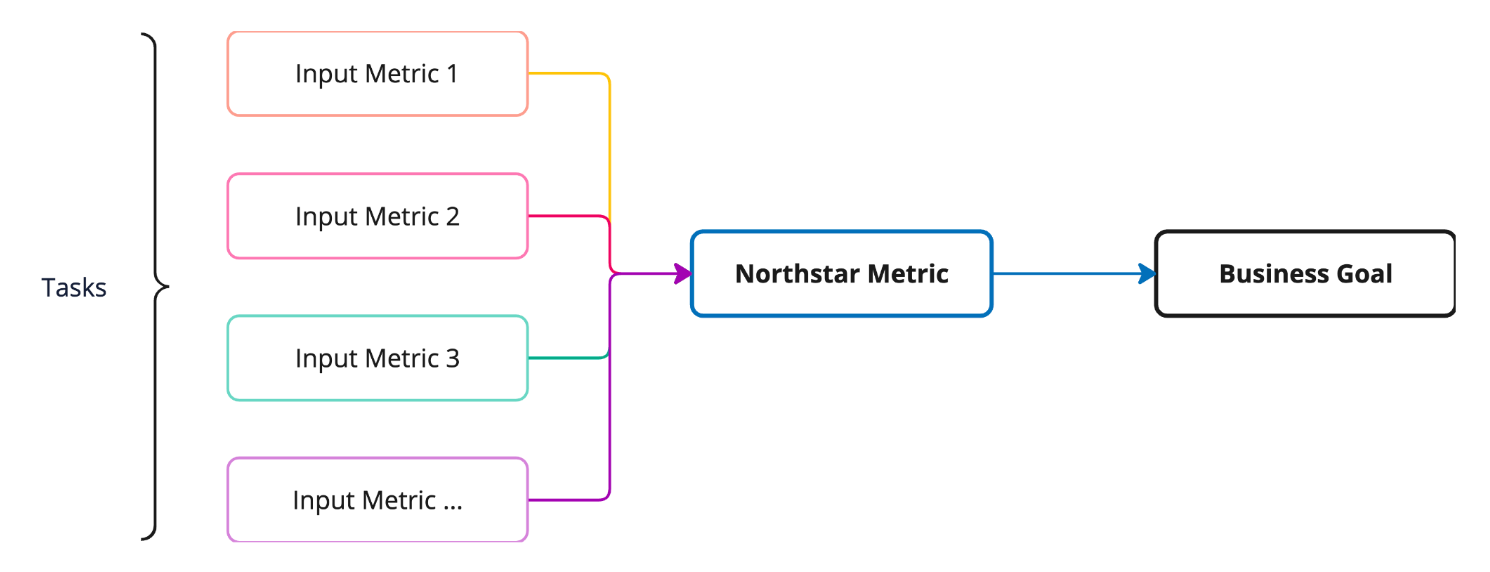
The framework pulls together three things: the NSM itself, the input metrics that move it, and the product work that moves those inputs. On the other side sit the business outcomes, revenue, retention, market share, that the NSM is meant to predict. The framework exists so every team, from engineering to growth, can trace their work back to a shared definition of value.
The term was popularized by Sean Ellis and scaled inside companies like Facebook, Airbnb, and Spotify. It's not a reporting tool. It's a decision-making tool.
The three elements of the NSM framework
1. Your North Star Metric
Your NSM is the center of the framework. It's the one number that, if it goes up, tells you customers are getting more value and the business is getting healthier.
A good NSM meets four criteria:
Expresses value. Behavior-based metrics beat vanity counts. "Nights booked" tells you more than "registered users" because it reflects an action customers actually value. This is why Airbnb uses nights booked rather than signups.
Predicts success. If the metric goes up, revenue and retention should follow. A subscription app obsessing over monthly signups while churn balloons has picked the wrong metric.
Actionable. Your product team has to be able to move it. An HR app can't pick "employee tenure" as its NSM because the product doesn't directly control that. "Weekly active managers completing reviews" is closer to the mark.
Measurable. You need to be able to instrument it. Abstract outcomes like "user happiness" only count if you've defined a concrete proxy for them.
I've worked with teams that skipped this step and picked whatever metric was already on their dashboard. Six months later they realized they'd been optimizing for something that didn't move revenue at all.
2. Input metrics
Input metrics are the smaller, team-level numbers that feed the NSM.


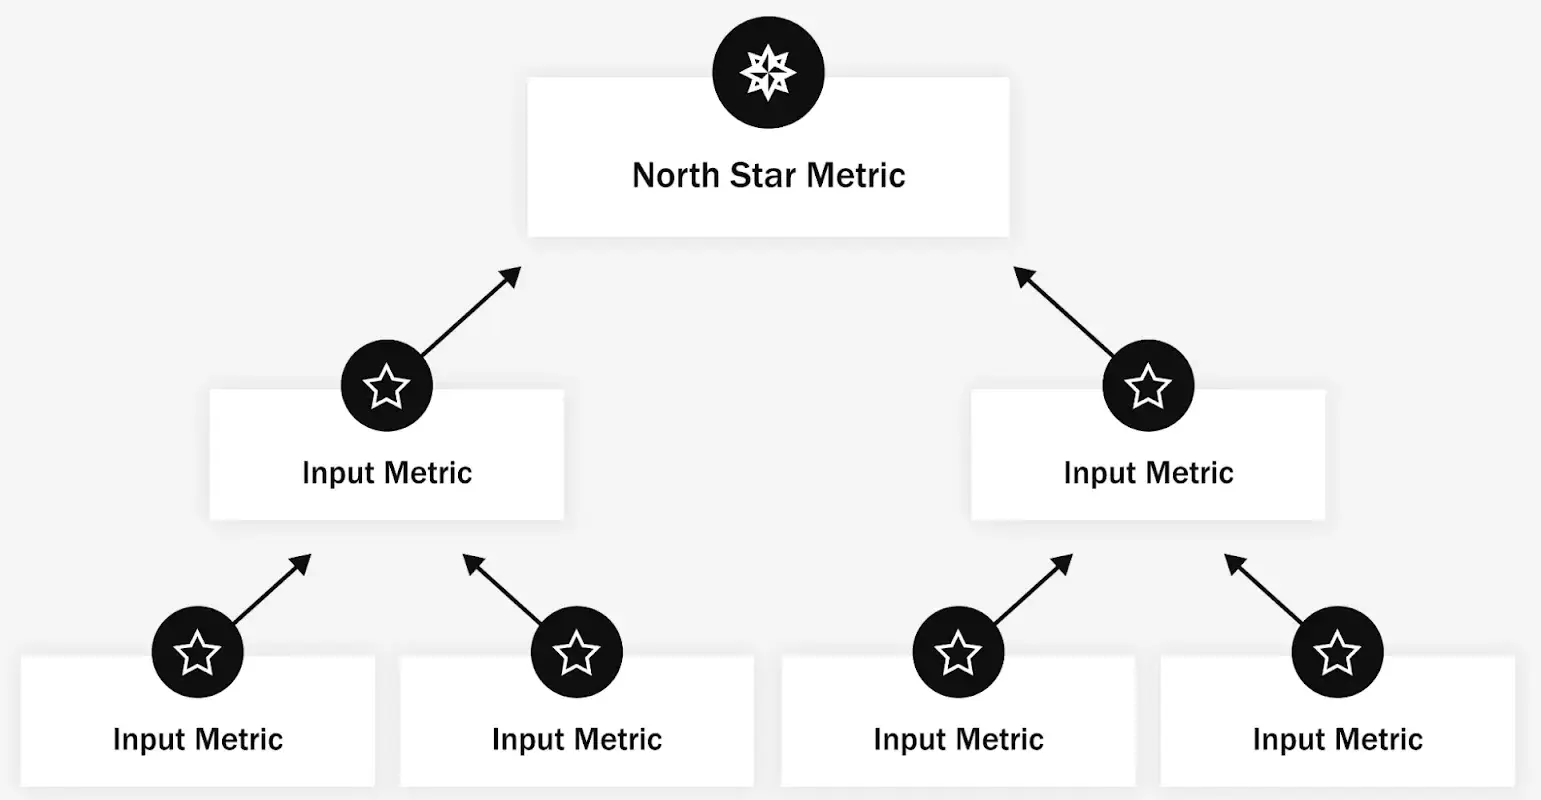
Take Facebook's historical NSM of monthly active users. The inputs that drove it included daily logins, friend connections per user, time spent in feed, and notification open rate. Each input could be owned by a different team, and each one gave that team a clear, local target that laddered up to the NSM.
Here's the hypothesis template I use with product teams:
"I believe [NSM] is a function of [X, Y, Z]. I also believe X, Y, and Z are relatively independent, so moving one doesn't automatically move the others."

You start with a hypothesis. You validate it by looking at whether changes in inputs actually correlate with the NSM over time. If they don't, you've picked the wrong inputs.
3. Work
Work is everything your team actually does: research, prototyping, experiments, engineering, design, content. The point of the framework is to make sure work maps to an input metric, which maps to the NSM. If a feature can't be tied to a specific input, it probably shouldn't be on the roadmap yet.
This is where most NSM implementations break down. Teams pick the metric, communicate it, and then go right back to shipping whatever was already planned. Without the work-to-input link, the NSM is decoration.
Why the NSM framework matters
Teams that implement the framework properly get four things:
Clearer decisions. When two features compete for the same sprint, you compare their expected impact on input metrics.
Cross-team alignment. Growth, product, and engineering argue less about priorities because the scoreboard is shared.
A product-led strategy. The NSM forces you to define customer value in product terms, not sales terms.
Better customer focus. Because good NSMs are behavior-based, tracking them means tracking what users actually do in the app.
The catch: none of this happens if the metric is wrong or if you can't see why it's moving. That's where most teams need better instrumentation.
How to implement the North Star Metric framework
Step 1: Define your NSM by identifying your "game"
The first decision is what kind of product you are. The North Star playbook groups digital products into three categories:
Attention products create value by holding user attention. Spotify, Netflix, TikTok. NSMs tend to be time-based: streaming hours, monthly listening hours.
Transaction products create value when users transact. Amazon, Uber, DoorDash. NSMs are transaction-based: rides completed, orders fulfilled.
Productivity products create value when users complete meaningful actions. Slack, Notion, Figma. NSMs are action-based: messages sent by active teams, weekly active collaborators.
Once you know your game, you pick the specific metric. Even within one category, there are choices. Netflix could pick "total hours watched" (easy to game with autoplay) or "percentage of users watching at least one show per week" (harder, more honest). The better NSMs force harder product work.
Step 2: Understand your customer journey
Your NSM only makes sense in the context of how people actually use your product. Map the full journey: acquisition, activation, core loop, retention, referral.


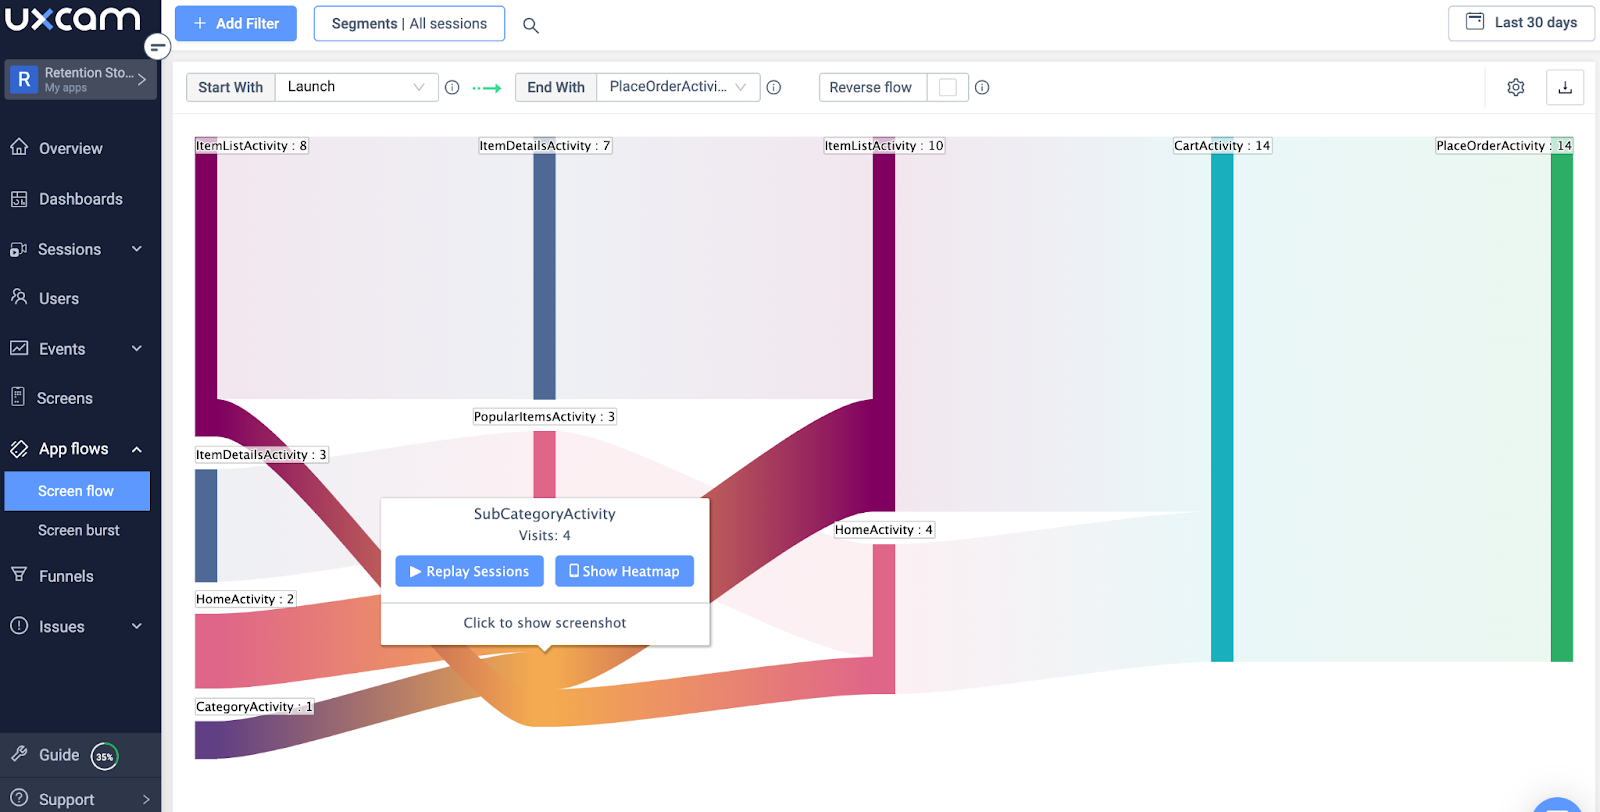
This is where qualitative data earns its keep. Dashboards will tell you that your activation rate dropped 8%. They won't tell you why. UXCam's session replay, heatmaps, and user journey flows show you exactly where people get stuck. Recora used session replay to spot a press-and-hold gesture users didn't understand, and reduced support tickets by 142% after redesigning the interaction. That's an input metric improving because someone watched the sessions.
Step 3: Segment your user base
A blanket NSM across all users hides important differences. New users, power users, and slipping-away users move different input metrics.


UXCam's segmentation includes pre-built cohorts (new, loyal, returning, slipping away) so you can track your NSM per segment and see which group is actually moving the number. Housing.com used segmentation-informed product decisions to push feature adoption from 20% to 40%.
Step 4: Collect and analyze the data
Your framework is only as good as the instrumentation underneath it. You need:
Event tracking for the NSM and every input metric.
Dashboards that non-analysts can read.
Qualitative tools to explain why numbers moved.
UXCam's SDK autocaptures interactions from the start of every session, so you get both the quantitative numbers and the session-level context behind them. Tara AI, UXCam's AI product analyst, goes further: it processes sessions at scale, flags anomalies, and surfaces the friction points that explain why an input metric dropped, so you're not scrubbing through hundreds of replays manually.


Customizable dashboards let every team watch the inputs they own alongside the overall NSM.
Step 5: Set a baseline and targets
Measure where you are today. Set a realistic target range (I usually push teams toward quarterly targets with monthly check-ins). Then run experiments against input metrics. A/B test UI changes, watch session replays of the test group, use issue analytics to catch rage taps or UI freezes that might explain unexpected dips.
Inspire Fitness did this well, combining quantitative tracking with session-level analysis to boost time-in-app by 460% and cut rage taps by 56%. Costa Coffee used the same approach to raise registrations by 15%.
Where most NSM implementations go wrong
Three failure modes I see repeatedly:
The metric is a vanity number. Registered users, app downloads, or total accounts. None of these reflect value delivered.
Input metrics are too abstract. If your inputs are "user satisfaction" and "engagement," you haven't done the work. You need concrete, instrumentable events.
Nobody connects work to inputs. Teams adopt the NSM language but keep shipping the old roadmap. The framework only works when feature prioritization is visibly driven by expected input movement.
If you want to see real examples of how companies have avoided these traps, the North Star Metric examples article walks through Spotify, Airbnb, Facebook, and others. For the detailed selection process, see how to define your North Star Metric.
Use UXCam to run your NSM framework
A North Star Metric framework only works if you can see what's moving and why. UXCam is a product intelligence and product analytics platform built for mobile apps and the web and now web-ready, with session replay, heatmaps, issue analytics, funnels, and retention analytics feeding a single view of user behavior. Tara AI processes that data and recommends the next action.
Installed in 37,000+ products and rated 4.7 on G2, UXCam gives you the quantitative numbers and the qualitative evidence you need to prove your NSM is moving for the right reasons. Start a free trial and wire up your first NSM dashboard this week.
Frequently asked questions
What is a North Star Metric in simple terms?
A North Star Metric is the single number that best captures how much value your product delivers to customers. It sits above other metrics as the guiding target for the whole company. If the NSM is moving up, customers are getting more value and, over time, business outcomes like revenue and retention should follow. A good example is Airbnb's "nights booked," which reflects actual value exchanged, not a surface-level count like signups or page views.
How is a North Star Metric different from a KPI?
A KPI is any key performance indicator your business tracks, and most companies have dozens. A North Star Metric is the one KPI that sits above all others as the shared target across product, engineering, marketing, and growth teams. KPIs tend to be team-specific (support has ticket volume, marketing has CAC, engineering has uptime). The NSM is the cross-functional metric everyone agrees represents product success. Input metrics in the NSM framework often look like traditional KPIs.
Can a company have more than one North Star Metric?
Technically yes, but I'd advise against it in practice. The whole point of the North Star is alignment. The moment you have two, teams start optimizing for whichever one their incentives favor, and you lose the shared definition of success. Larger companies with distinct product lines sometimes have an NSM per product, which is reasonable. Within a single product, one NSM, supported by a tree of input metrics, is almost always the right setup.
What are examples of good North Star Metrics?
Spotify tracks time spent listening. Airbnb uses nights booked. Facebook historically used monthly active users. Slack tracks messages sent within active teams. Uber uses weekly rides completed. Notice that each one is behavior-based, ties directly to customer value, and can be influenced by product work. Vanity metrics like total signups or page views don't qualify because they don't predict whether users actually get value or stick around. The detailed North Star Metric examples article covers these in depth.
How do I know if my North Star Metric is wrong?
Three warning signs. First, the NSM goes up but revenue or retention doesn't follow (the metric doesn't predict business success). Second, your team can't influence it directly through product work (it's not actionable). Third, it keeps going up because of growth in signups or marketing spend rather than product improvement (it's a vanity proxy). If any of those apply, revisit your choice. Often the fix is moving from a top-of-funnel count to a behavior or frequency metric.
How does UXCam help track a North Star Metric?
UXCam captures the quantitative events that make up your NSM and input metrics, then pairs them with qualitative evidence through session replay, heatmaps, and issue analytics. When an input metric drops, you can watch the sessions where it happened instead of guessing. Tara AI, UXCam's AI analyst, processes sessions at scale and surfaces friction points automatically. Customers like Recora (142% fewer support tickets), Inspire Fitness (460% more time-in-app), and Housing.com (20% to 40% feature adoption) have used this combination to move the input metrics that drive their NSM.
AUTHOR
Silvanus Alt, PhD
Founder & CEO | UXCam
Silvanus Alt, PhD, is the Co-Founder & CEO of UXCam and a expert in AI-powered product intelligence. Trained at the Max Planck Institute for the Physics of Complex Systems, he built Tara, the AI Product Analyst that not only analyzes user behavior but recommends clear next steps for better products.


Related articles


Product best practices
12 Apps with Great User Onboarding (2026 Examples)
The 12 mobile app onboarding flows I'd study if I were designing one today, with specific callouts for what each does well, common mistakes, and the...
Silvanus Alt, PhD
Founder & CEO | UXCam


Product best practices
Why creating a data-driven culture has less to do with data than you think
Kishan Gupta, CEO, shares 5 tips and techniques for fostering a data-driven culture based on his own experiences building and leading...


Kishan Gupta
Co-Founder of UXCam


Product best practices
Finance apps have a customer support problem, here's how to fix it
Learn about the customer support problem in finance apps and practical solutions to fix it in our latest blog post, and improve user satisfaction and...


Jane Leung
Product Analytics Expert