User Adoption Dashboard Examples And How To Use Them


Driving user adoption is a complicated process with lots of moving parts. Dashboards help you organize these parts into an organized, centralized source of truth.
At UXCam, we’ve worked hard to make our dashboard feature flexible—it’s easy to create user adoption dashboards that support a wide range of use cases. In this guide, we’ll give you a thorough overview of user adoption dashboards and introduce you to a few use cases that will help you get started.
Let’s get started. Helpful summary
Overview: This article explores a few ways to use user adoption dashboard to power your mobile app adoption.
Why you can trust us: We’ve helped 37,000+ mobile product teams drive adoption and grow their user base.
Why it matters: User adoption dashboards give your team easy access to the data they need to make informed decisions.
Action points: Build dashboards that track important aspects of user adoption, like frustration, features adoption, and retention.
Further research: Check out our guide to the four best user adoption tools on the market.
What is a user adoption dashboard?
A user adoption dashboard is a collection of metrics, charts, and data visualizations that provide a comprehensive view of how users are interacting with your product. They can be used to track key performance indicators (KPIs), monitor user behavior, and identify areas for improvement.
Here’s an example of a user adoption dashboard in UXCam.


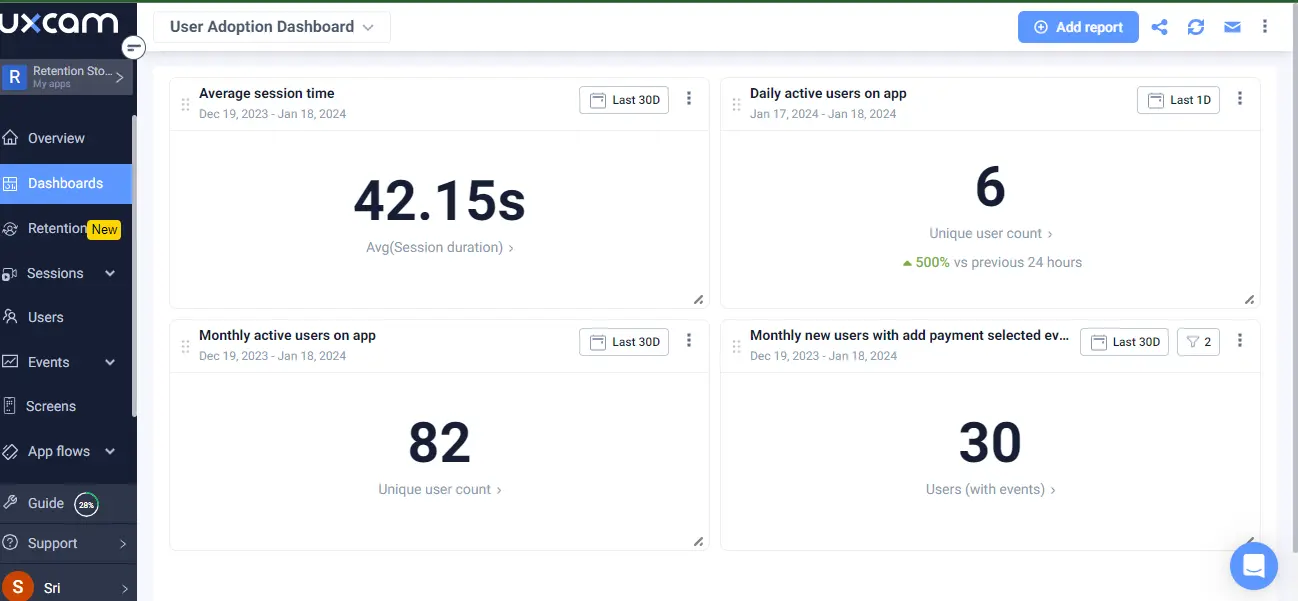
This particular dashboard showcases reports for:
Average session time
Monthly and daily active users on app
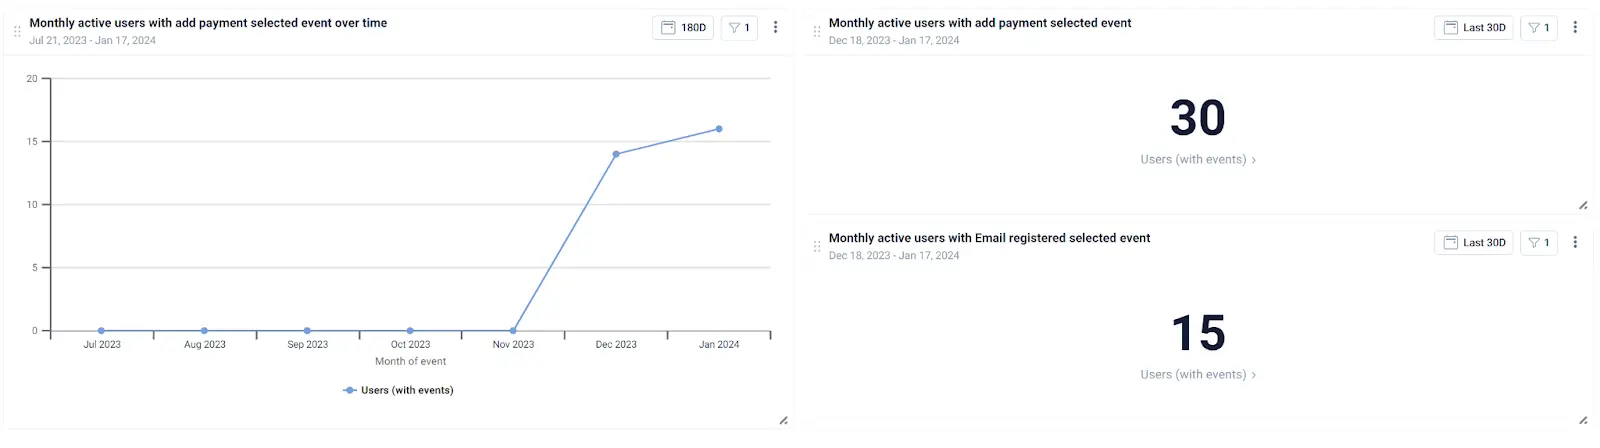
Monthly active users that added payment methods
The idea is to give your team an at-a-glance view of how users are engaging with your product, so you can identify trends and make data-driven decisions to improve your user experience.
Why are user adoption dashboards important?
Tracking app engagement
Metrics related to app engagement offer valuable insights into user interactions with an app, serving as a catalyst for enhancing user experience and fostering growth. Key metrics, including session durations, conversion rates, app acquisition, churn rates, retention rates, and screen flows, can be systematically monitored.
Improving free-to-paid conversion rate
A robust free-to-paid conversion rate serves as a powerful indicator of a product's value proposition. This metric quantifies the percentage of users who initiate their journey with a free version or trial and subsequently upgrade to a paid version.
Reducing churn rates and enhancing customer retention
The retention of customers is pivotal for business success, given that maintaining existing customers is more cost-effective than acquiring new ones. A mere 5% increase in customer retention can lead to a significant revenue boost of 25-95%.
How to use UXCam’s dashboards to monitor and improve user adoption
1. Monitor feature adoption
One powerful use case for UXCam’s dashboards in the context of user adoption is monitoring feature adoption—or in other words, how successfully your users are adopting the specific features of your app.


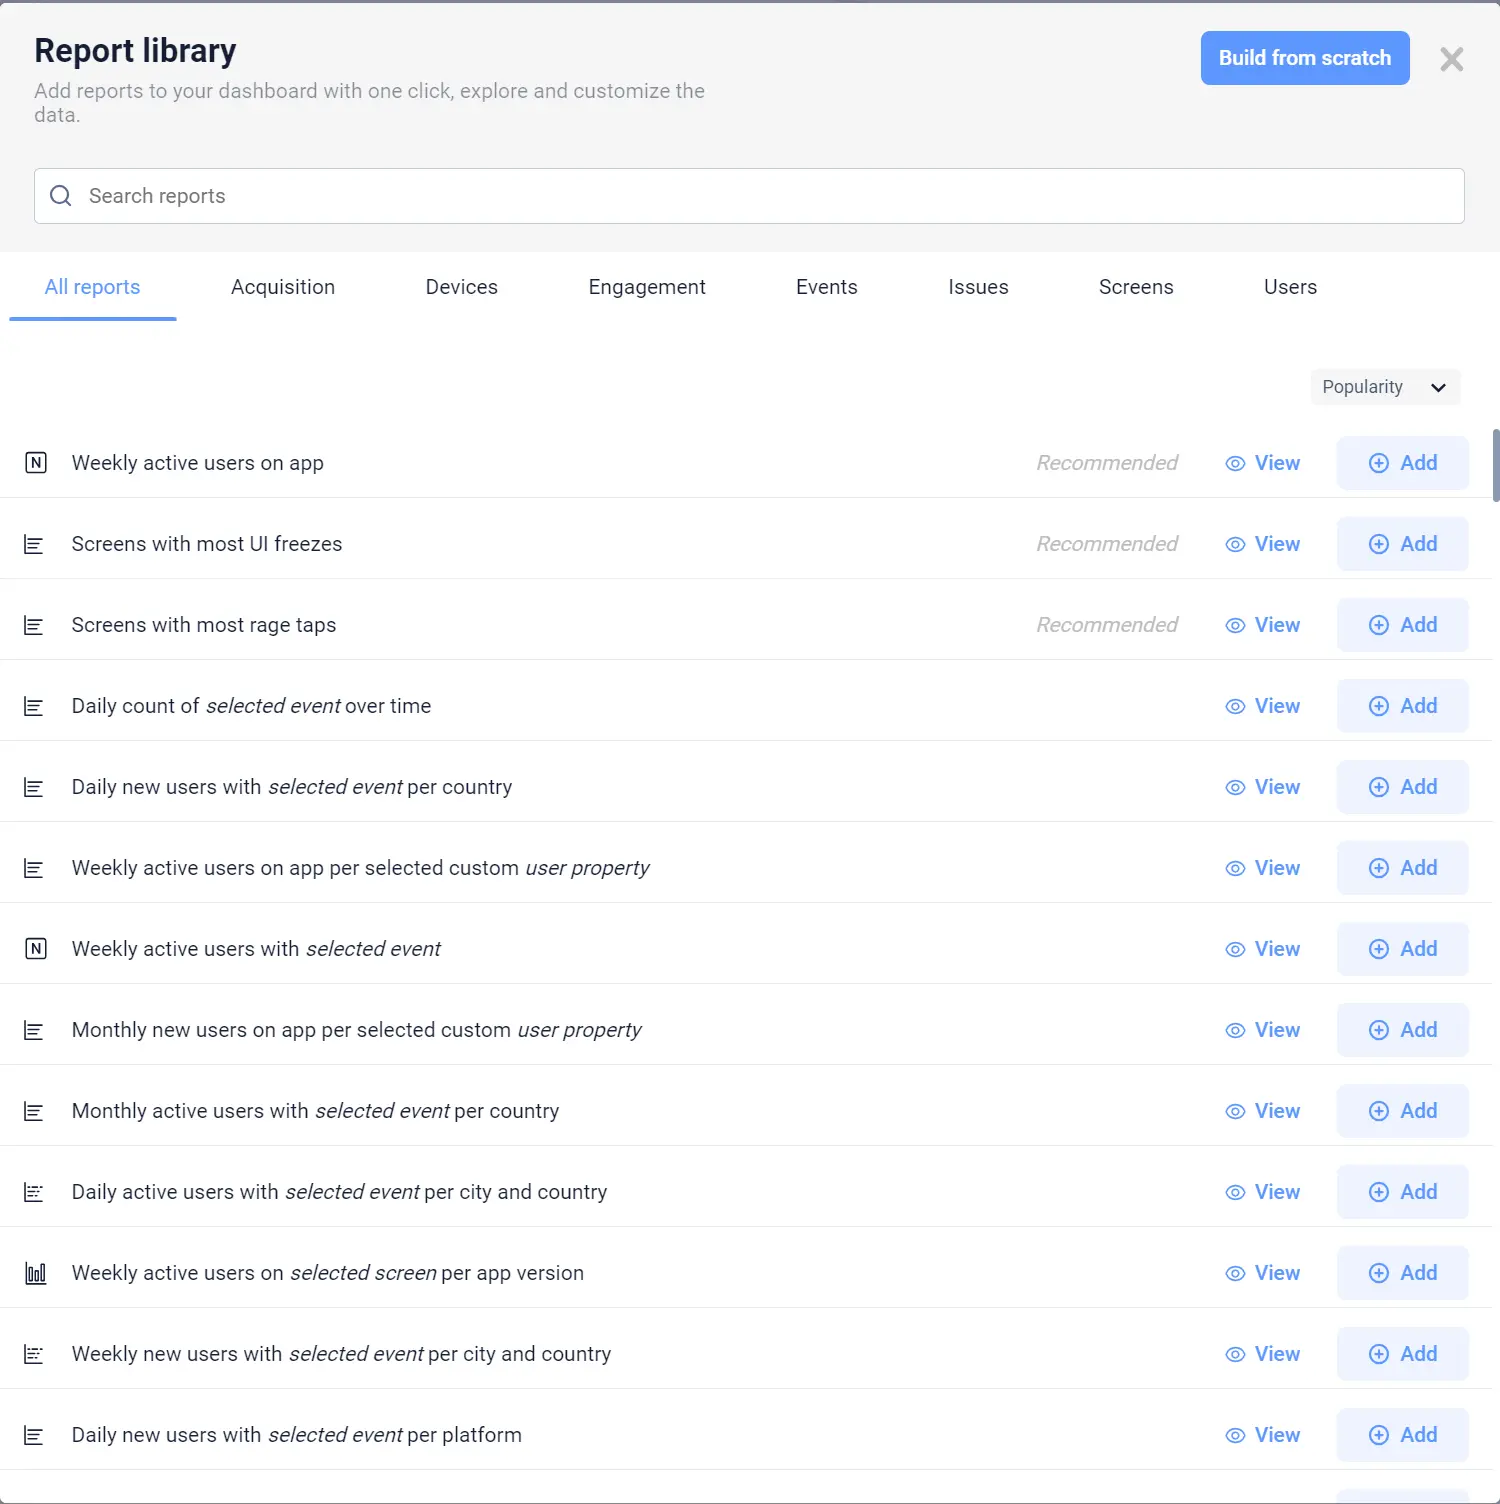
To do this, open up a new dashboard and click Add Report. Then, navigate to the Engagement tab to find the specific reports you want to add. For basic insights, you can add reports for DAU or MAU with a selected event or screens (e.g., “Feature A opened” or “Action B performed”).


For more in-depth insights, you can add reports with additional details, like:
App version
Platform
Device type
Since UXCam’s dashboards are modular, you can add reports for all key features, resize them based on importance, and rearrange them to fit your needs. This allows you to easily track and monitor the adoption of specific features over time, identify any potential issues or roadblocks, and make data-driven decisions to improve user engagement.
2. Monitor issues and frustration
Another valuable use case is monitoring issues (UI freezes, crashes, etc.) and user frustration. As a general rule, fewer issues leads to less frustration—which ultimately improves user adoption.
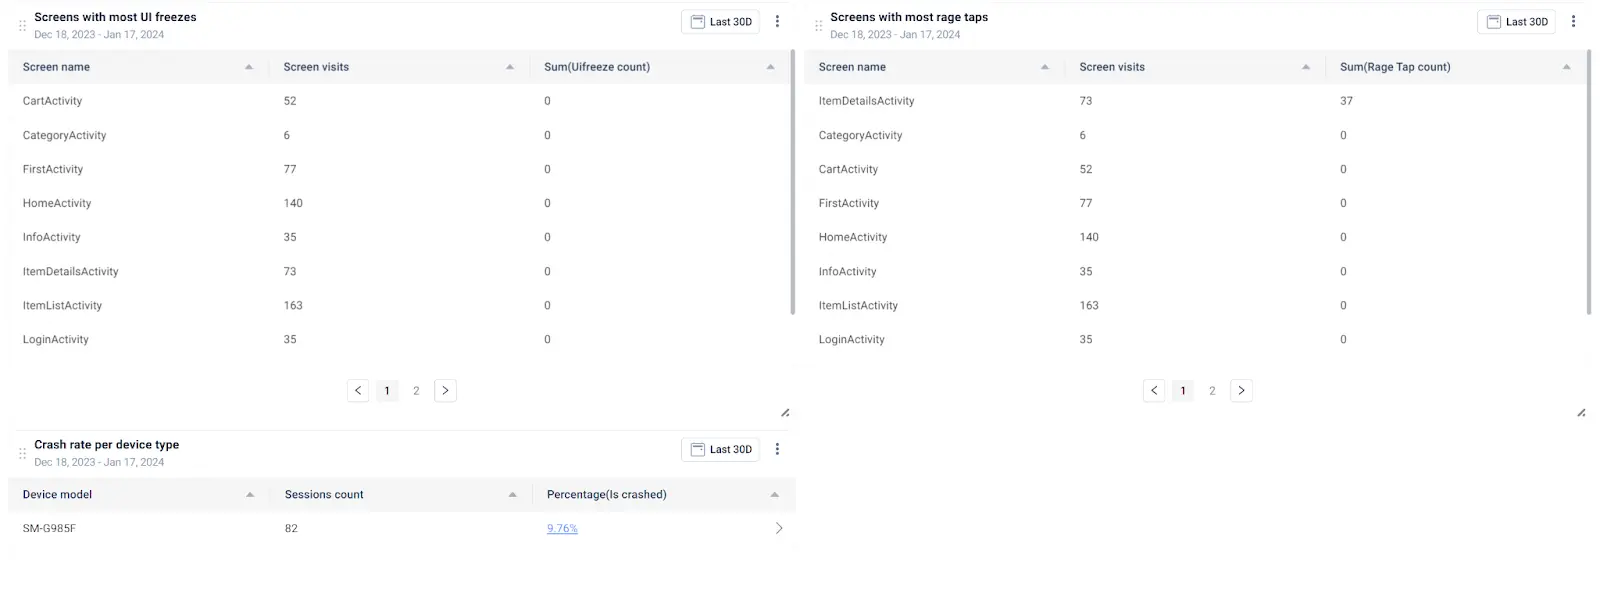
To create this dashboard, you’ll follow the same steps as you did above. But this time, you’ll navigate to the Issues tab of the report library.


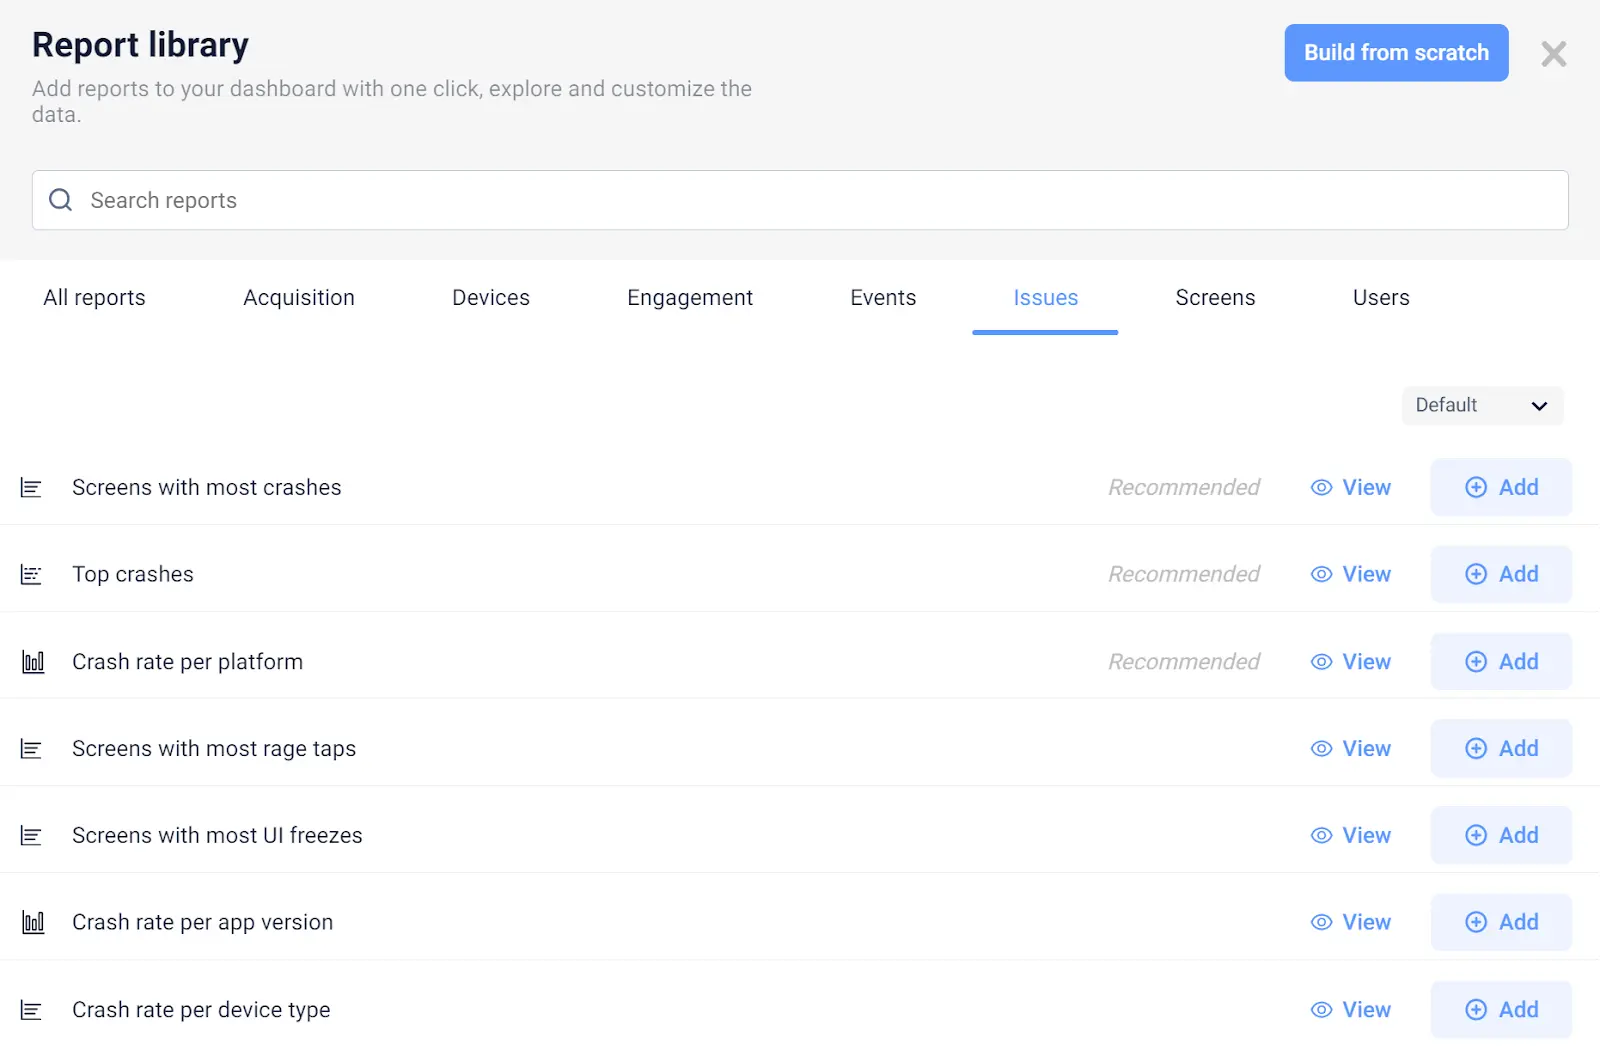
There you’ll find reports for:
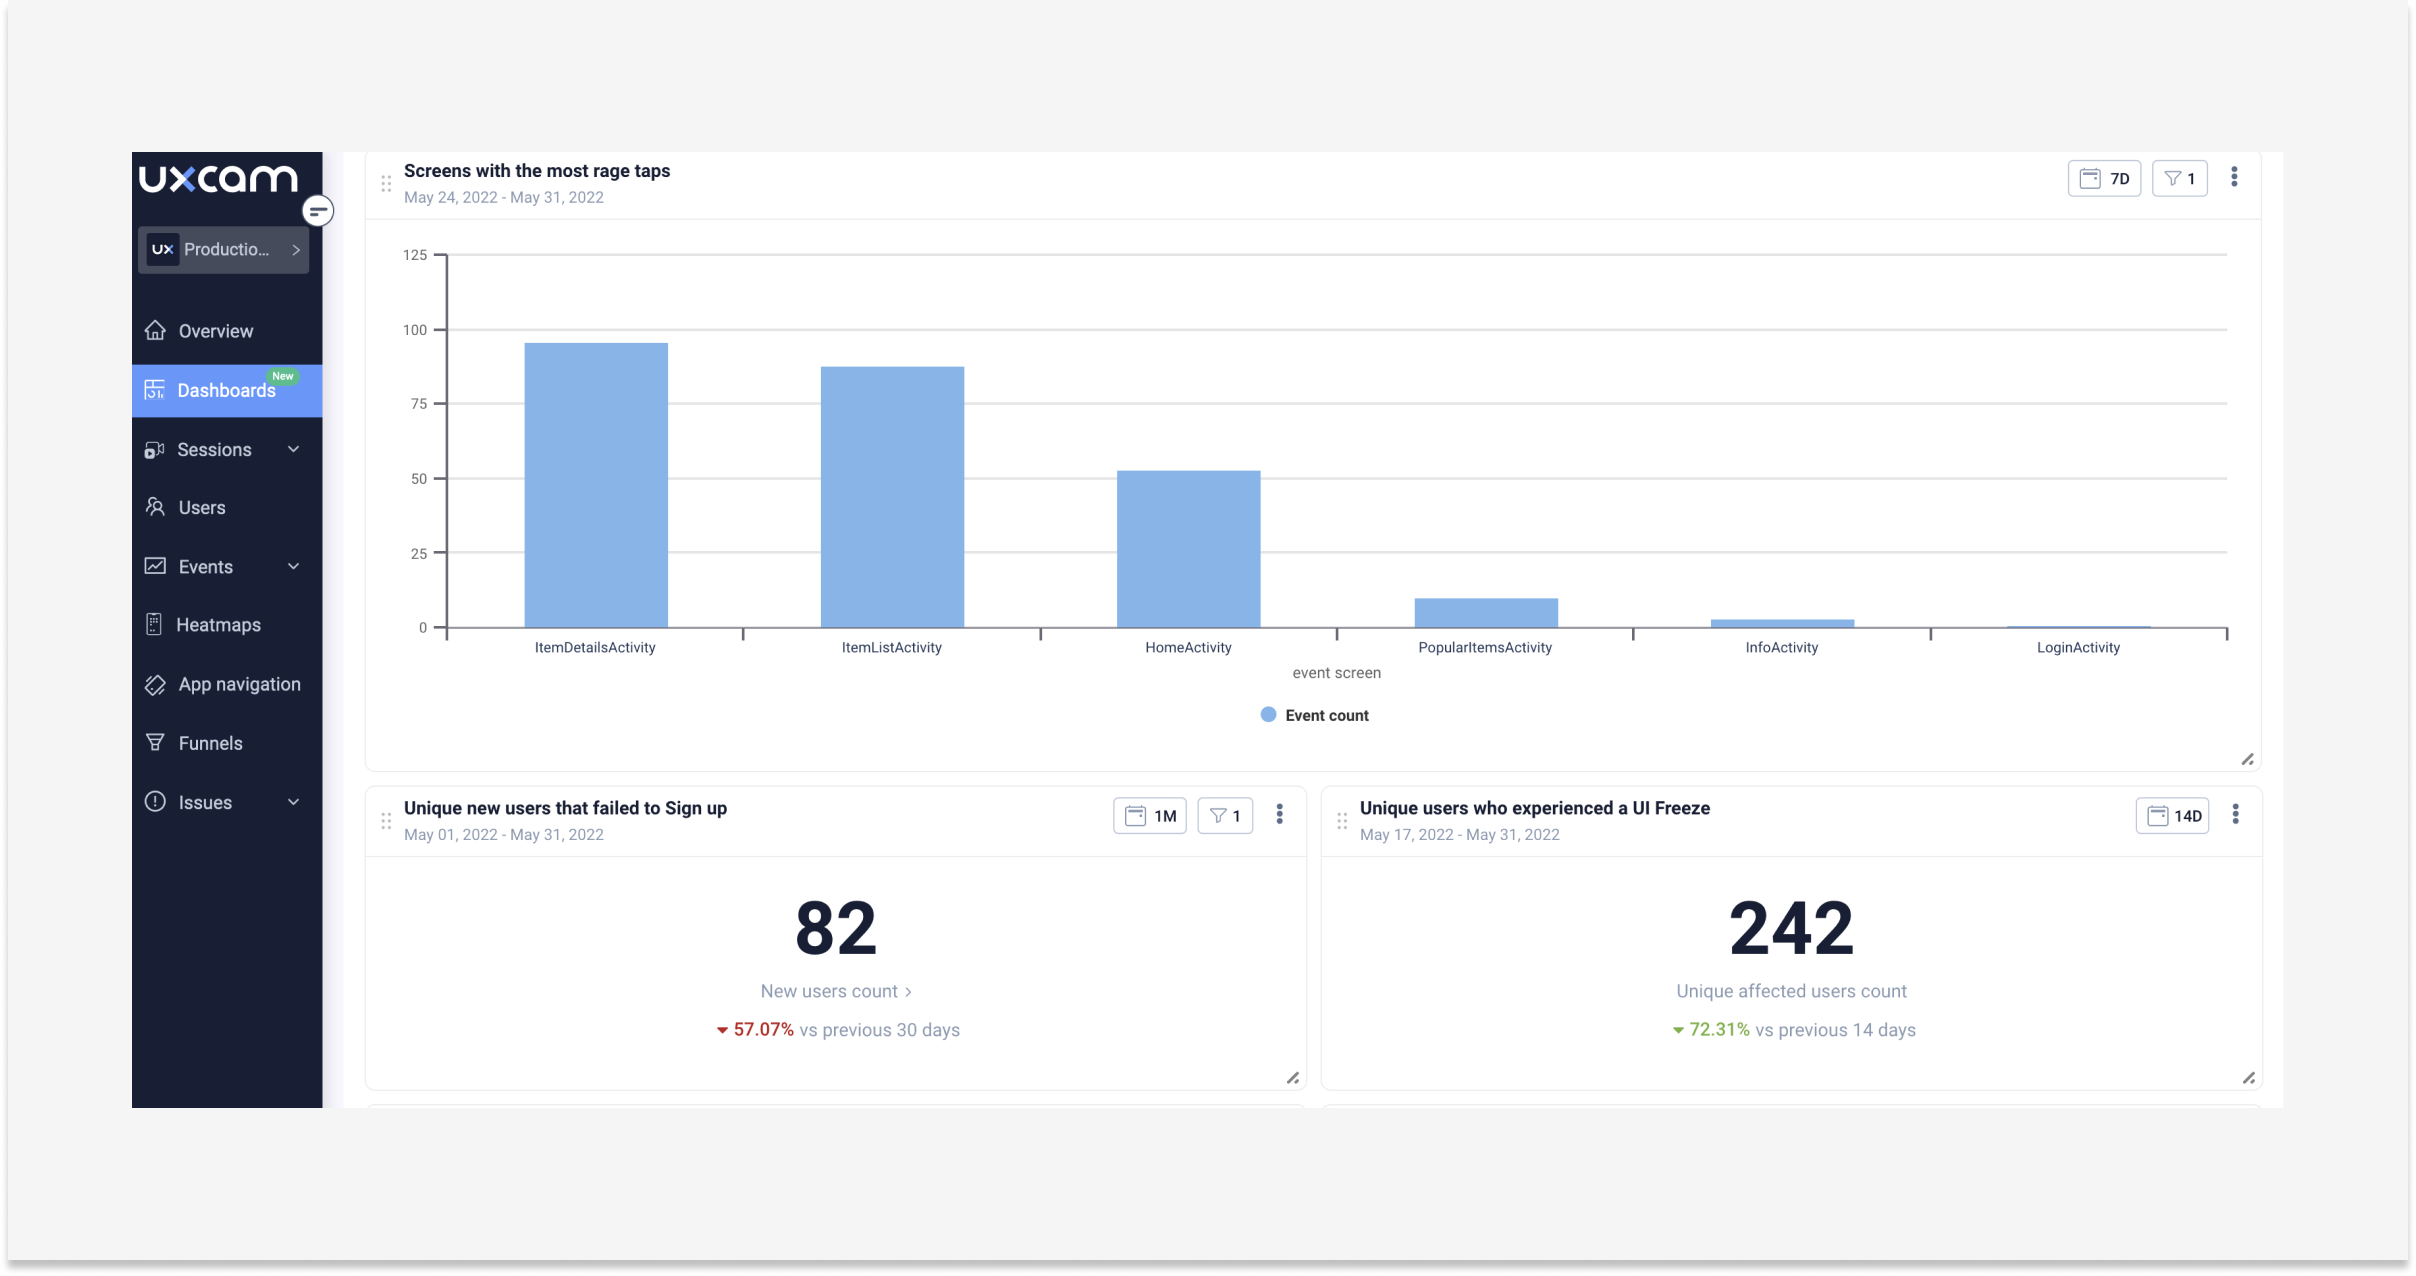
Screens with most rage taps
Screens with most UI freezes
Screens with most crashes
Top crashes
Crash rate per app version
Crash rate per platform
Crash rate per device type
Building a dashboard with these reports is a great way to monitor your app’s performance and troubleshoot any issues that may arise. By including reports that target specific platforms or device types, you can identify and resolve issues that may only affect a certain group of users.


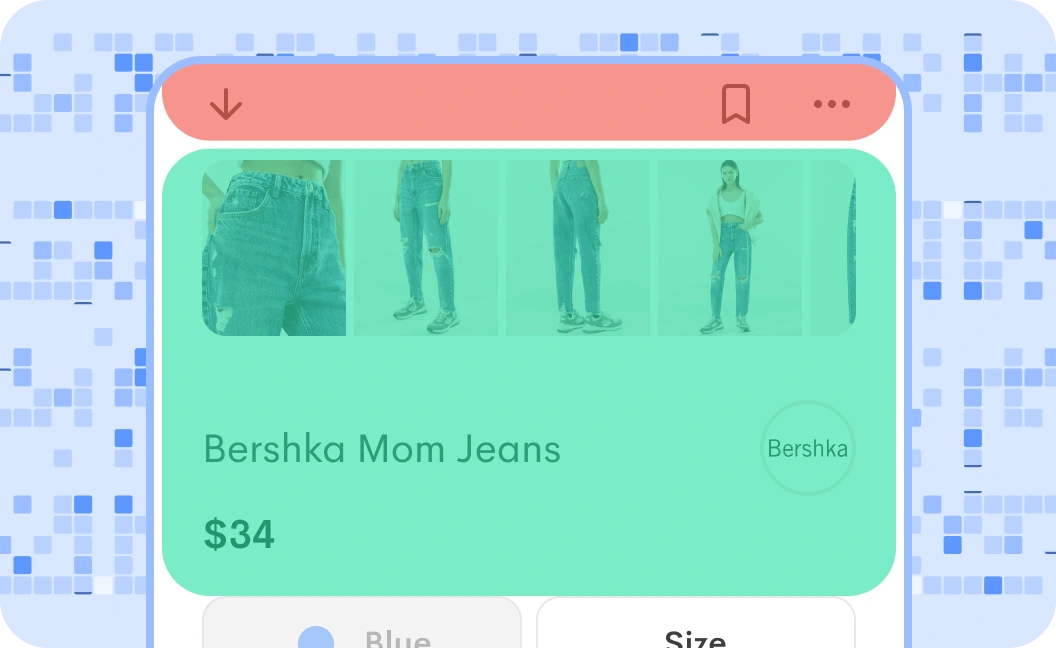
Rage taps give you an opportunity to segment users who are experiencing issues.


You can then zoom in on individual experiences using tools like session replays and user feedback to understand the root cause of their frustration and make improvements accordingly.


3. Track usage over time
Finally, it’s important to track the overall usage of your app over time using dashboards. This can give you insights into how well your app is performing and whether it's meeting the needs and expectations of your users.
Use metrics like:
Daily active users
Monthly active users
Session length
DAU/MAU ratio
These metrics can help you understand user engagement and identify any drops or spikes in usage. By tracking these metrics over time, you can also see the impact of any updates or changes made to your app.
Additionally, dashboards allow you to compare your app's performance against industry benchmarks, giving you a better understanding of where your app stands in the market.
Conclusion
This user adoption dashboard guide covers everything you need to know about improving user engagement and satisfaction. It explores important elements like data visualization, key metrics, and user journey. Gain valuable insights to enhance your product adoption strategies.
If you’re looking for a powerful, flexible mobile analytics platform that empowers your team with dashboards, look no further than UXCam.
Get started with a free trial and see the impact of data-driven decisions on your app’s success.
You might also be interested in these;
5 Most Important User Adoption Metrics to Track and Measure
User Adoption Strategy - How to Win & Keep Loyal App Users
How To Measure Product Adoption (Metrics, Formulas & Tools)
User Stories vs. Use Cases: A comprehensive guide
The only 10 slides you need to present session replay findings
AUTHOR
Tope Longe
Product Analytics Expert
Ardent technophile exploring the world of mobile app product management at UXCam.


Related articles


Product best practices
12 Apps with Great User Onboarding (2026 Examples)
The 12 mobile app onboarding flows I'd study if I were designing one today, with specific callouts for what each does well, common mistakes, and the...


Silvanus Alt, PhD
Founder & CEO | UXCam


Product best practices
Why creating a data-driven culture has less to do with data than you think
Kishan Gupta, CEO, shares 5 tips and techniques for fostering a data-driven culture based on his own experiences building and leading...


Kishan Gupta
Co-Founder of UXCam


Product best practices
Finance apps have a customer support problem, here's how to fix it
Learn about the customer support problem in finance apps and practical solutions to fix it in our latest blog post, and improve user satisfaction and...


Jane Leung
Product Analytics Expert