5 KPIs to measure your new feature adoption

L2ooking to learn how to measure and track feature adoption metrics? The user research has been done, you’ve built a cool new feature for your app, iterated 100 times, and finally released it into the wild. The users are sure to love it and begin using it straight away, right?
One of the common issues with feature releases is that mobile teams either don’t have the time, or don’t know how to measure the success of that new feature release. Putting focus into measuring your feature adoption rate with a mobile app analytics tool means you’ll have a clearer understanding of a few important points:
How often users interact with different features
What users really utilize features for
When users begin to use a feature as a habit
Where users drop off
Throughout this article we discuss what feature adoption is, the feature adoption funnel, and 5 KPIs you should be measuring to gain insights into app improvement and track feature adoption.
Summary - Top Feature adoption metrics
| Metric | What it measures |
|---|---|
| Feature Adoption Rate | The percentage of users who have interacted with a specific feature relative to the total number of users. |
| Time to Adoption | The time duration from a user's first interaction (or sign-up) to the moment they engage with a specific feature. |
| Frequency of Use | The average number of times active users interact with a specific feature within a given period. |
| User Retention Rate | The percentage of users who continue using the app (or feature) over a specified period. |
| Drop-off Rate | The percentage of users who initiate a process (e.g., onboarding, checkout) but do not complete it, indicating potential usability issues. |
What is feature adoption?
Feature adoption refers to the process by which users start using and incorporating new features offered by an app as a habit in their usage. Product teams use this metric to measure the success of a new feature and understand user behavior towards it.
To get a better understanding, let’s take a look at feature adoption in relation to the fintech industry:
Digital banking: Digital banks like Chime and Revolut offer banking services through mobile apps. Revolut has a feature called ‘rewards’ where users can get discounts or cashback when purchasing an item with their Revolut account. They can measure feature adoption by tracking how often users click on the ‘copy code and redeem’ button within their ‘rewards’ feature.
Budgeting and personal finance: Apps like Mint offer personal budgeting services. One feature Mint built to be more user-focused is the subscription tracker, allowing users to easily see the total sum of subscriptions they pay for, and cancel them in-app. To track the adoption rate of that feature they can measure how often users interact with the ‘cancel my subscription’ button.
Cryptocurrency trading: Apps like Coinbase allow users to trade cryptocurrencies like Bitcoin. Trading apps can measure feature adoption by tracking how often users successfully use the ‘add cash’ button to top up their trading accounts, and whether they increase their investments over time.
Measuring feature adoption rates is crucial for fintech companies like the above that continually improve their product offerings and need to stay ahead of the competition. It allows teams to evaluate how well individual features resonate with users.
By analyzing user behavior, mobile app companies can gain insights into how their users are interacting with different features and what they are using them for. This information can be used to make data-driven decisions about which features to prioritize, how to improve them, and where to invest resources.
What are the most important feature adoption metrics?
Here are five key performance indicators (KPIs) with their respective formulas to measure feature adoption specifically for fintech apps:
Feature adoption rate
Time to adoption
Frequency of use
User retention rate
Drop-off rate
Feature adoption rate
This KPI measures the percentage of users who have interacted with, or used a specific feature out of the total number of users.
Let’s take an example. You’re running a personal finance app and you’ve released a new feature allowing users to send money to their friends using the same app with just their phone numbers.
To measure how popular and valuable that is to your users we need to work out how many of them are using it routinely.
The formula to calculate the feature adoption rate is:
For example, if a fintech app has 1,500 users, and 3,500 of them have adopted a new feature, the feature adoption rate would be 43%.
Parameters to track the number of users who used a feature successfully on UXCam:
Event: Add delivery Metric: Count of users with event


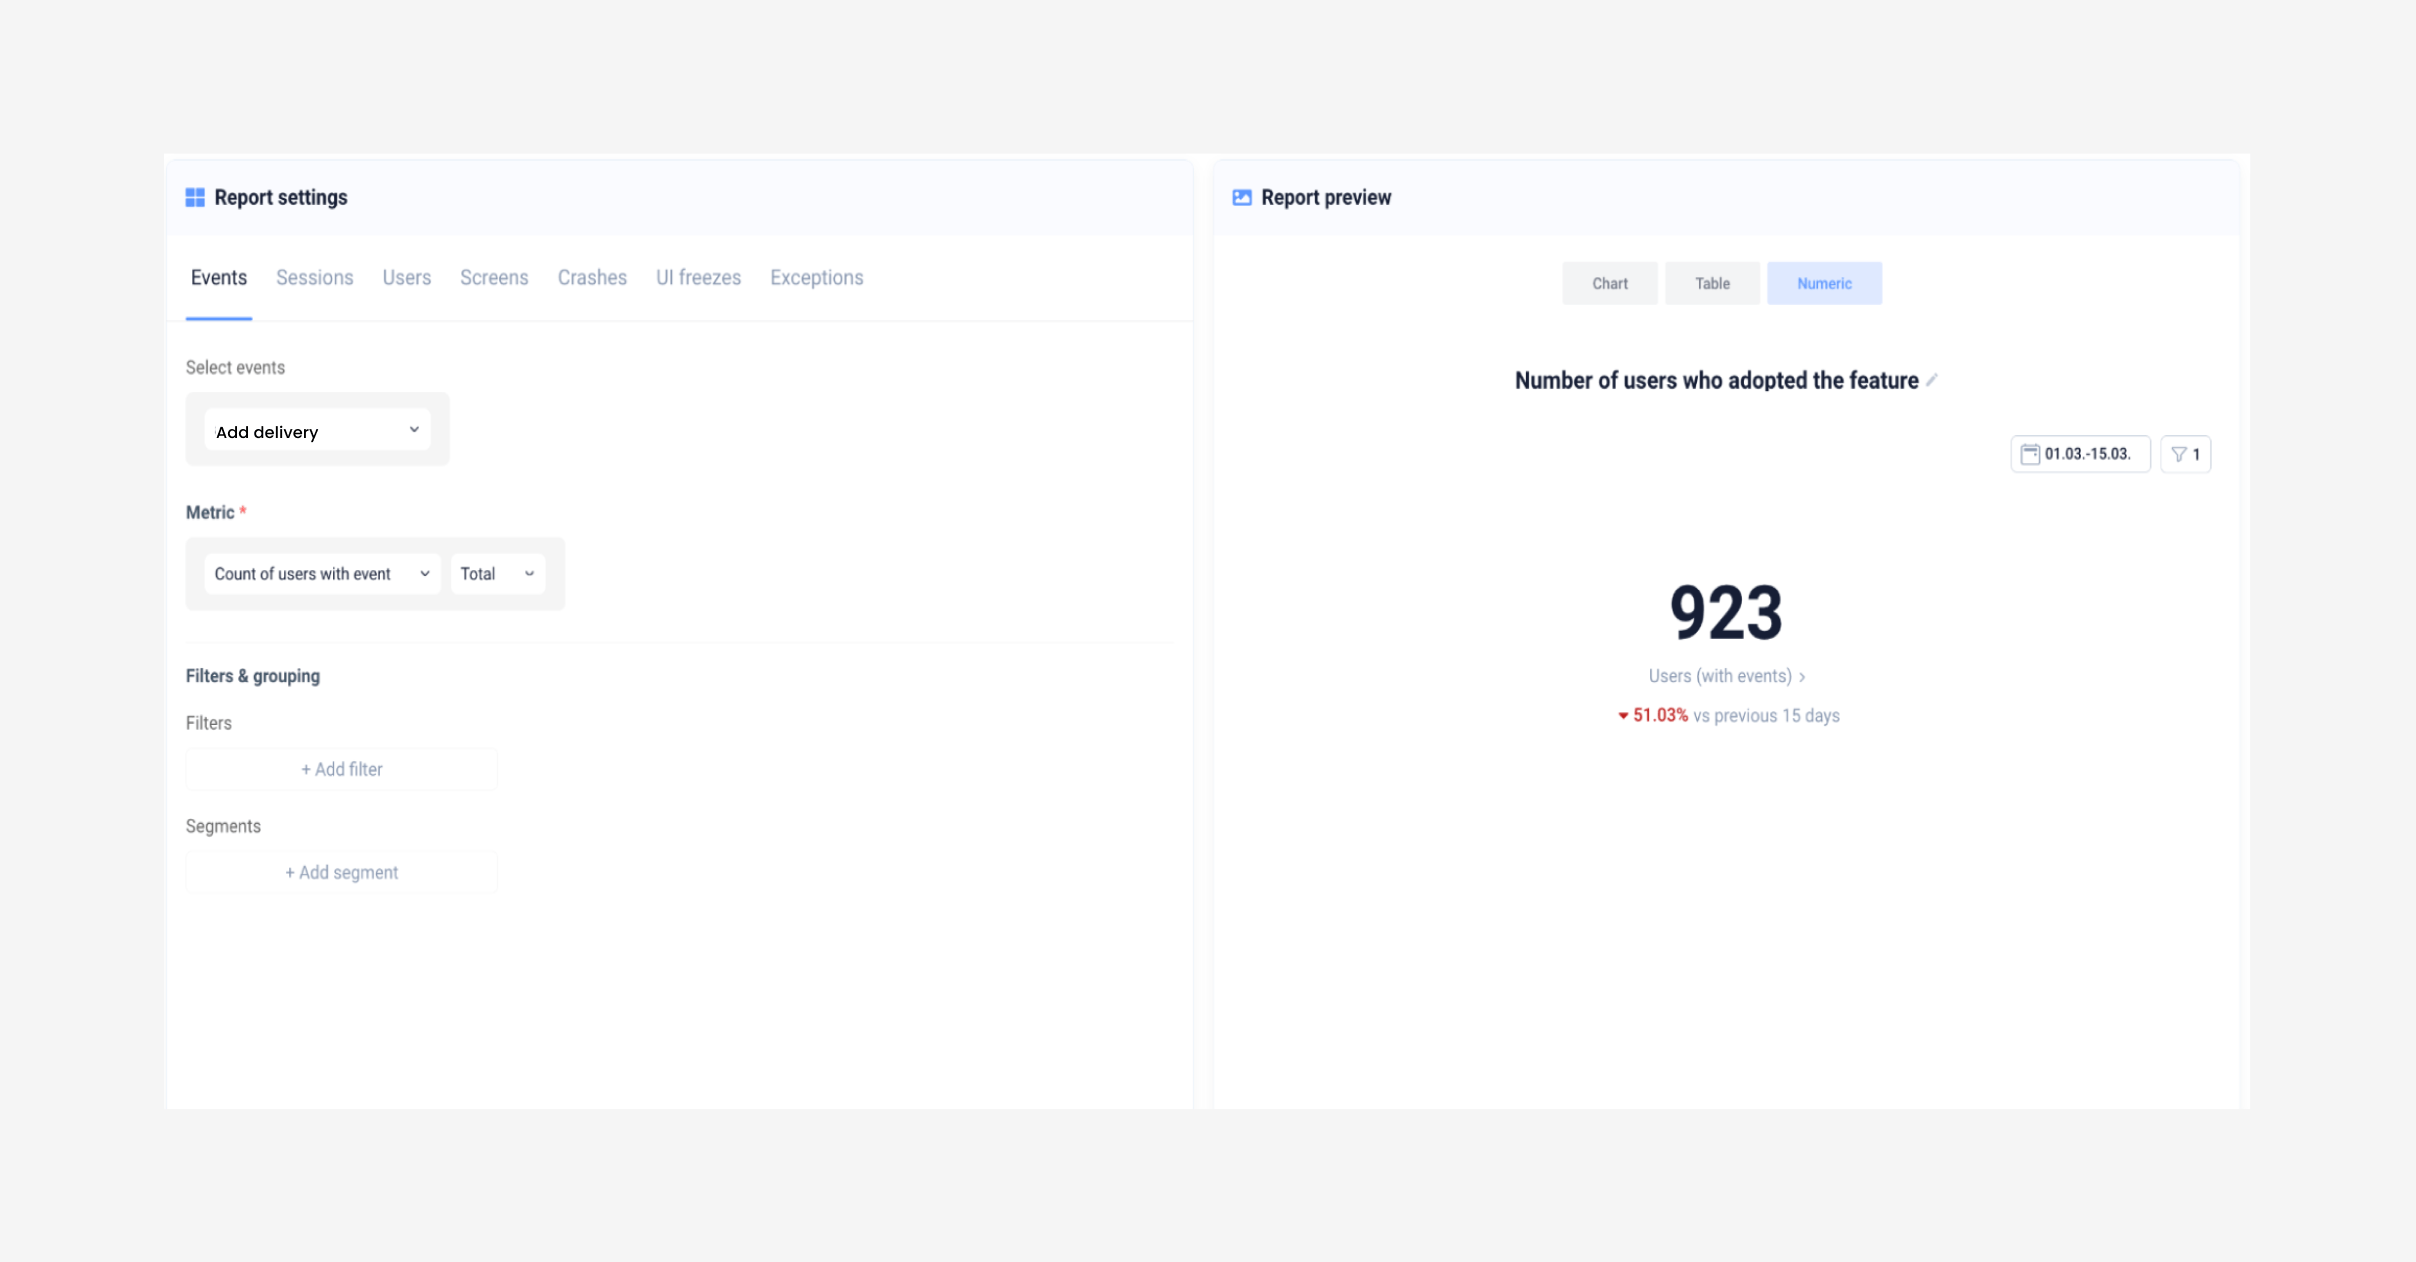
Parameters to set up report in UXCam
Time to adoption
Time to Feature Adoption is a metric that focuses on measuring the time it takes for a user to start using or engaging with a specific feature within your product or app after their first interaction or sign-up.
This metric helps you understand how quickly users are discovering and utilizing different features, providing insights into feature usability and user behavior. Here's how you can calculate it:
Formula for Time to Feature Adoption: Time to Feature Adoption = Date of Feature Adoption - Date of First Interaction
Date of First Interaction: August 1, 2023
Date of Feature Adoption: August 15, 2023
Using the formula:
Time to Feature Adoption = Date of Feature Adoption - Date of First Interaction Time to Feature Adoption = August 15, 2023 - August 1, 2023 Time to Feature Adoption = 14 days
Frequency of use
This KPI measures how often users are using a specific feature. The formula to calculate the frequency of use is:
Frequency of Use = (Total Number of User Sessions / Total Number of Active Users)
Let's consider a fitness app. In a given month, the app had a total of 10,000 user sessions (each session representing a single interaction or usage instance). During that month, there were 2,000 active users.
Using the formula:
Frequency of Use = (Total Number of User Sessions / Total Number of Active Users) Frequency of Use = (10,000 / 2,000) Frequency of Use = 5
In this example, the frequency of use for the fitness app in that particular month is 5. This means that, on average, each active user interacted with the app 5 times during the month.
How to calculate frequency of use on UXCam dashboards:
Build a report for the Count the frequency of events in a specific time frame
Then build another report for the number of users who adopted the feature in the same time frame. Divide the frequency of events by number of users as per the formula above and — tada, you get the frequency of usage.
In our example below it would be 578 / 66 = 8.75.


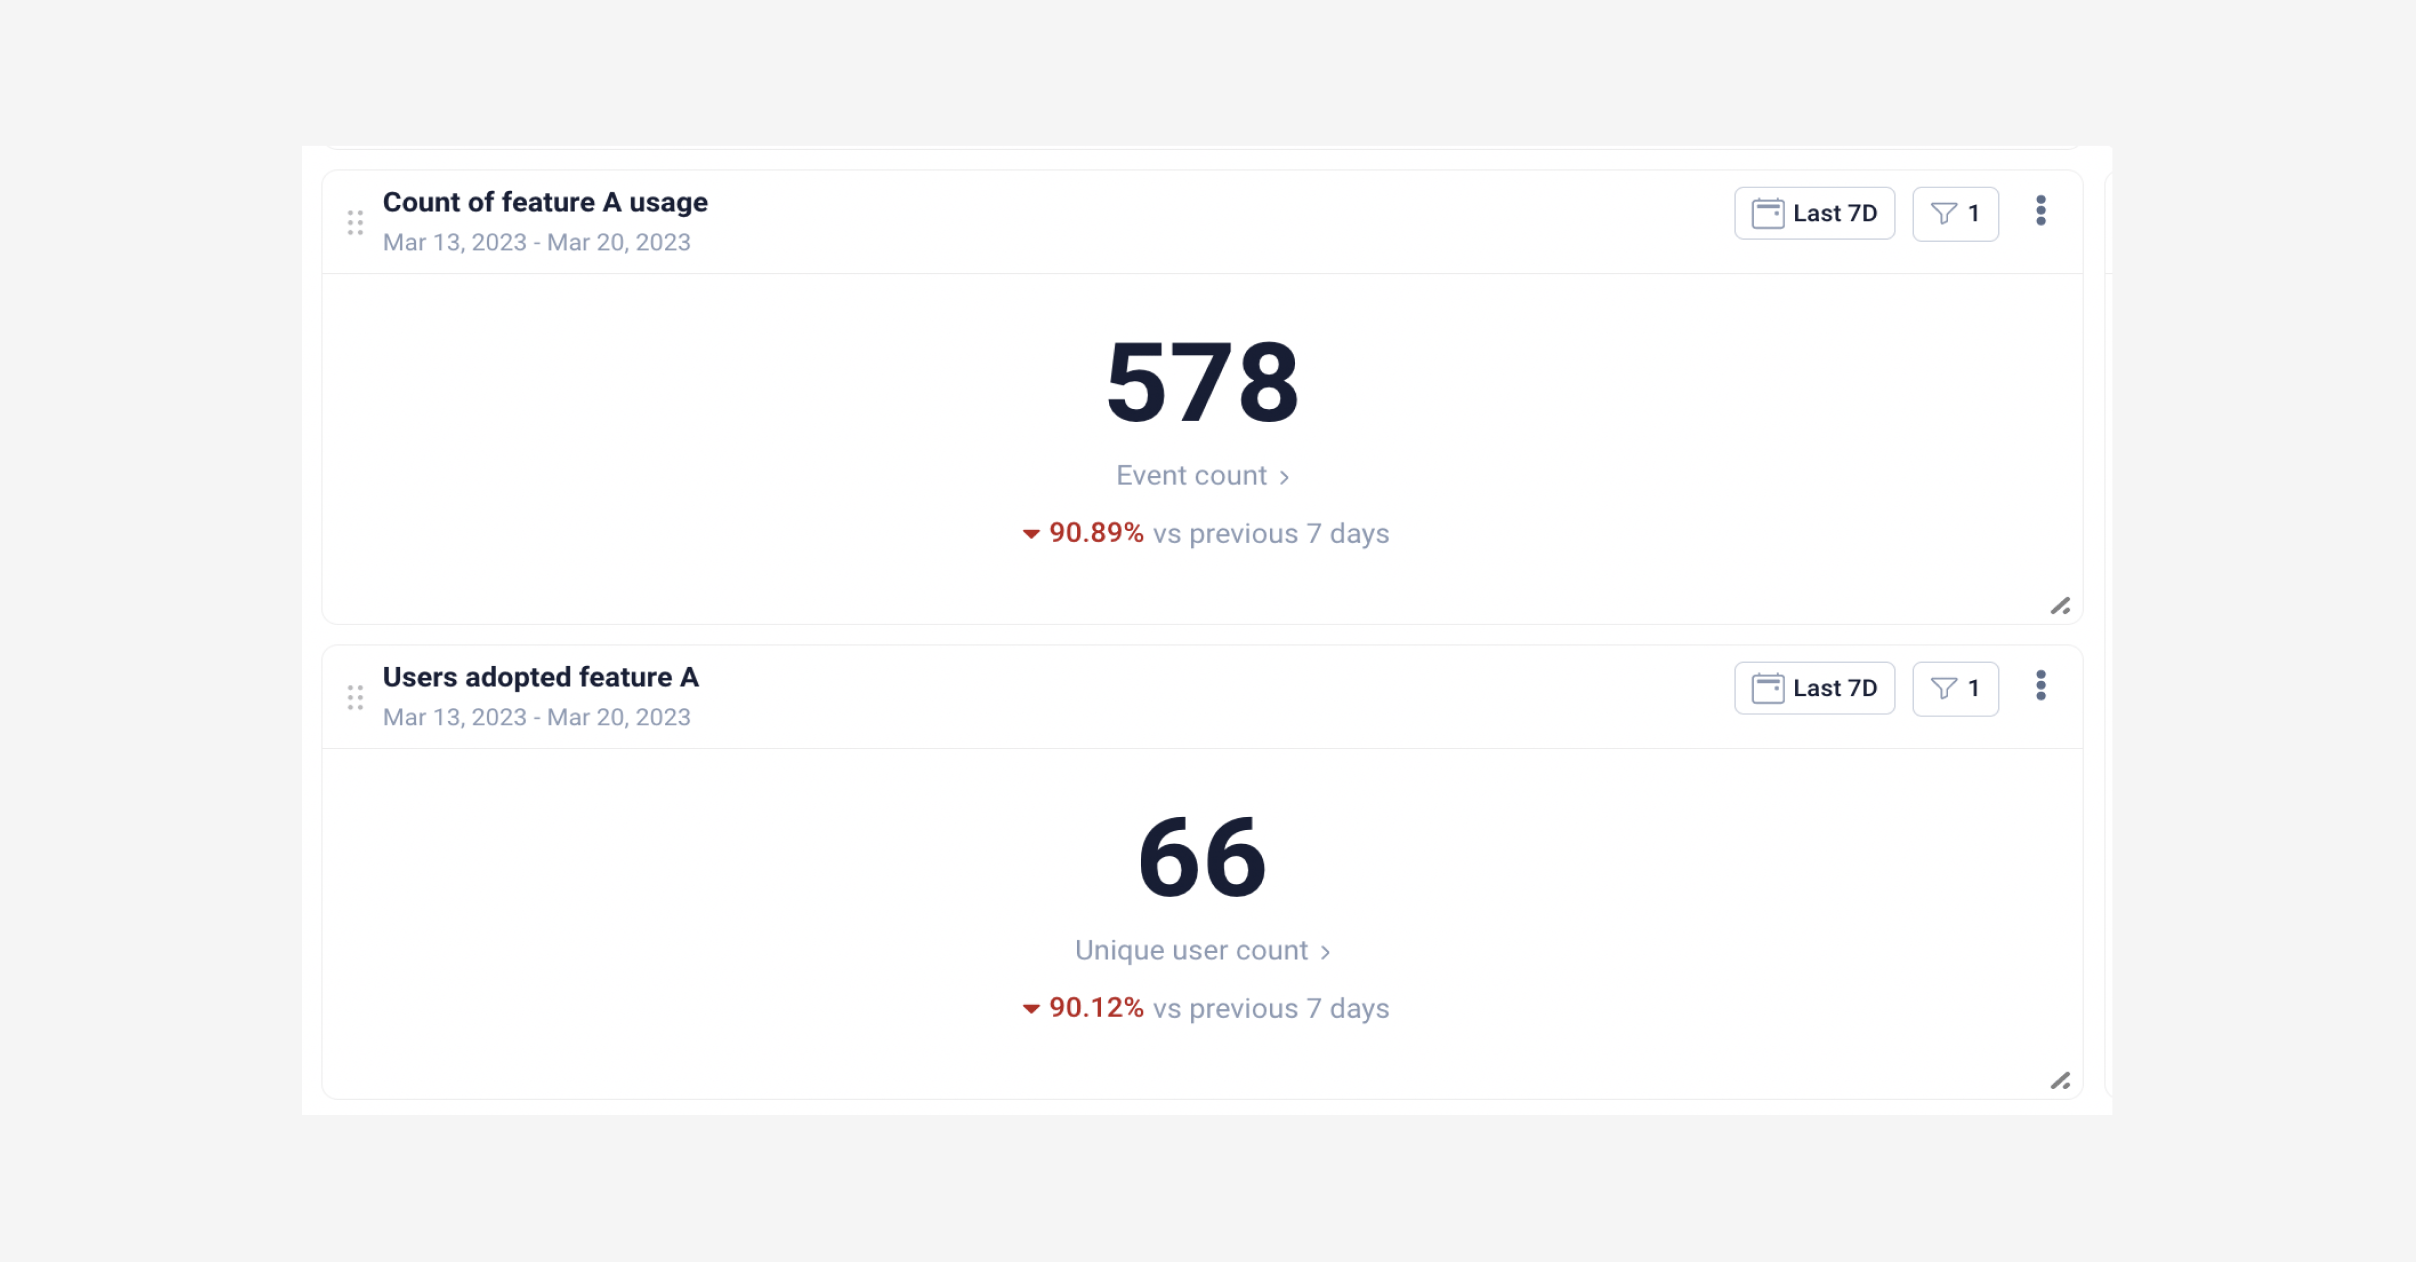
Parameters for feature adoption reports
User retention rate
This KPI measures the percentage of users who continue to use the app after adopting a new feature. The formula to calculate the user retention rate is:
Retention Rate = (Number of Users at the End of a Period / Number of Users at the Start of a Period) * 100
Let's consider a fitness app that had 1,000 new users download and sign up in the month of July. By the end of August, 600 of these users are still active in the app. The retention rate for the month of August would be:
Number of Users at the Start (July): 1,000
Number of Users at the End (August): 600
Using the formula:
Retention Rate = (Number of Users at the End / Number of Users at the Start) * 100 Retention Rate = (600 / 1000) * 100 Retention Rate = 60%
In this example, the mobile app's retention rate for the month of August is 60%. This means that 60% of the users who downloaded and signed up in July continued to use the app in August.
Drop-off rate
The drop-off rate, also known as the user drop-off rate or abandonment rate, is a metric in mobile app analytics that measures the percentage of users who start a specific process or flow within the app but do not complete it. It indicates points of friction, user dissatisfaction, or usability issues within your app. The formula for calculating the drop-off rate is:
Drop-Off Rate = (Number of Users Who Start the Process - Number of Users Who Complete the Process) / Number of Users Who Start the Process * 100
Let's consider an e-commerce mobile app with a checkout process. In a certain week, 1,000 users added items to their cart (started the process), but only 700 users completed the checkout process.
Using the formula:
Drop-Off Rate = (Number of Users Who Start the Process - Number of Users Who Complete the Process) / Number of Users Who Start the Process * 100 Drop-Off Rate = (1,000 - 700) / 1,000 * 100 Drop-Off Rate = 30%
In this example, the drop-off rate for the checkout process in the e-commerce app is 30%. This means that 30% of users who started the checkout process did not complete it.
If you are using an app analytics tool like UXCam, drop off rate will be automatically shown once you build your conversion and data starts populating.


The process of feature adoption
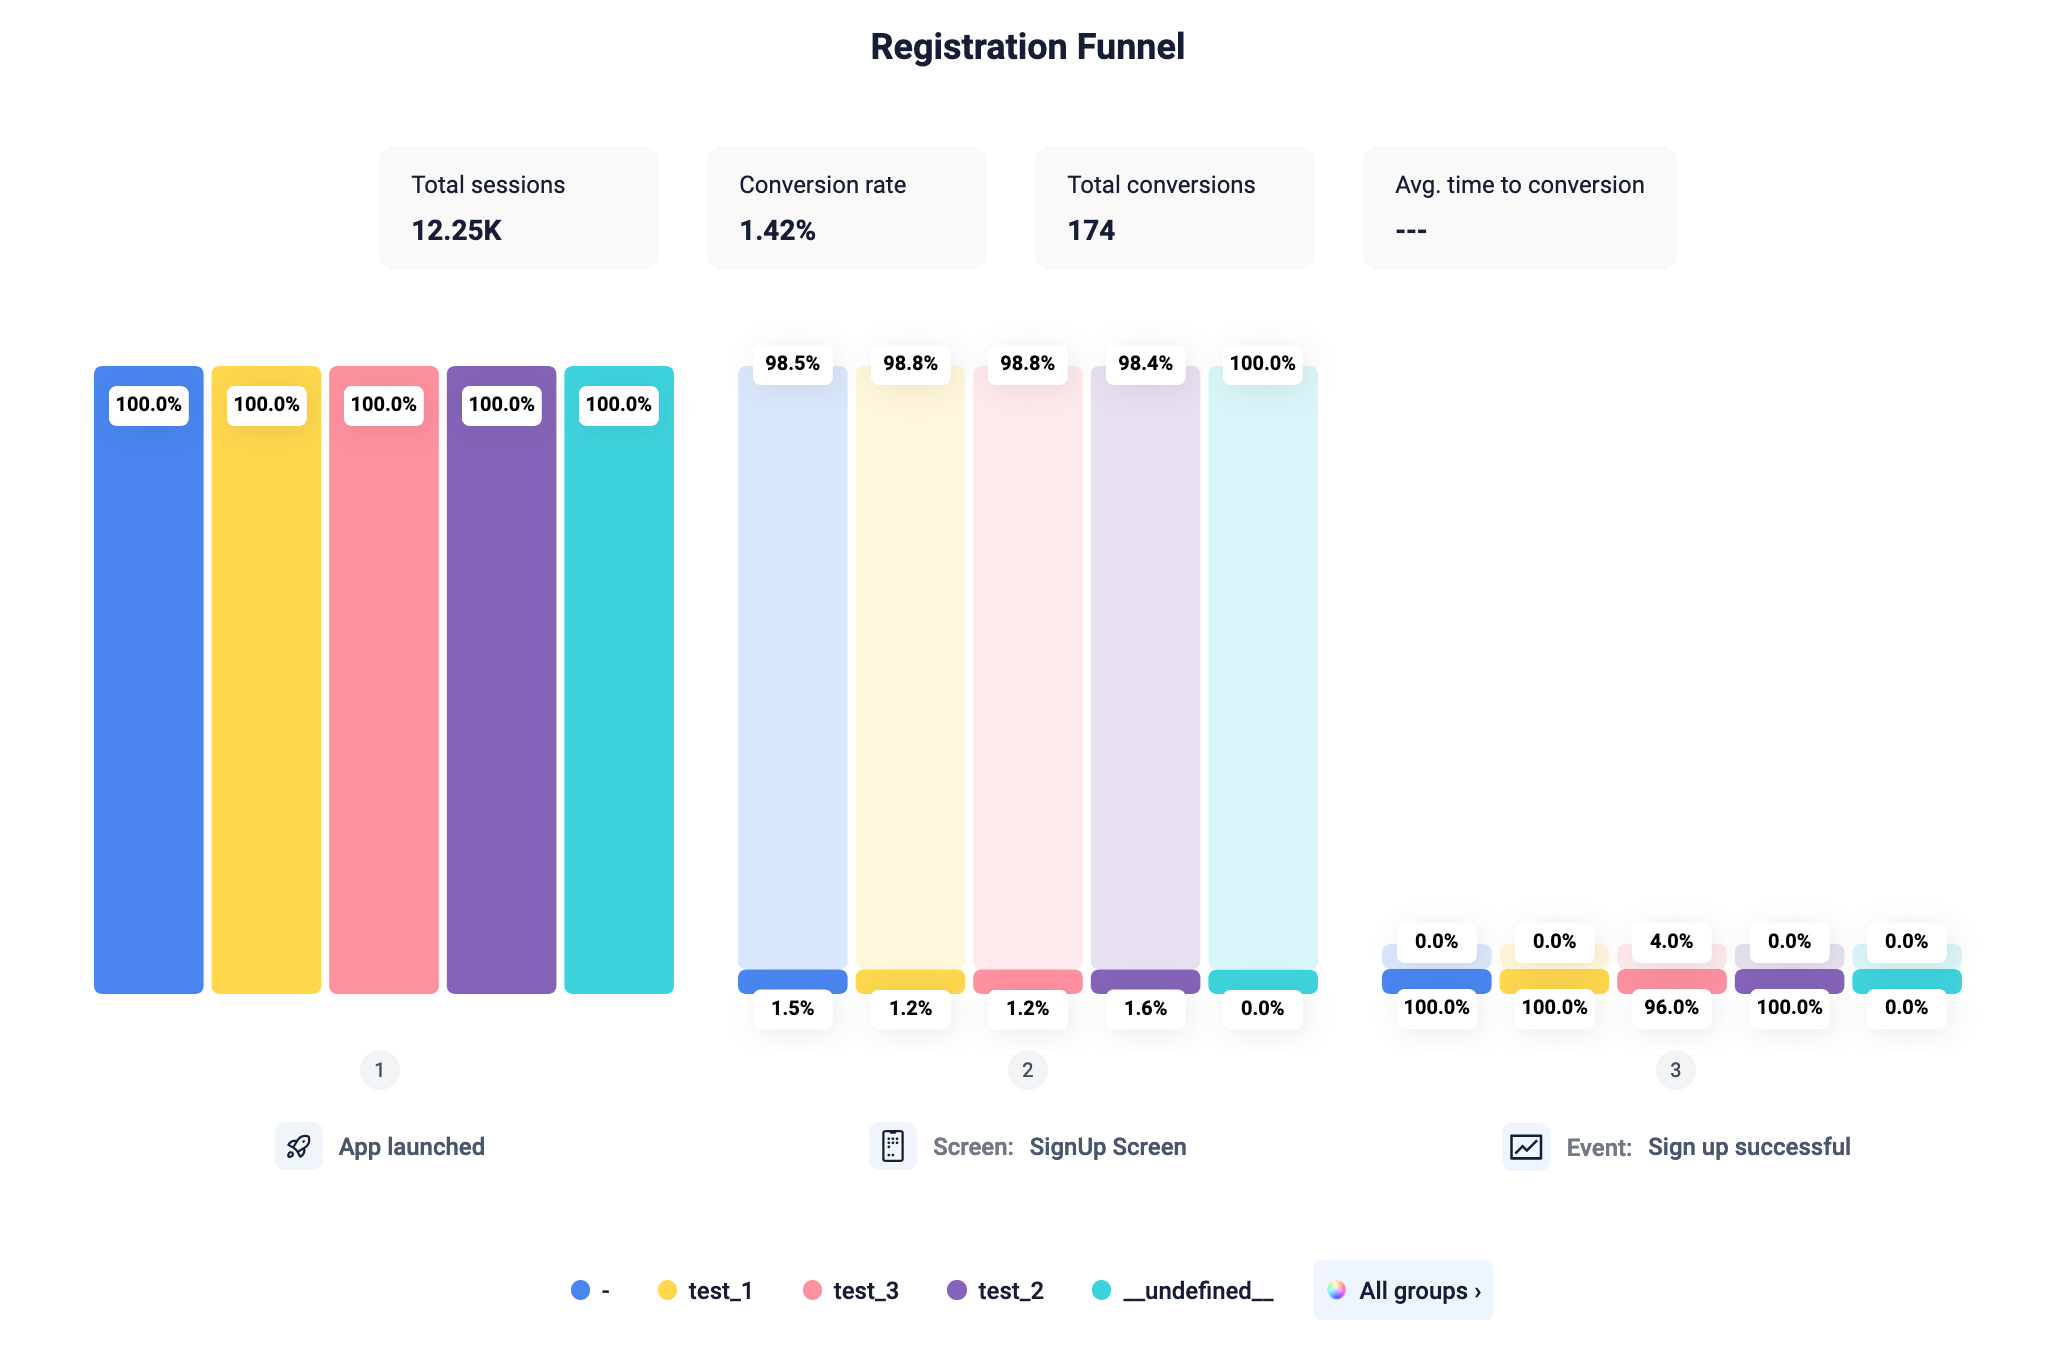
The feature adoption funnel is a way to visualize the various stages of the feature adoption process. At each stage, users either continue through the funnel towards adoption, or drop out of the process altogether.


The feature adoption funnel in action
There are 4 distinct stages of feature adoption. Let’s say you run a financial app and you discover a user needs to have different ‘vaults’ which act like saving spaces for particular occasions, instead of only having a single saving space.


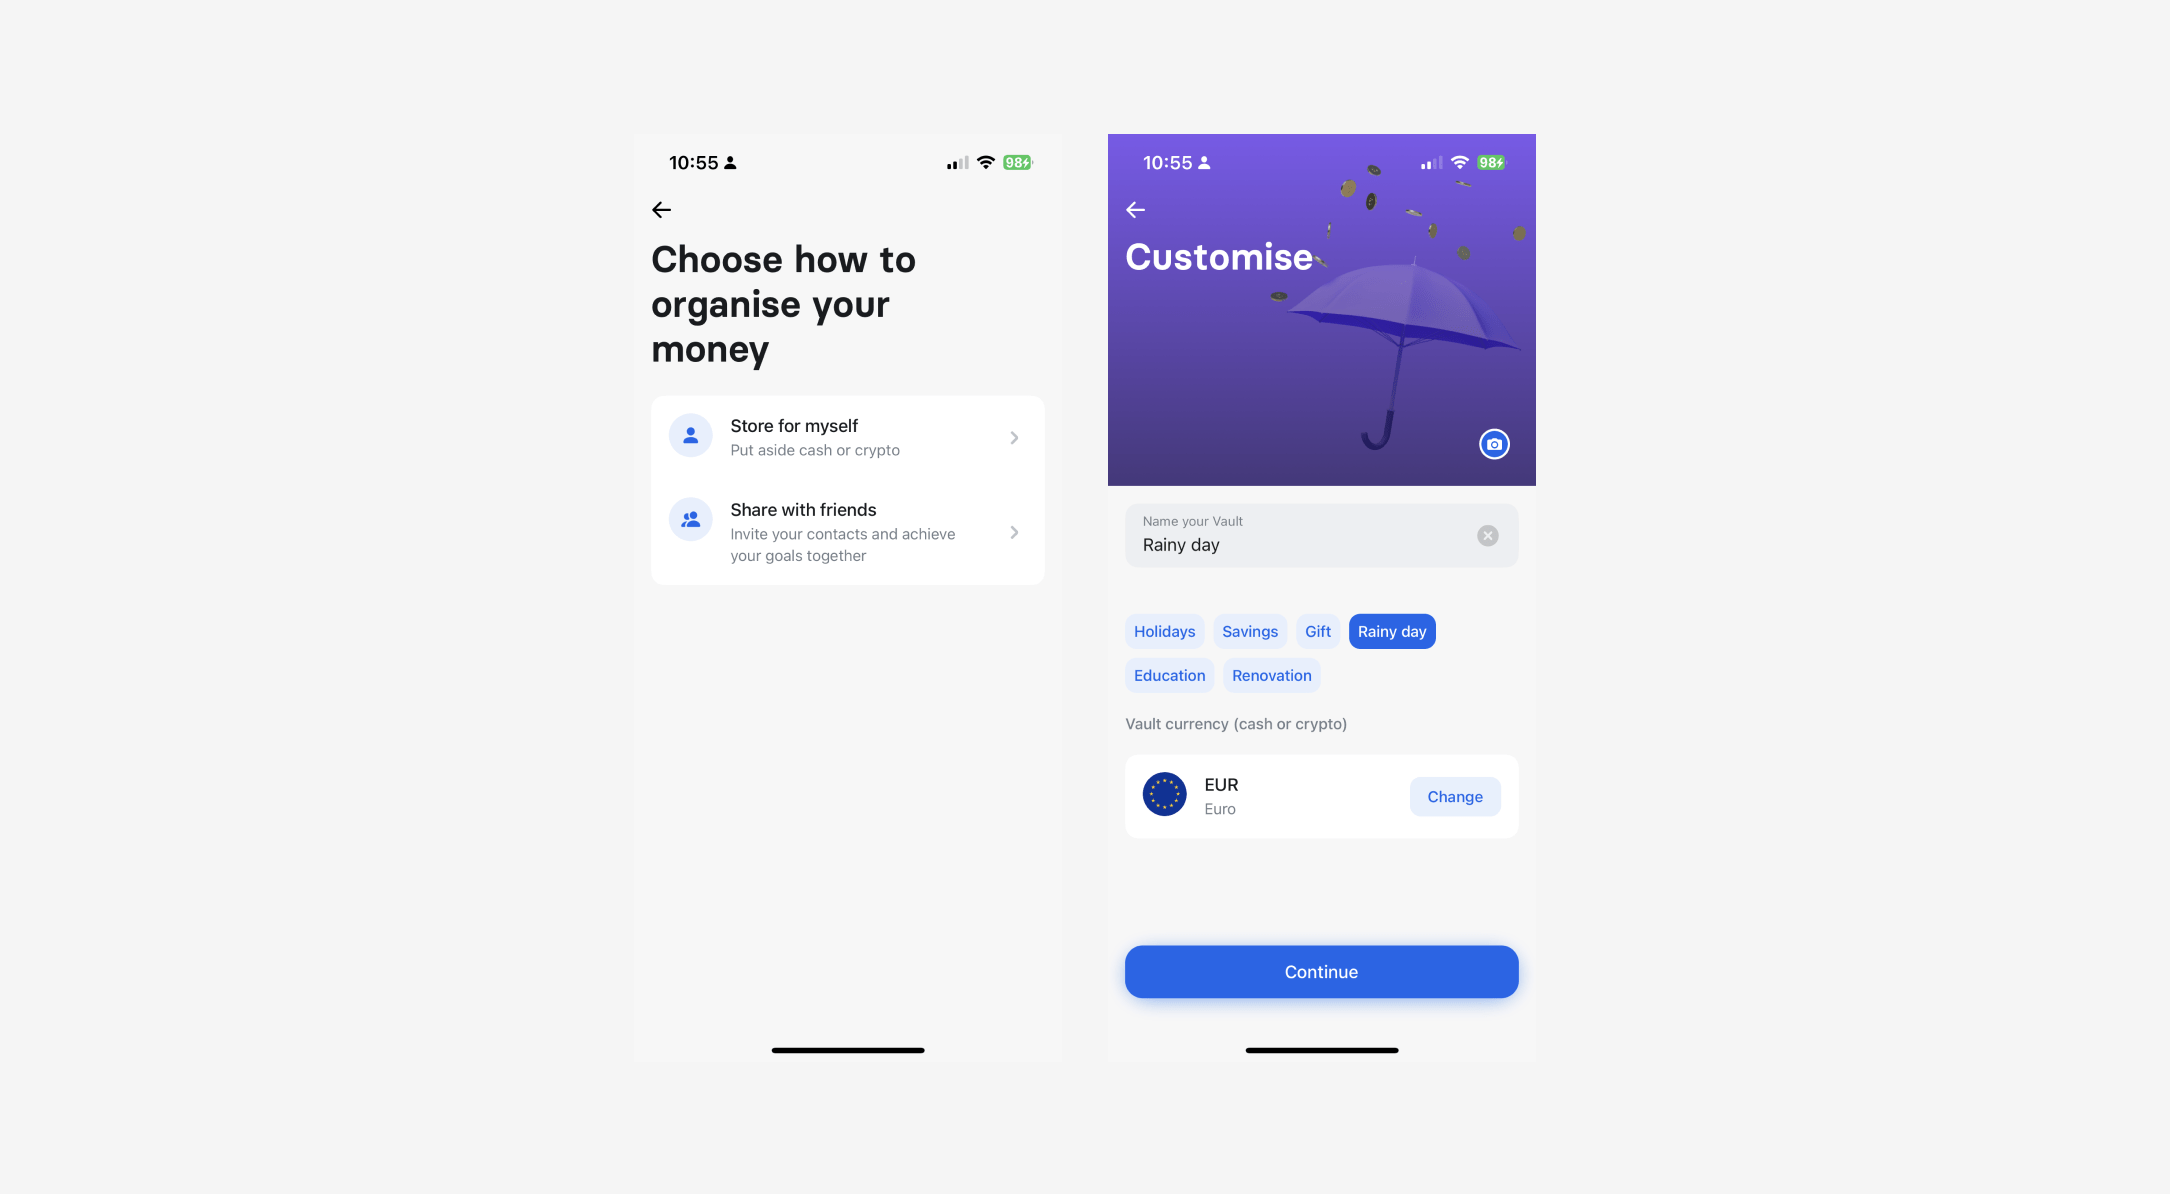
Example of 'vaults' feature in Revolut
The feature adoption journey for ‘vaults’ might look something like this:
Exposed. Users won’t be able to utilize the new feature if they don’t know it exists. Tell users about the feature and walk them through how to use it by using communication techniques like push notifications, newsletters or emails. Exposure is measured simply by the number of users who landed on the new feature screen.
UXCam automatically tags screen names, saving product teams time when analyzing heatmaps. To keep users' personal information private, you are able to blur and occlude sensitive information like passwords and banking information making user information safe. This is especially important when working with apps in industries like finance or healthcare.
1. Activated. The next step is to know how many users out of the ones already exposed, used the new feature. At this point, the feature adoption funnel has given us a few insights: How long it took users to activate the feature, and how many times they were exposed to the feature before using it.
2. Used. This step measures how engaged your users are after activating and using the new feature. If users aren’t continuing to use the feature, put more effort into highlighting the value of the feature.
3. Used again. The final step is to see how sticky your feature is. Do users come back to it continuously, or do they use it just once? However, remember that not every feature in your app will need continuous use.
Having the metrics for your new feature adoption is a good starting point, but only the beginning. To get adoption rates through the roof, we need to analyze deeper to gain more actionable insights on improving those features.
Improving your app’s feature adoption KPIs
Finance apps can be complex to start with for a lot of users. There are a lot of extra steps a potential user needs to go through before they’re able to fully use the app. Banking apps need to establish a high level of trust with users before they’ll be willing to go through an onboarding process that includes identification checks and approvals.
There are several strategies that fintech apps could try to improve their feature adoption rates. Here are a few:
Gathering data
Step one should always be gathering your numbers. Integrate a mobile app analytics tool to track user behavior and engagement with specific features. This will uncover the unknown improvements you can make to your app for better overall performance.
As well as measuring feature adoption rates, mobile app analytics tools like UXCam can also support product teams with:
Improving the flow of your onboarding process
Monitor issues and crashes
Optimize the user journey
If you’d like to see how UXCam can further support your team by providing qualitative insights, try the free trial.
Educate users Walk users through the benefits of a new feature through in-app messaging or pop-ups. This can help users understand how the feature works and why it is useful, which can encourage adoption.
Simplify the onboarding process
Analyzing your onboarding screens will show you how many users are dropping off and at which stages. Set up a customizable dashboard for the onboarding process to access the data easily and monitor it over time. Measuring and tracking the changes to your onboarding process will increase the likelihood that users will reach the end of the journey because you’ll have a better understanding of their frustrations and expectations.
By taking a look at each onboarding screen in heatmaps, under Screens in UXCam, you’ll be able to measure:
First and last touches
By filtering heatmaps for frustration indicators like rage taps and last touches, you’ll be able to see exactly where and what users are struggling with during the onboarding process.


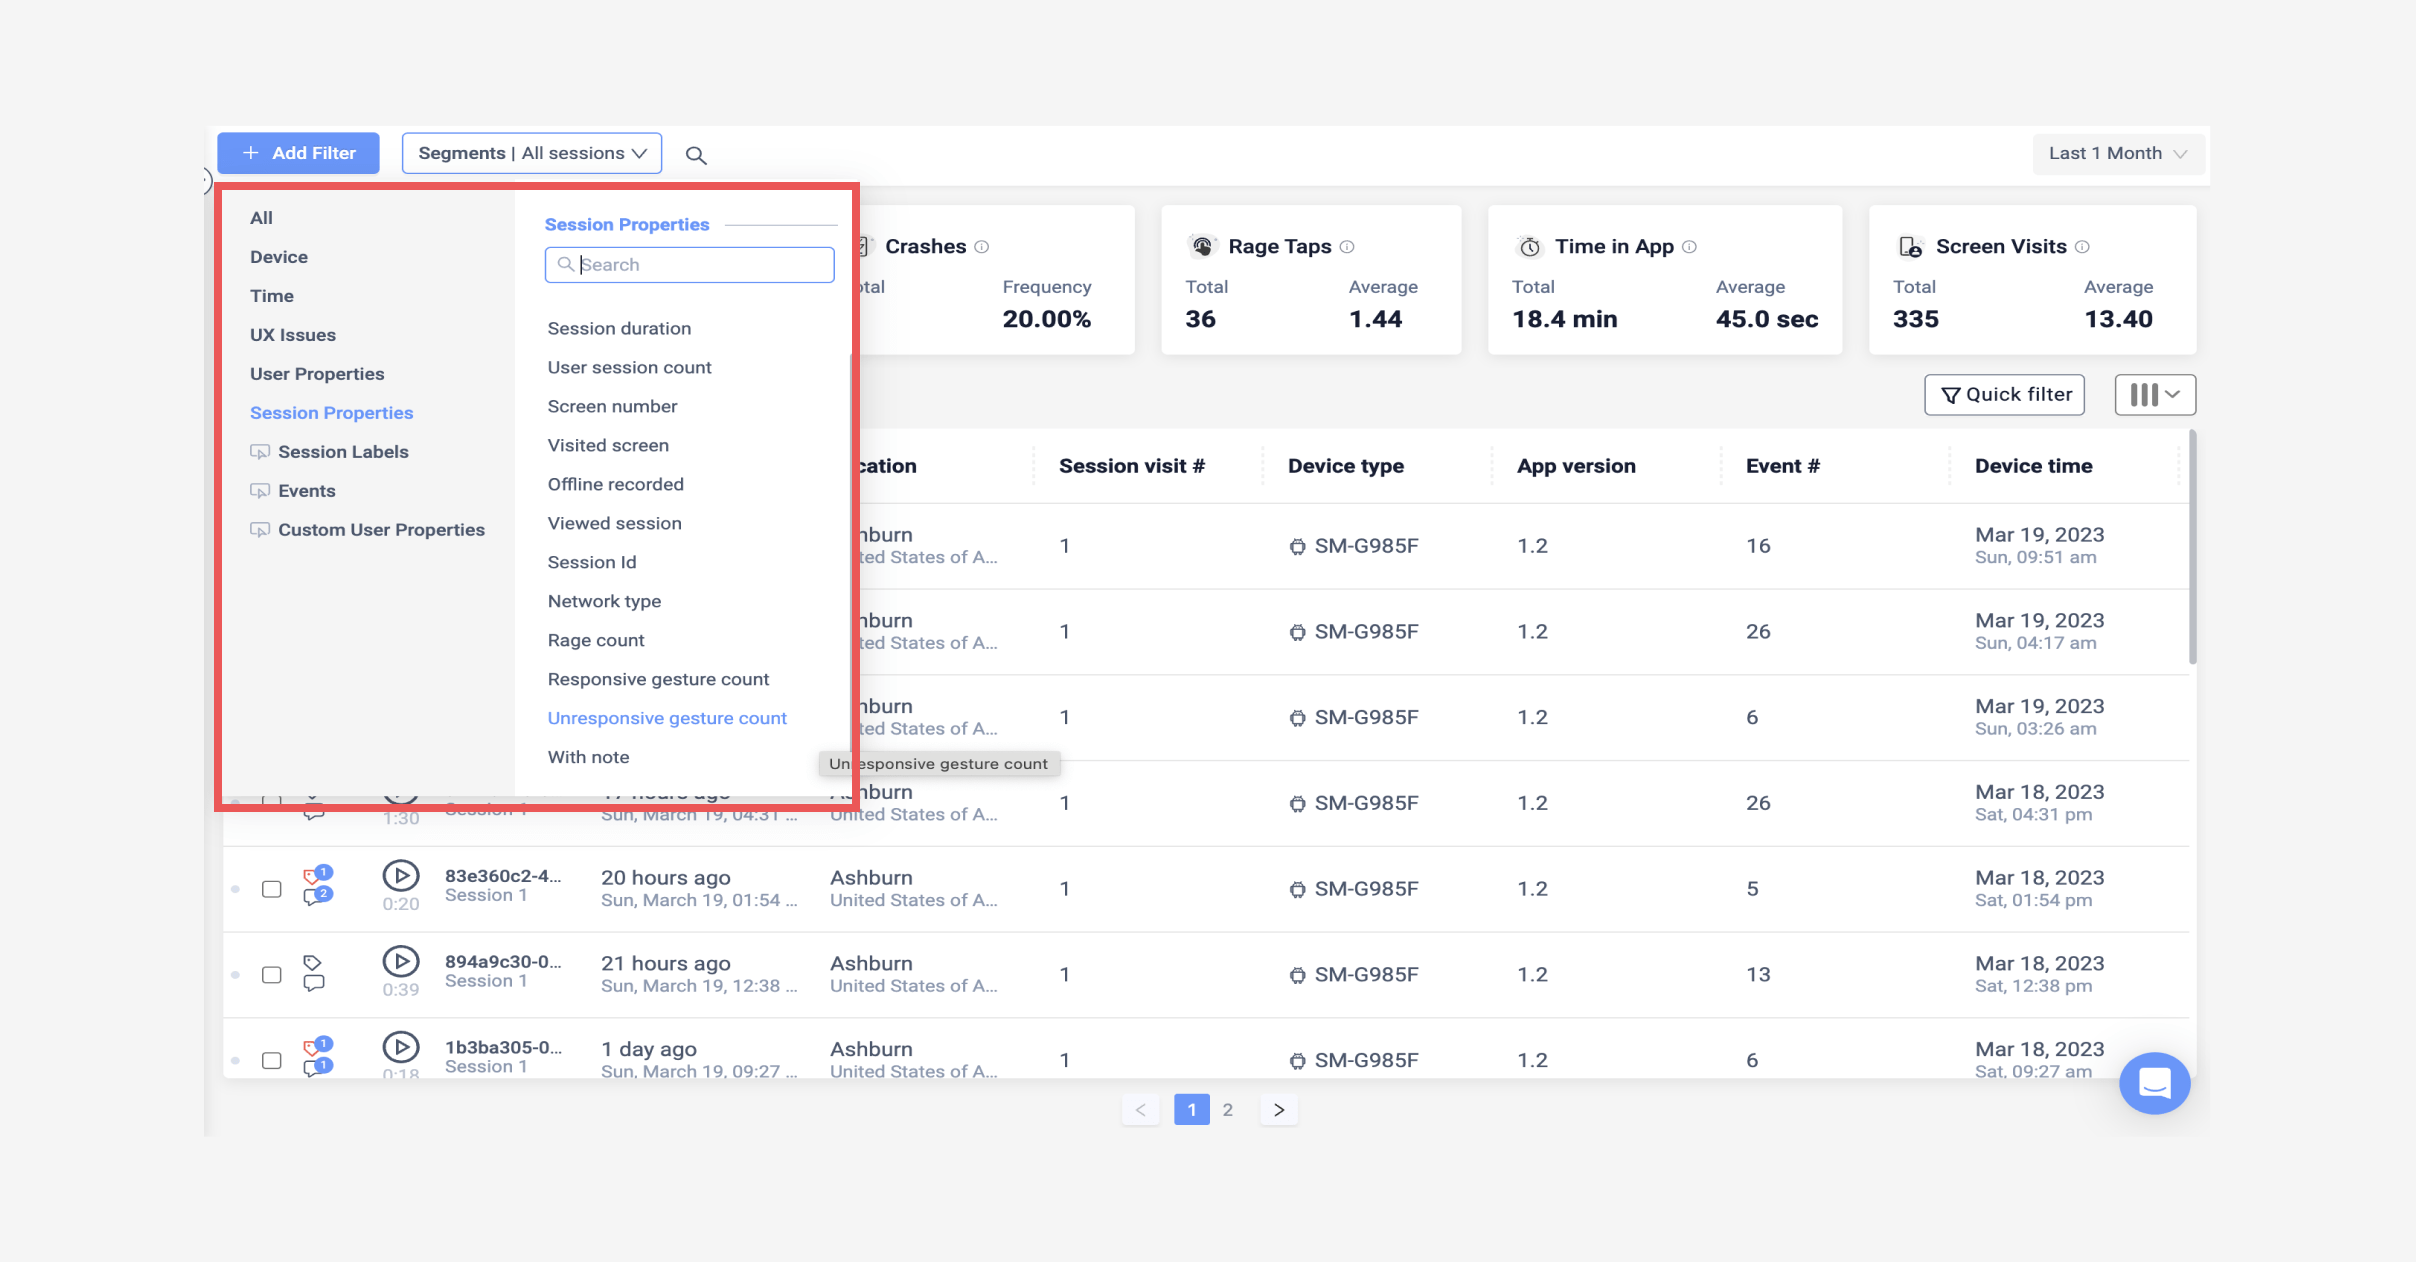
Example of session filters in UXCam
Some issues throughout your onboarding process that you can uncover with heatmaps are:
Identify user frustrations in the onboarding UI
Which screens in your onboarding process have the highest quit rate


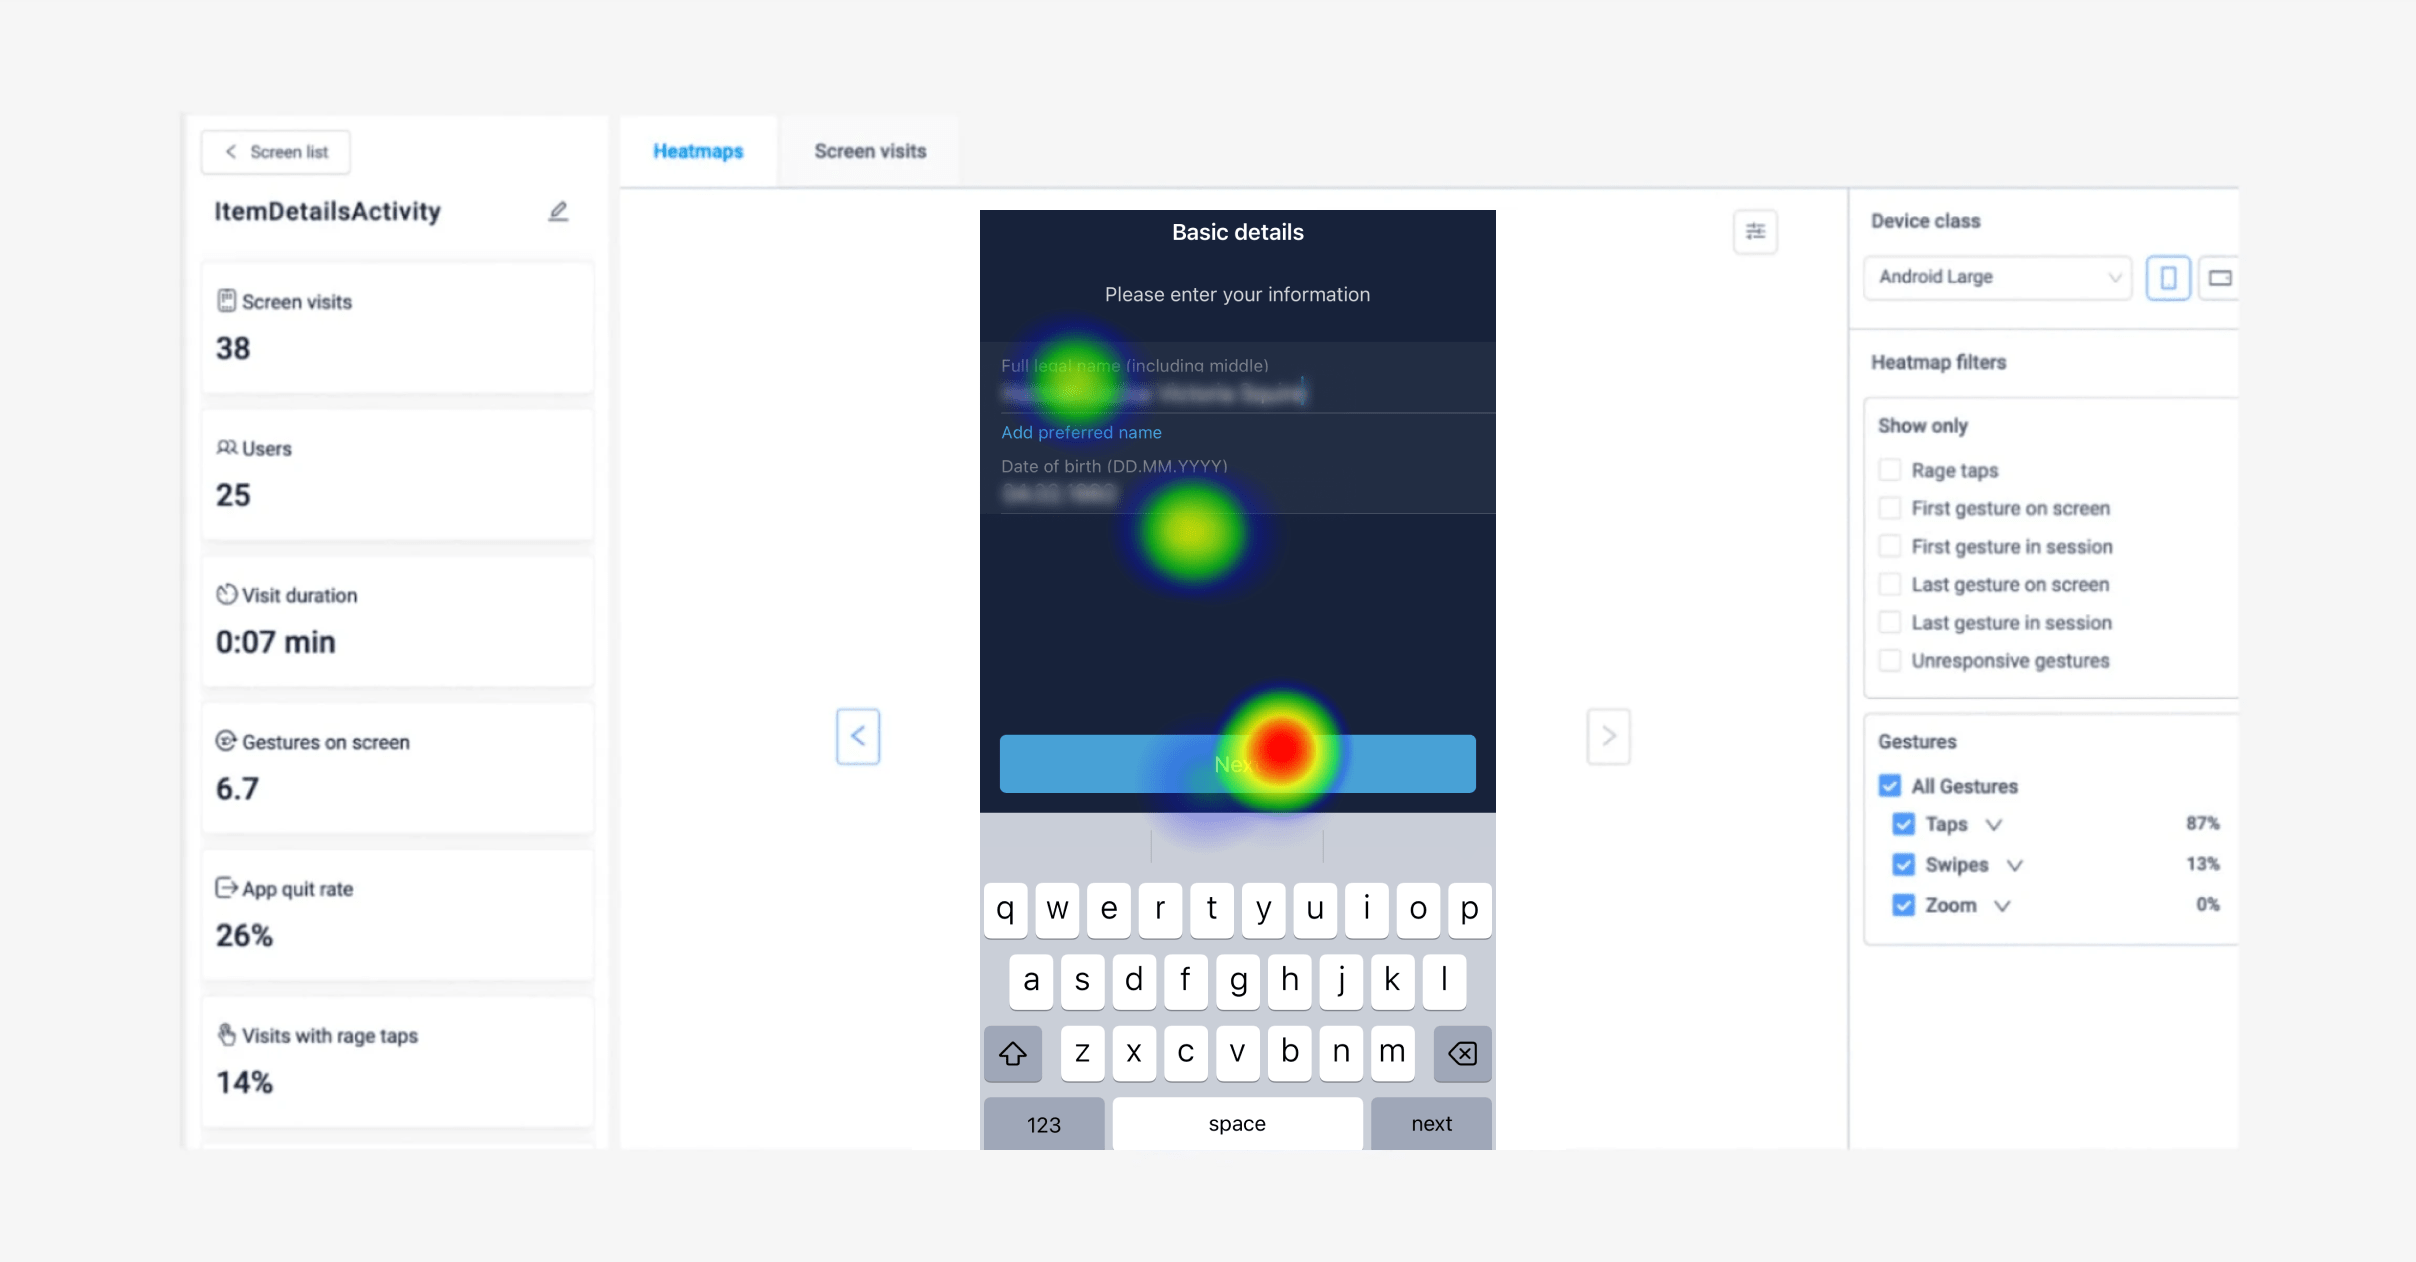
Example of heatmaps in UXCam
You can save user segments with specific actions like the ones above. This will allow you a look into the habits of your users over time, from which you can take the right steps to improve your onboarding experience in a user-focused way.
For a more in-depth look at improving the onboarding process for fintech apps, read: 12 KPIs to measure and improve your FinTech app onboarding strategy
To keep track of these metrics over time, create a customizable dashboard and create reports based on your new features to see how the data changes with every iteration.
UXCam is a tool that can help fintech apps implement these strategies and improve their feature adoption rates. By providing detailed insights into user behavior, product teams can better understand how users interact with new features, identify pain points, and optimize the user experience.
UXCam offers features like:
You might also be interested in these;
How To Measure Product Adoption (Metrics & Tools)
5 Most Important User Adoption Metrics to Track and Measure
12 KPIs to measure your fintech apps onboarding strategy
Reduce KYC abandonment in 3 steps
How to scale user research without breaking the bank
AUTHOR
Hannah Squire
Product Analytics Expert
Hannah is working at UXCam. For the past few years, she’s been working on creating more valuable and useful content for SaaS companies and their users.


Related articles


Product best practices
12 Apps with Great User Onboarding (2026 Examples)
The 12 mobile app onboarding flows I'd study if I were designing one today, with specific callouts for what each does well, common mistakes, and the...


Silvanus Alt, PhD
Founder & CEO | UXCam


Product best practices
Why creating a data-driven culture has less to do with data than you think
Kishan Gupta, CEO, shares 5 tips and techniques for fostering a data-driven culture based on his own experiences building and leading...


Kishan Gupta
Co-Founder of UXCam


Product best practices
Finance apps have a customer support problem, here's how to fix it
Learn about the customer support problem in finance apps and practical solutions to fix it in our latest blog post, and improve user satisfaction and...


Jane Leung
Product Analytics Expert