5 Most Important User Adoption Metrics to Track and Measure
PUBLISHED
29 December, 2024

Growth Marketing Manager
User adoption is a key driver of success for any product.
If you can’t get users to see the value in your product and stick around, you’ll eventually exhaust your pool of potential customers. That’s why it’s important to not only track user adoption metrics, but also analyze them to make data-driven improvements to your product.
At UXCam, we understand the importance of user adoption and have helped thousands of businesses, like Housing.com and PlaceMakers, improve their adoption rates. In this guide, we’ll introduce you to five key user adoption metrics and explain how to track them.
What are the top user adoption metrics to measure?
Daily and monthly active users (DAU/MAU)
Retention rate
Churn rate
Average session length
Time to value
Helpful summary
Overview: This article introduces you to 5 key user adoption metrics and explains how you can track and analyze with UXCam them to improve your product.
Why this matters: Monitoring these metrics is vital for improving user retention and engagement.
Action points: We recommend using UXCam’s suite of tools to effectively track user adoption metrics and make data-driven improvements.
Further research: Check out our guide to user adoption best practices for more actionable advice.
Why listen to us?
At UXCam, we've seen firsthand how critical user adoption metrics are for sustainable app growth.
We’ve helped businesses across all industries improve their user adoption and engagement rates. Our powerful analytics platform allows you to easily track and analyze key metrics, so you can make data-driven decisions for your product.
Let’s get started.
What are user adoption metrics?
Let’s start simpler—what is user adoption?
User adoption is the process of integrating a new product into a user’s daily routine. User adoption metrics measure this process by tracking the extent to which users are actually using and getting value from your product.
An example of a user adoption metric is average session length.
The higher this number, the longer each user spends in your app. Contextualize this data point with others—retention rate, usage frequency, etc.—and you’ll be able to cobble together an accurate, holistic picture of how well users are adopting your product.
Now, let’s talk about key metrics to track.
5 user adoption metrics to track
1. Daily and monthly active users (DAU/MAU)
Active users (either daily or monthly) track the number of unique users who use your app during a given time. By tracking the number of users engaging on a daily or monthly basis—depending on your app’s nature—you can work out whether more users are adopting your product over time.
How to calculate:
DAU = Unique New Users + Unique Returning Users
MAU = Unique New Users in a Month + Unique Returning Users in the Month
2. Retention rate
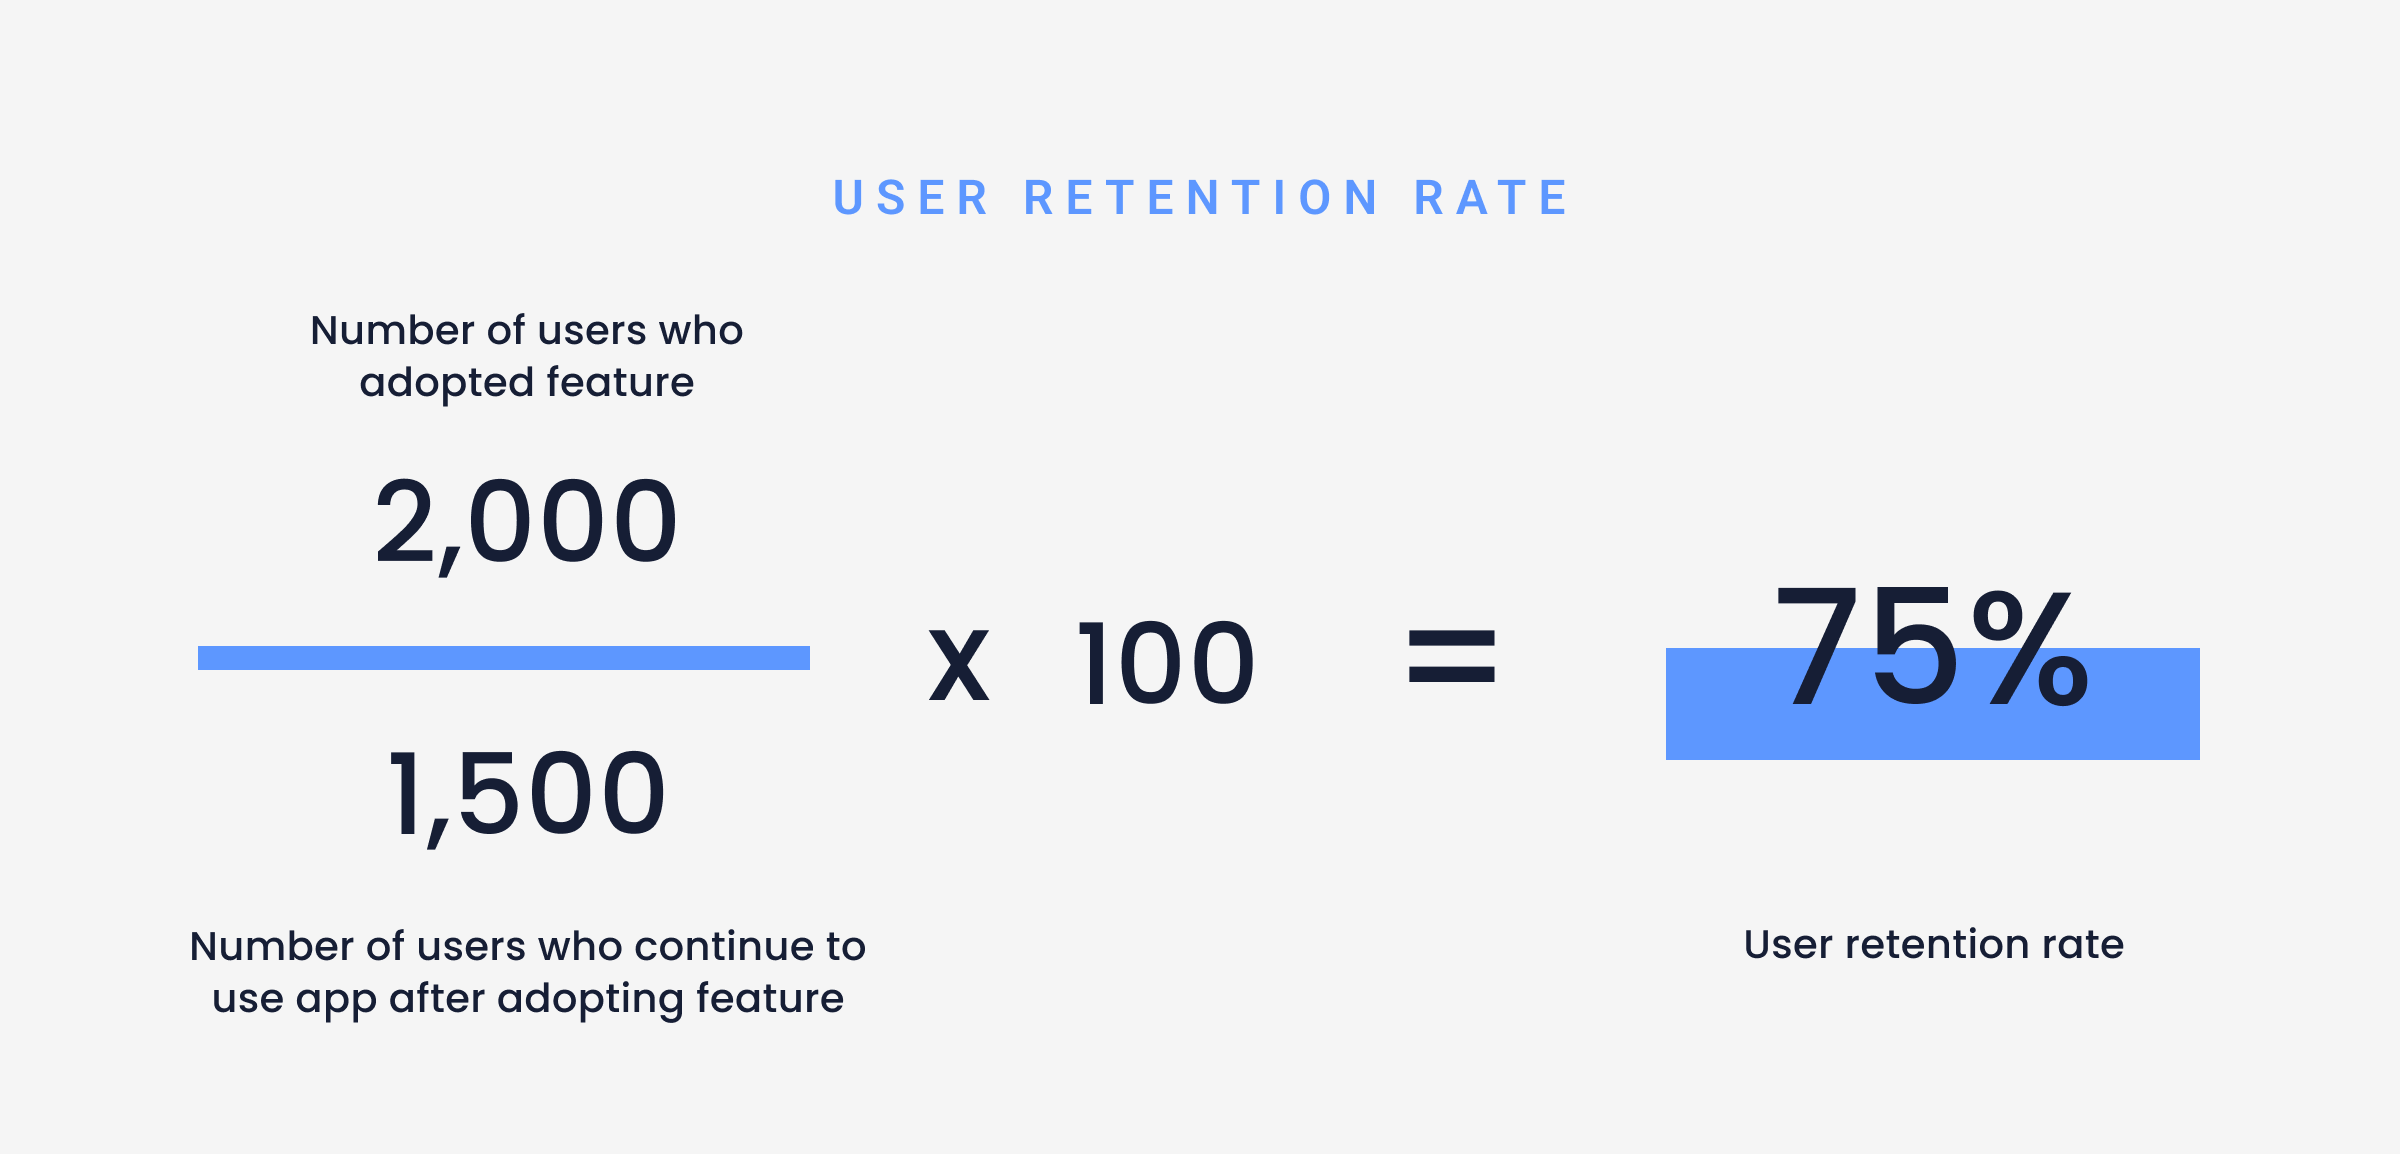
Retention rate is a critical metric that determines the percentage of users who continue to use your app for a given period after their initial download.
Common periods to measure include:
1 day
7 days
30 days
90 days
The higher the retention rate, the more successful your app is at keeping users engaged and coming back for more. A low retention rate may indicate issues with user experience or value proposition.
How to calculate:
Retention Rate = ((Number of users at end of period - Number of new users during period) / Number of users at beginning of period)) x 100%

3. Churn rate
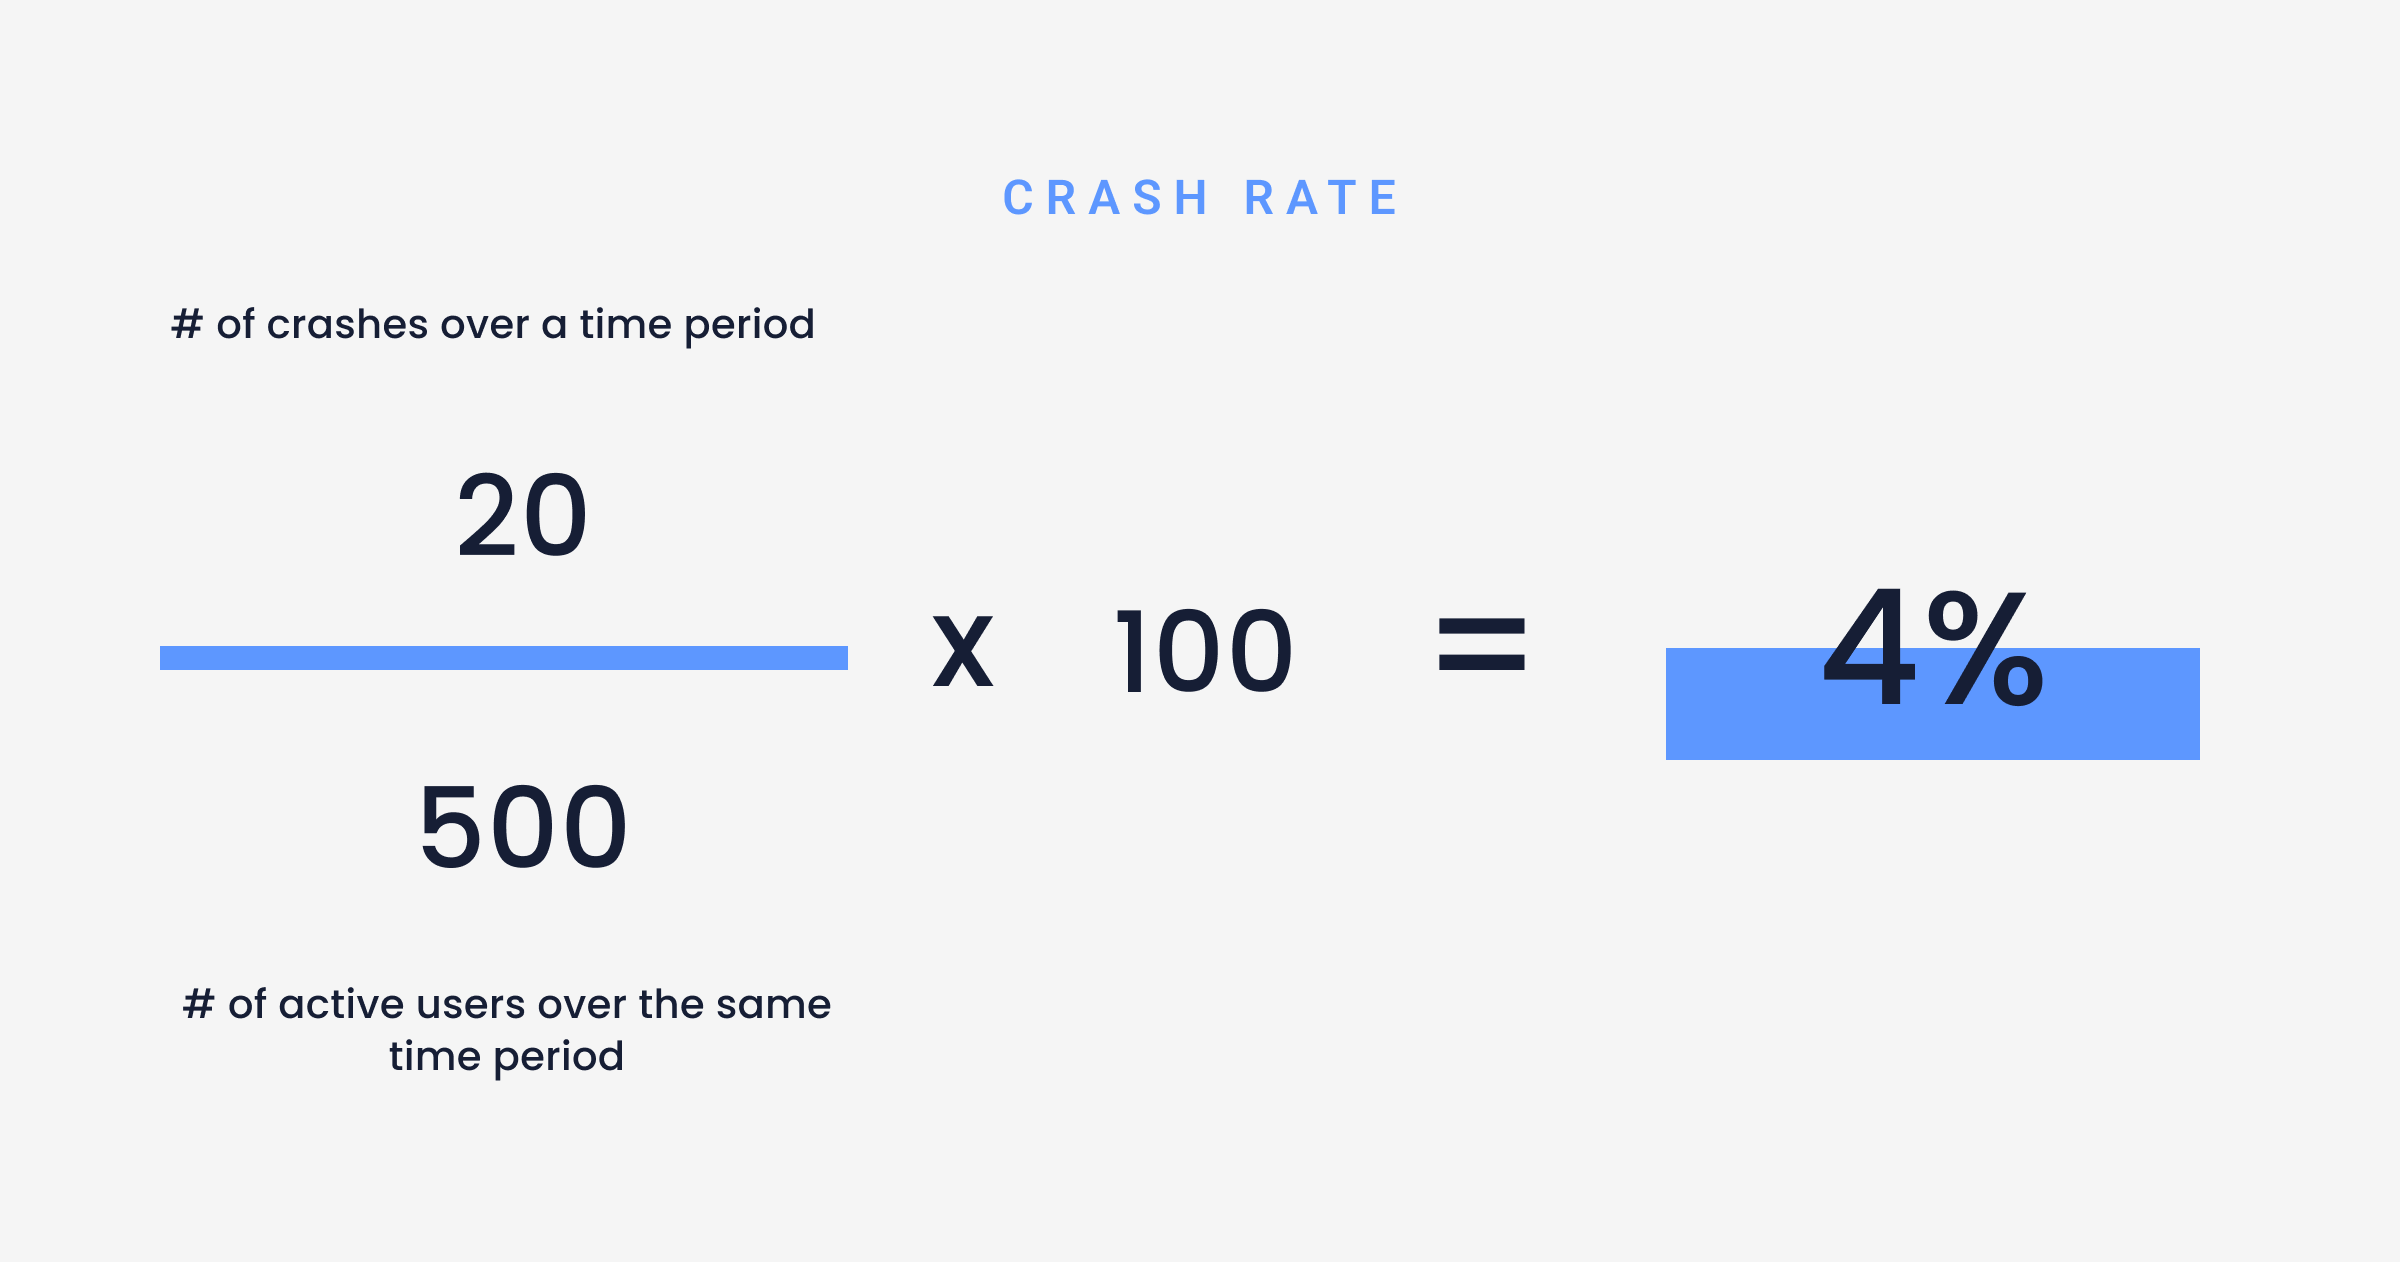
Churn rate on mobile platforms calculates the rate at which users stop using the app. It is essentially the opposite of retention rate. A high churn rate indicates that users are quickly abandoning your app after initial use.
How to calculate:
Churn Rate = (Number of users who stop using the app / Total number of users) x 100%

4. Average session length
Average session length measures the amount of time users spend on your app during each visit. This metric can help indicate how engaged and interested users are in your app's content.
How to calculate:
Average Session Length = Total session duration / Number of sessions
5. Time to value
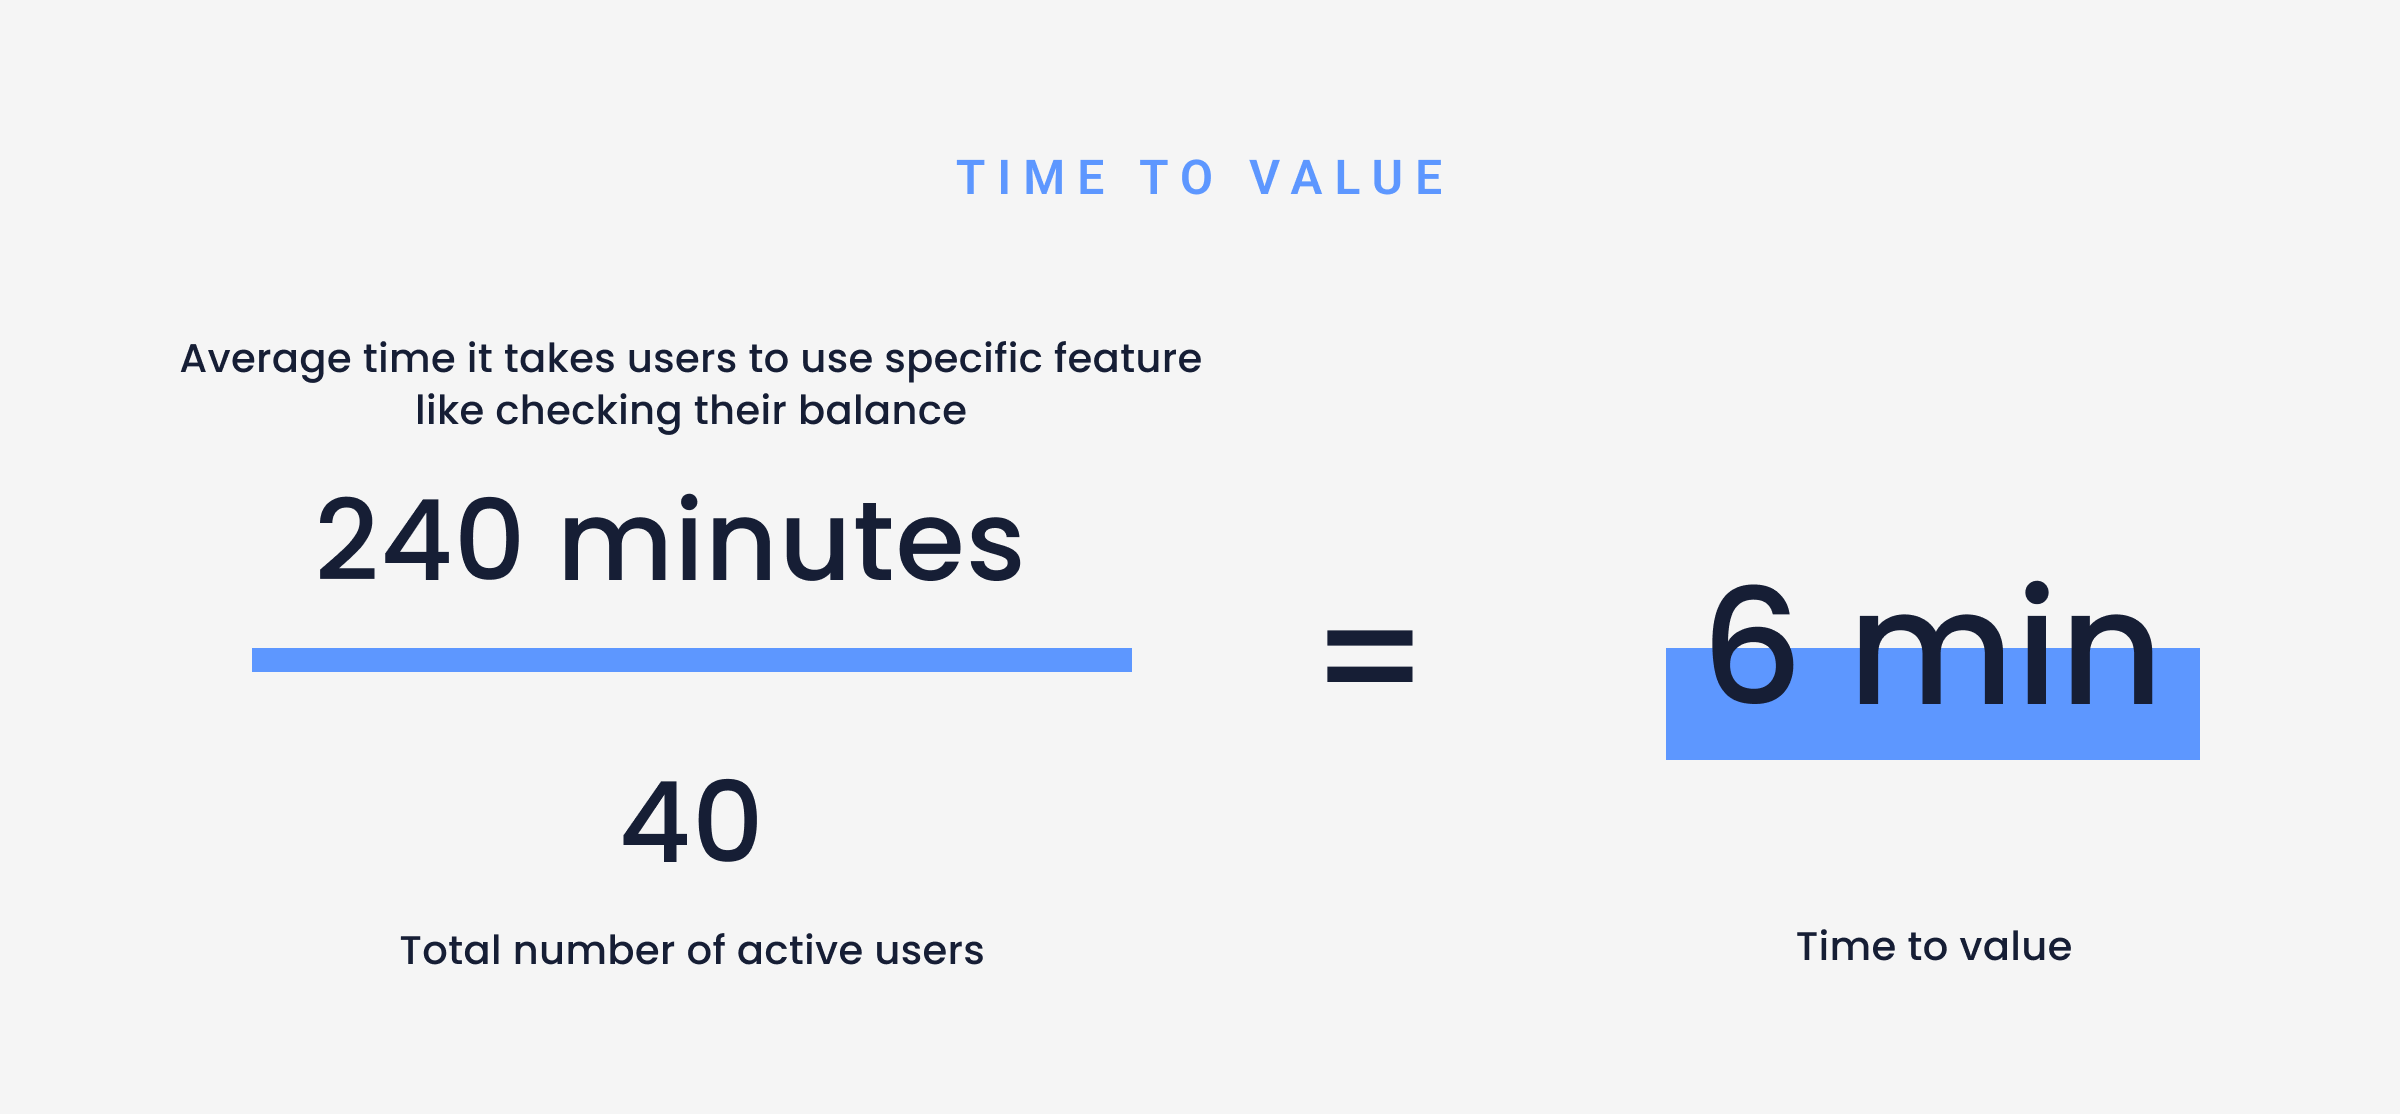
Time to activation measures how long it takes for a user to complete a specific action or task within the app. For example, the time it takes users to use a specific feature like checking their balance in a Fintech app. This metric can help determine if there are any barriers or difficulties that users may be facing when trying to use your app.
How to calculate
Time to value = (Time of first use - Time of installation) / Total number of users active users

User adoption metrics examples tracked UXCam
Daily and monthly active users (DAU/MAU)
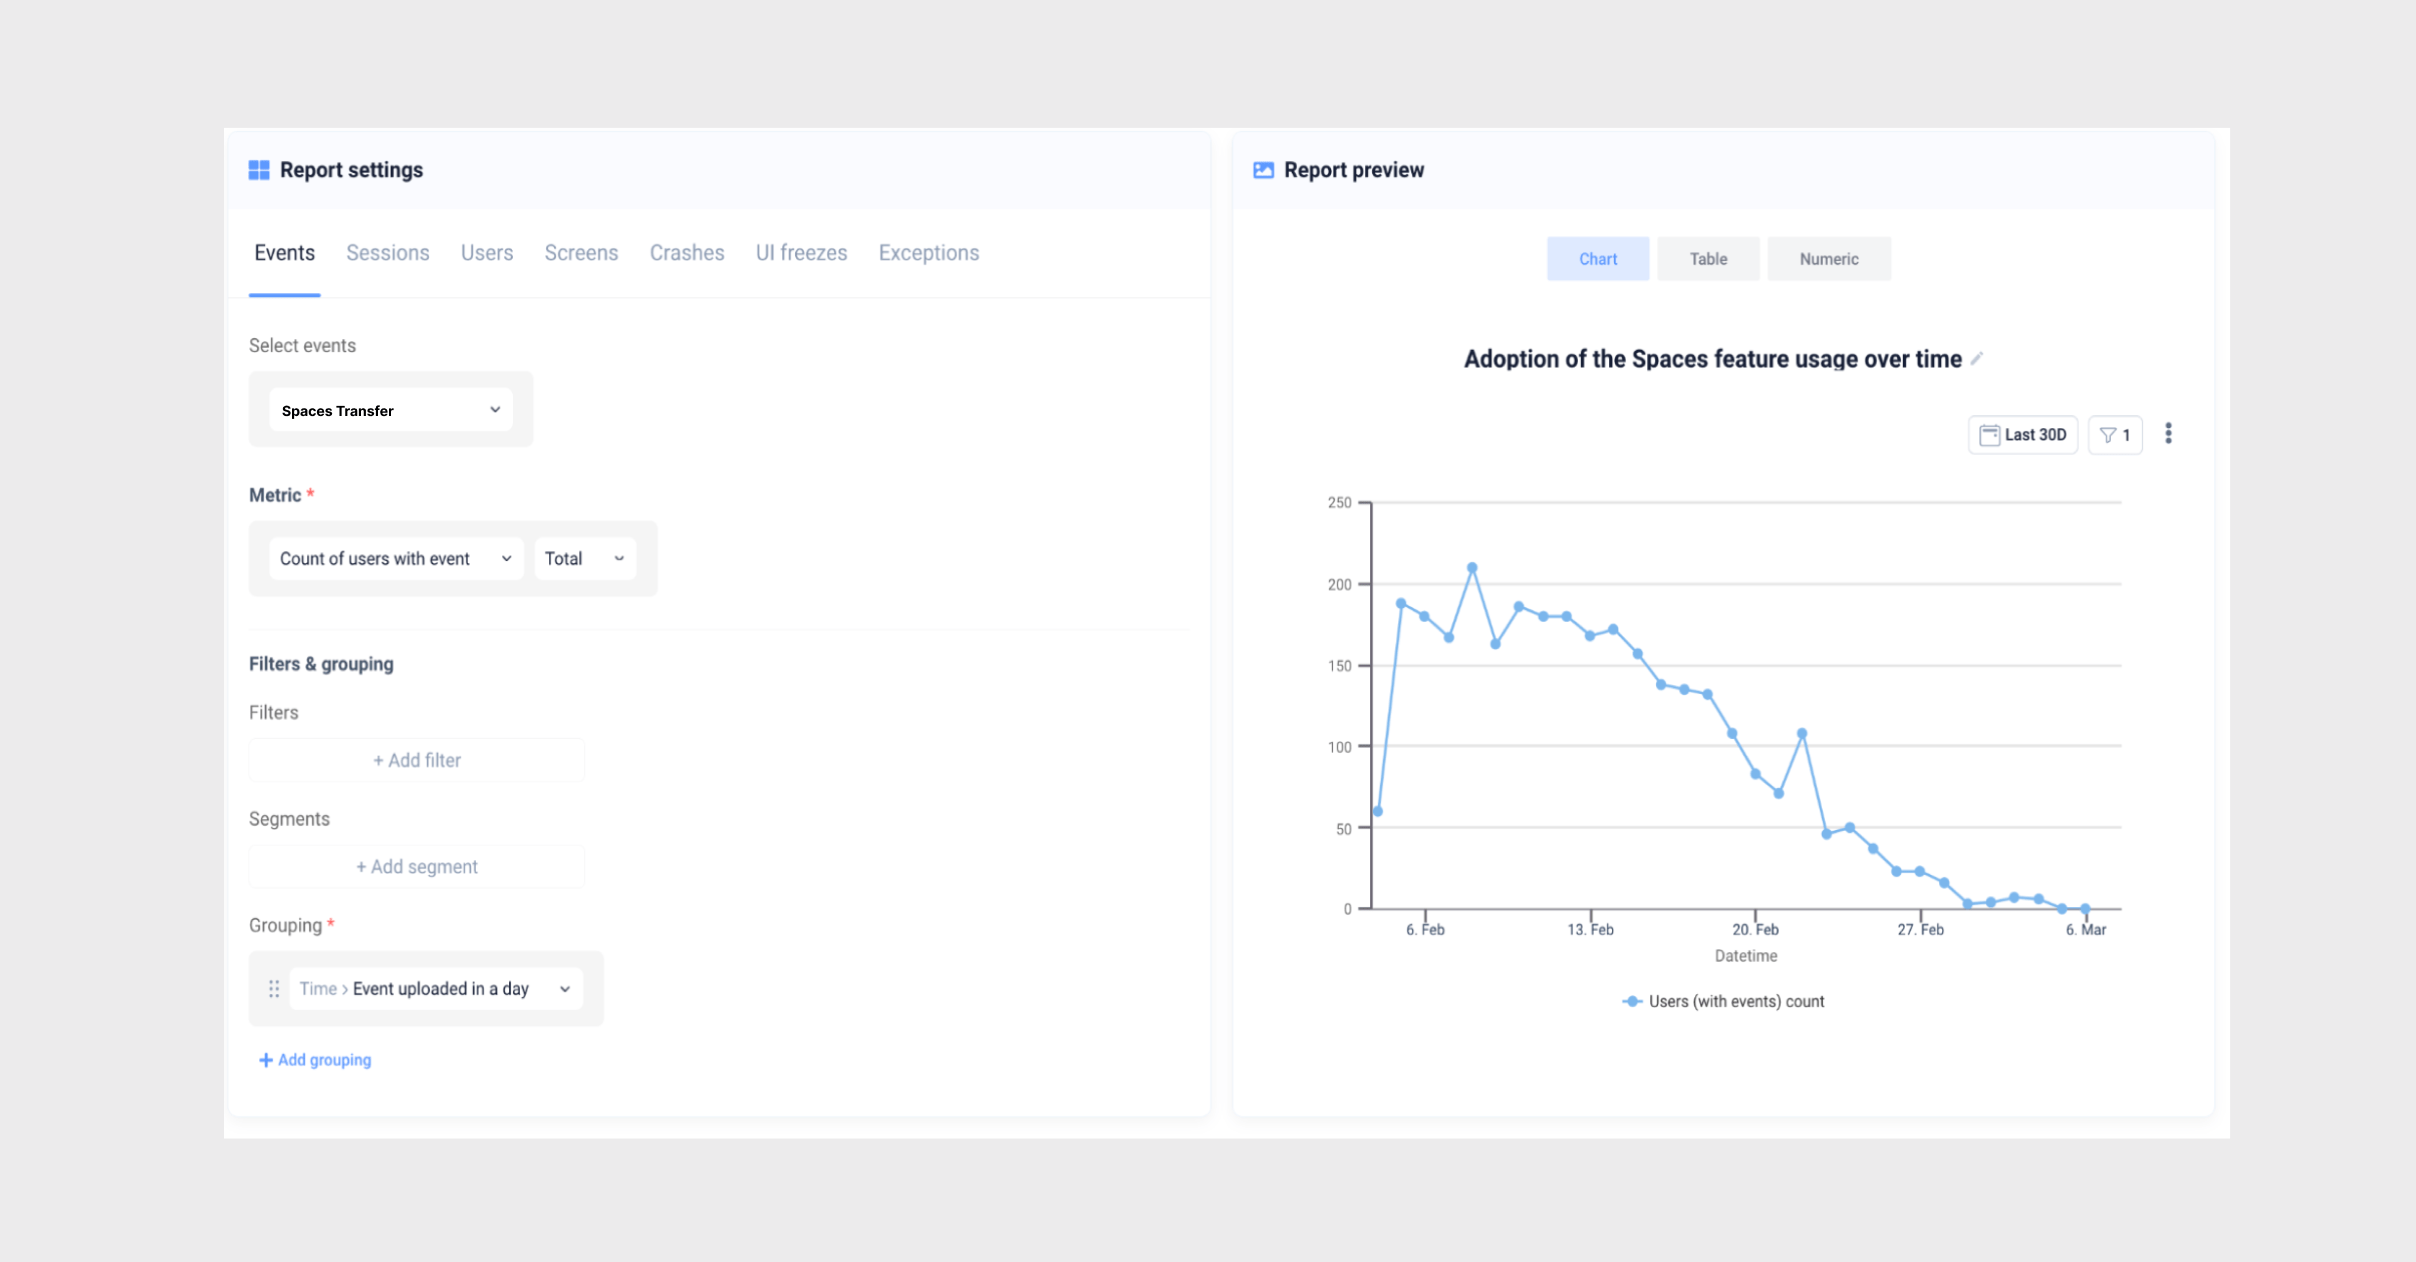
UXCam's daily active users (DAU) and monthly active users (MAU) metrics are calculated by measuring unique app sessions over a given period. You can quickly access these metrics at any time by navigating to the ‘Overview’ tab, or by customizing the parameters and adding them to a dashboard.
These parameters are a great way to get more granular insights—you can analyze DAU and MAU as:
DAU or MAU with [event] (e.g., “DAU who added a payment method”)
DAU or MAU with [app screen] (e.g., “DAU who viewed the home screen”)
DAU or MAU with [custom variable] (e.g., “MAU who are subscribed users”)
You can also add user properties like country or app version to the mix and see how user engagement varies across different segments (e.g., “DAU from the USA who made a purchase”).
Another way to use these metrics to measure and analyze user adoption is by calculating your app’s DAU/MAU ratio (also known as the stickiness metric). This gives you an indication of how many monthly users are returning to the app daily—perfect for keeping a finger on the pulse of user engagement.
Retention
UXCam also offers a dedicated retention analysis suite designed to give you a deeper understanding of how your users are interacting with key features and content within your app.
Using this feature, you can view a real-time retention rate curve that shows the percentage of users who return to your app in each successive week after their first visit. This allows you to identify any drop-offs in engagement and take steps to improve retention.
You can also:
Create segments and cohorts to compare retention rates among different user groups.
Track retention by specific events.
Figure out when and why users stop getting value from your product.
Gauge the stickiness of your product.
Beyond that, UXCam’s other analytics tools can offer additional insights into retention.
For example, you can filter session replays using the segments you create in your retention analysis to watch how different user groups interact with your product. This can help you understand any usage patterns or behaviors that may be affecting retention.
You can also use heatmaps to see which areas of your app are most used and which are being ignored. This information can help you make targeted improvements to improve the overall user experience and potentially increase retention.
Churn rate
UXCam takes a proactive approach to churn rate by helping you find the root causes of user churn so that they can be addressed.
One tool that’s helpful here is funnels.
This feature lets you visualize how users move through your app, and where they may be dropping off. By identifying these drop-off points, you can make changes to improve the user flow and potentially reduce churn.
Session length
UXCam lets product teams track session lengths in real-time to help uncover insights.
This metric can be tracked directly from the �‘Overview’ tab or added to a dashboard. For deeper insights, you can segment your sessions by properties (device type, OS version, etc.) or events (in-app actions or behaviors).
Tracking session length can help you understand how engaged your users are with your app. If you notice a decrease in session length, it may be an indication that something in your app is causing users to lose interest and potentially leading to churn.
Time to activation
Time to activation is a context-dependent metric that. For example, “making a purchase” may be an activation moment for an e-commerce app, but not for a news app where “sharing a story” is more important.
The point is—you need to define what activation means for your app.
Once you have a definition, you can use UXCam’s smart events to set up tracking without writing any code yourself. Define the action or behavior that signifies activation, and UXCam can start tracking it instantly.

To add the “time to” aspect, you can use the “time between events” filter to see how long it takes for a user to perform that activation action.
Conclusion
Effectively tracking and measuring user adoption metrics is paramount for businesses seeking to enhance user experience and optimize their digital products.
With UXCam, product teams can easily track user adoption and find powerful insights in their data. To unlock the full potential of user adoption metrics, sign up for a free trial of UXCam today and take the first step towards refining your digital experiences.
You might also be interested in these;
User Adoption Dashboard Examples And How To Use Them
4 Best user adoption software and tools for product teams
Product adoption dashboard - How to track adoption metrics
5 KPIs to measure your new feature adoption
Stages of the product adoption orocess - An indepth guide
6 Best strategies to boost mobile app adoption
How to analyze session recordings
AUTHOR

Tope Longe
Growth Marketing Manager
Ardent technophile exploring the world of mobile app product management at UXCam.
What’s UXCam?
Related articles
User Onboarding
7 SaaS Onboarding Best Practices to Boost Retention
Boost SaaS retention with 7 proven onboarding strategies. Learn how to personalize, streamline, and guide new users to value faster using real behavior...

Gianluca Ferruggia
Product best practices
How to Increase Mobile App Engagement (10 Key Strategies)
Discover the top strategies for increasing mobile app engagement and user retention. From push notifications to app gamification, our expert tips will help you boost...

Tope Longe
Growth Marketing Manager
User Onboarding
5 Most Important User Adoption Metrics to Track and Measure
Discover the 5 most important User Adoption Metrics to monitor for app success. Track and measure these key indicators to optimize user...

Tope Longe
Growth Marketing Manager