How To Measure Product Adoption (Metrics & Tools)


Looking for how to measure product adoption and the best metrics to track? In the landscape of product management, understanding how well your product is being received is paramount. Product adoption is a key metric that sheds light on this. Measuring product adoption helps you understand how well your users are receiving the product and to what extent they are utilizing its features. It's a lens through which you can view and analyze user behavior and the overall performance of your product.
In measuring product adoption, you'll be navigating through various metrics, analytics tools and methodologies. It's about scrutinizing user behavior, identifying patterns, and gauging the overall user satisfaction. Each interaction a user has with your product is an opportunity to measure and enhance their experience.
Unpacking the term 'product adoption' reveals a spectrum of user engagement levels. It's not merely about the number of downloads or sign-ups; it's about understanding the user experience on a deeper level, and how your product is fitting into the daily routines of its users. Through a blend of quantitative and qualitative analysis, you'll unveil the narrative behind the numbers, making data-driven decisions to propel your product forward.
UXCam's powerful mobile app analytics solution helps mobile brands get their customers to realize value quickly and make them long-term customers.
Today, we delve into the specifics of how to measure product adoption, essential adoption metrics and pointers to develop your product adoption measurement strategy. Let’s get started.
What is product adoption?
Product adoption refers to the process through which users become aware of a product, understand its value, and begin to use it. It encompasses the entire journey from initial awareness to becoming a loyal user.
It is when people realize your product is the best solution for them and start using it for its intended design purpose. Product teams follow a product adoption process to ensure users accept and integrate their products into their lives.
Product adoption depends on the type of prospect; potentially, there will be five types within your customer base:
Innovators
Early adopters
Early majority
Late majority
Laggards
Each group will require specific handling regarding appeal and being convinced.
Innovators are typically the first to try new products and services, as they enjoy exploring new options. However, they can also be the most difficult to retain eventually due to their tendency to switch to new apps and services as soon as they become available. On the other hand, laggards are the group that will only adopt a new product if it's absolutely necessary.
How to measure product adoption
Set goals and define adoption metrics
Use the right analytics tools
Identify user groups and track activity
Develop a framework
Step 1 - Set goals and define adoption metrics
The first step in any analytics endeavor should always be setting goals and matching them with metrics. So, think about what you want to track (your goals) when measuring how successful your product is in convincing customers to adopt it.
Do you want to figure out:
How long people stick with your product?
What features they struggle to learn?
How many new users become active users after your onboarding process?
How usage changes as users become more proficient?
Or is it all of the above?
It’s easier to improve adoption by understanding how your customers use your product over time and why they don’t adopt.
The metrics you decide to track in answering your questions will inform your product adoption KPIs and business objectives—so be clear on what you want to measure before diving into the data.
Step 2 - Use the right tools
To measure and improve product adoption, you’ll need the right tech stack.
For mobile apps, this starts with a mobile app analytics tool like UXCam. Our all-in-one analytics platform features a lightweight SDK, real-time usage data, powerful segmentation capabilities (more on those in a minute), and tagless autocapture for tracking adoption events.


Let’s quickly run through the process of setting up product adoption analytics with a tool like UXCam:
Install the SDK in your mobile app.
Define key in-app events and create custom dashboards to track user behavior.
Collect data from your users’ sessions.
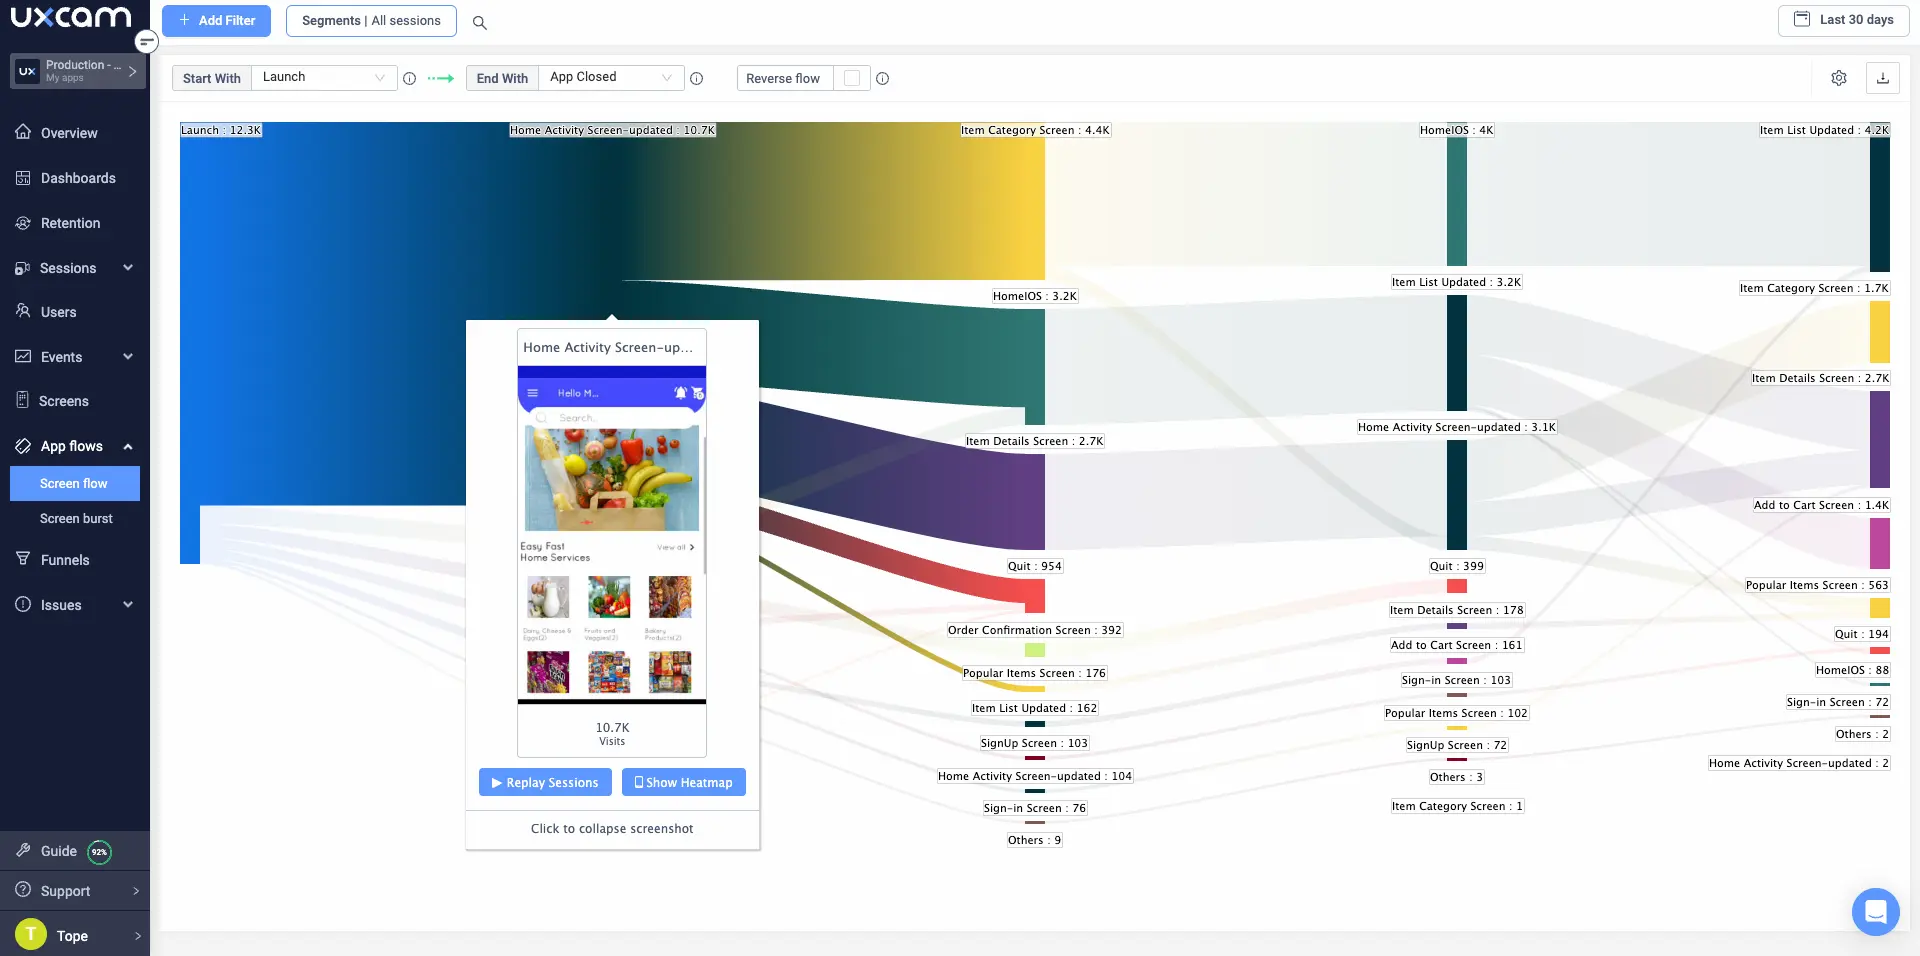
Use user journey mapping to identify friction points.
User session replays and heatmaps to zoom in on root causes.
Analyze data to identify trends and gain insights into user behavior.
Use the insights to optimize product adoption and engagement over time.


This process is simple, but it yields profound insights, not only into what is happening in your app, but also why it’s happening. These “why's” are crucial—they allow you to demystify your product adoption successes and failures so that you can replicate the former and prevent the latter.
With UXCam, you can quickly start gathering adoption analytics from your users to understand their behavior and product usage so that you can make informed decisions about how to optimize your product for adoption.
Step 3 - Identify user groups and track activity
Understand your customers better using UXCam’s customer segmentation functionality.
It highlights patterns for a more in-depth understanding of your metric results and makes it easier to design to satisfy groups of people displaying similar behavior. For example, you can customize flows to accommodate common behavior patterns found among new, returning or loyal, and slipping away user groups.
Monitor user activity to learn how behavior and usage changes over time and customers across different groups become more familiar with your app. Track specific goals or milestones (key activation points) within flows to measure adoption and for complete analysis.
Step 4 - Develop a framework
Design a process to accommodate continuous product adoption tracking because it’s essential to see how product adoption progresses. Consider creating a dashboard to display, analyze, and interpret tracking results and to make it accessible to anyone who needs to see it.
Use the data to inform decisions for new designs and improvements, and create a schedule to stay consistent.
Product adoption example: Costa Coffee
Costa Coffee struggled to get users to adopt their new loyalty program. They turned to UXCam’s behavioral analytics tools to measure adoption and determine what roadblocks and bottlenecks prevented people from signing up for the program.


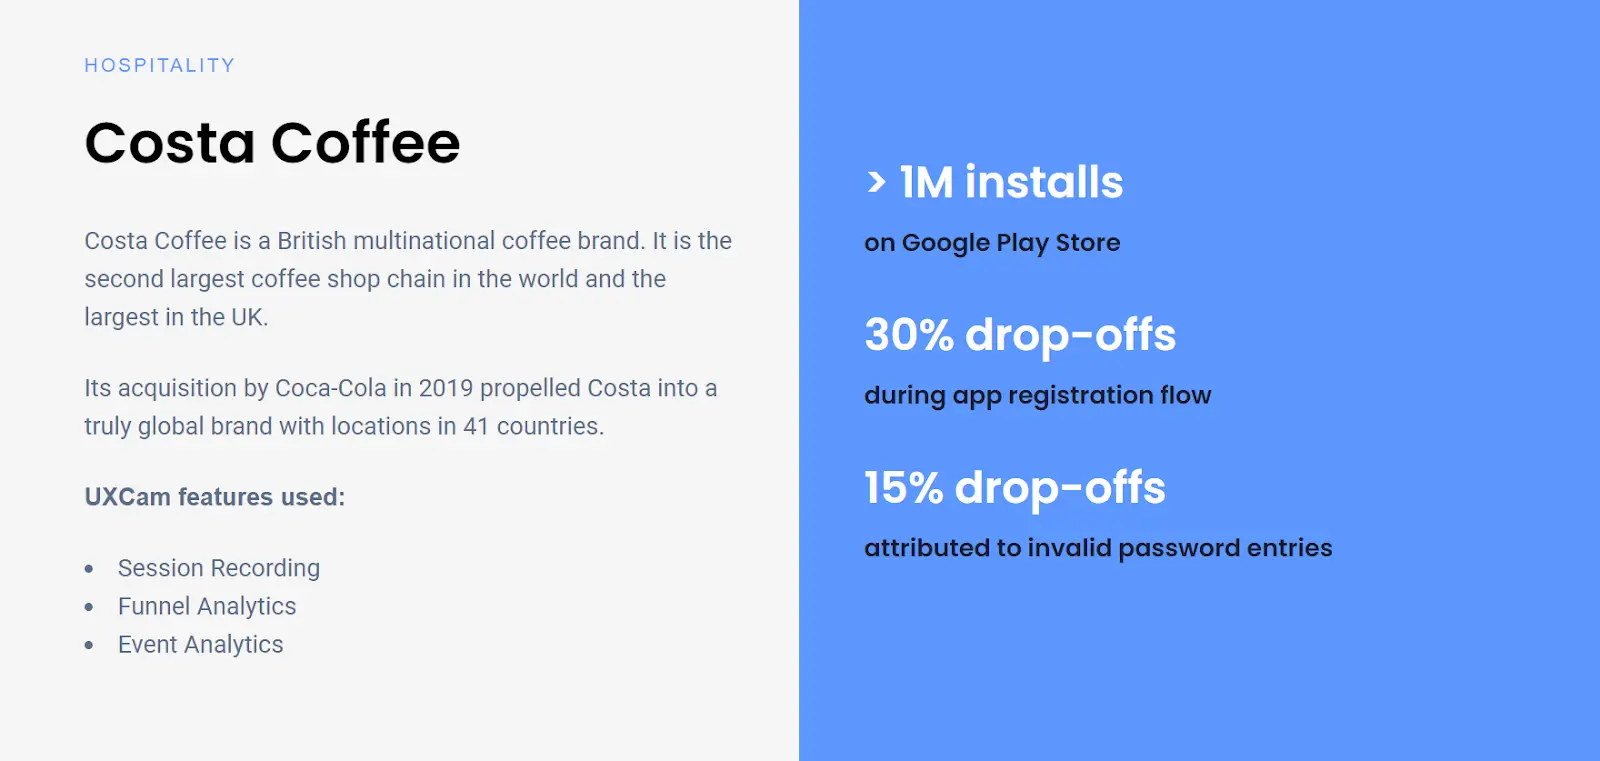
Using UXCam’s funnel analytics and session replays, they discovered frustration signals like rage taps during the onboarding flow. Once the design issues were addressed, adoption increased by 15%, giving Costa Coffee a more profound understanding of their user’s needs and allowing them to increase engagement with their loyalty program.
8 important product adoption metrics to track
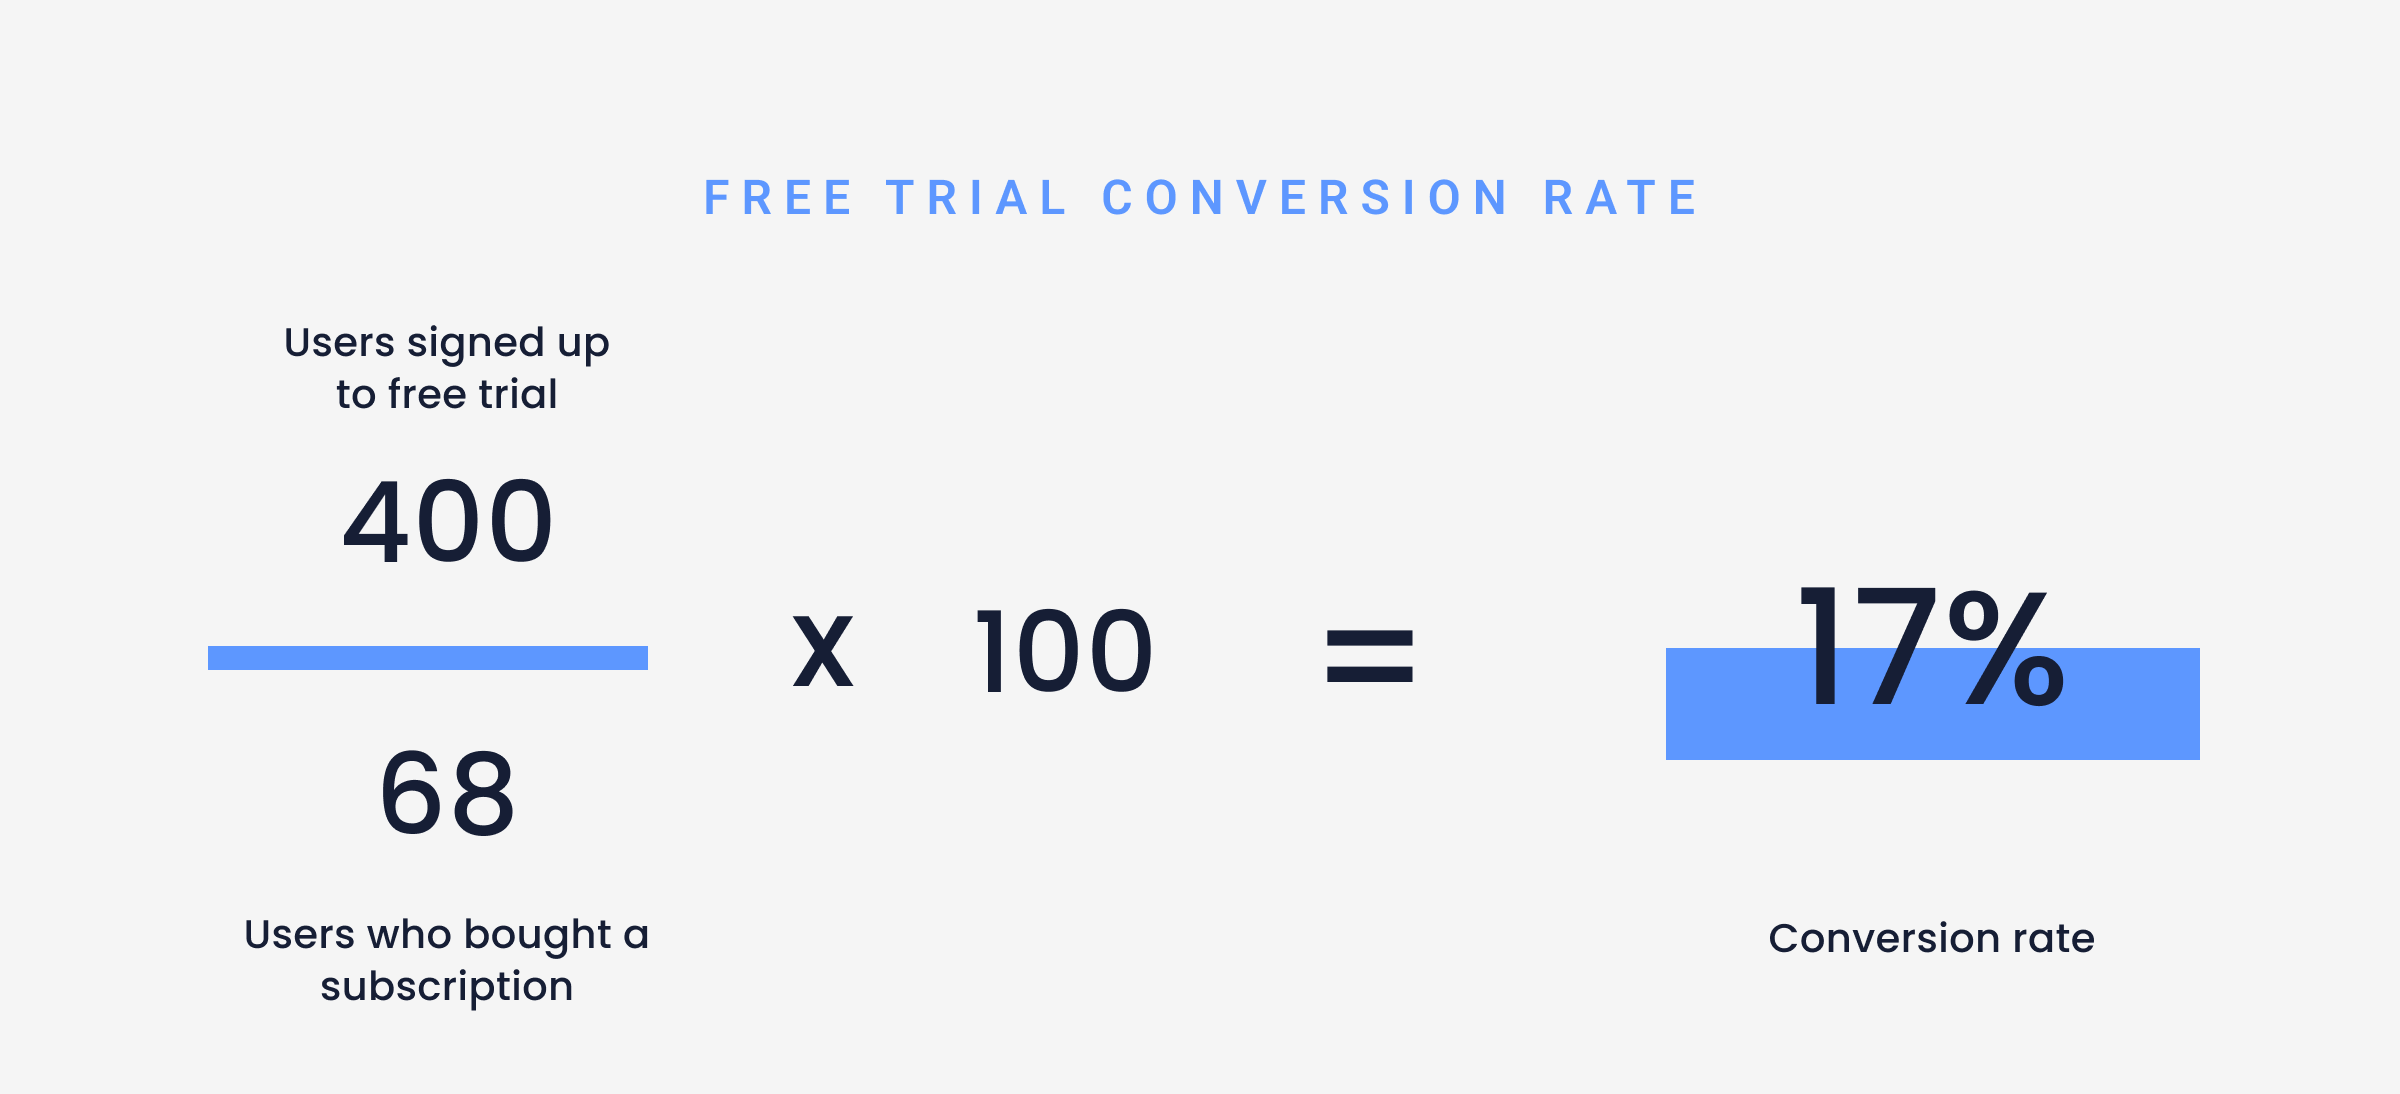
1. Conversion rate
The conversion rate measures how well your product gets users to complete desired actions like signing up for a paid plan, enrolling in a course, or making a purchase. A low conversion rate could indicate design issues that need to be addressed or a funnel that isn’t well optimized.
How to measure conversion rate


How to track free trial conversion rates in UXCam


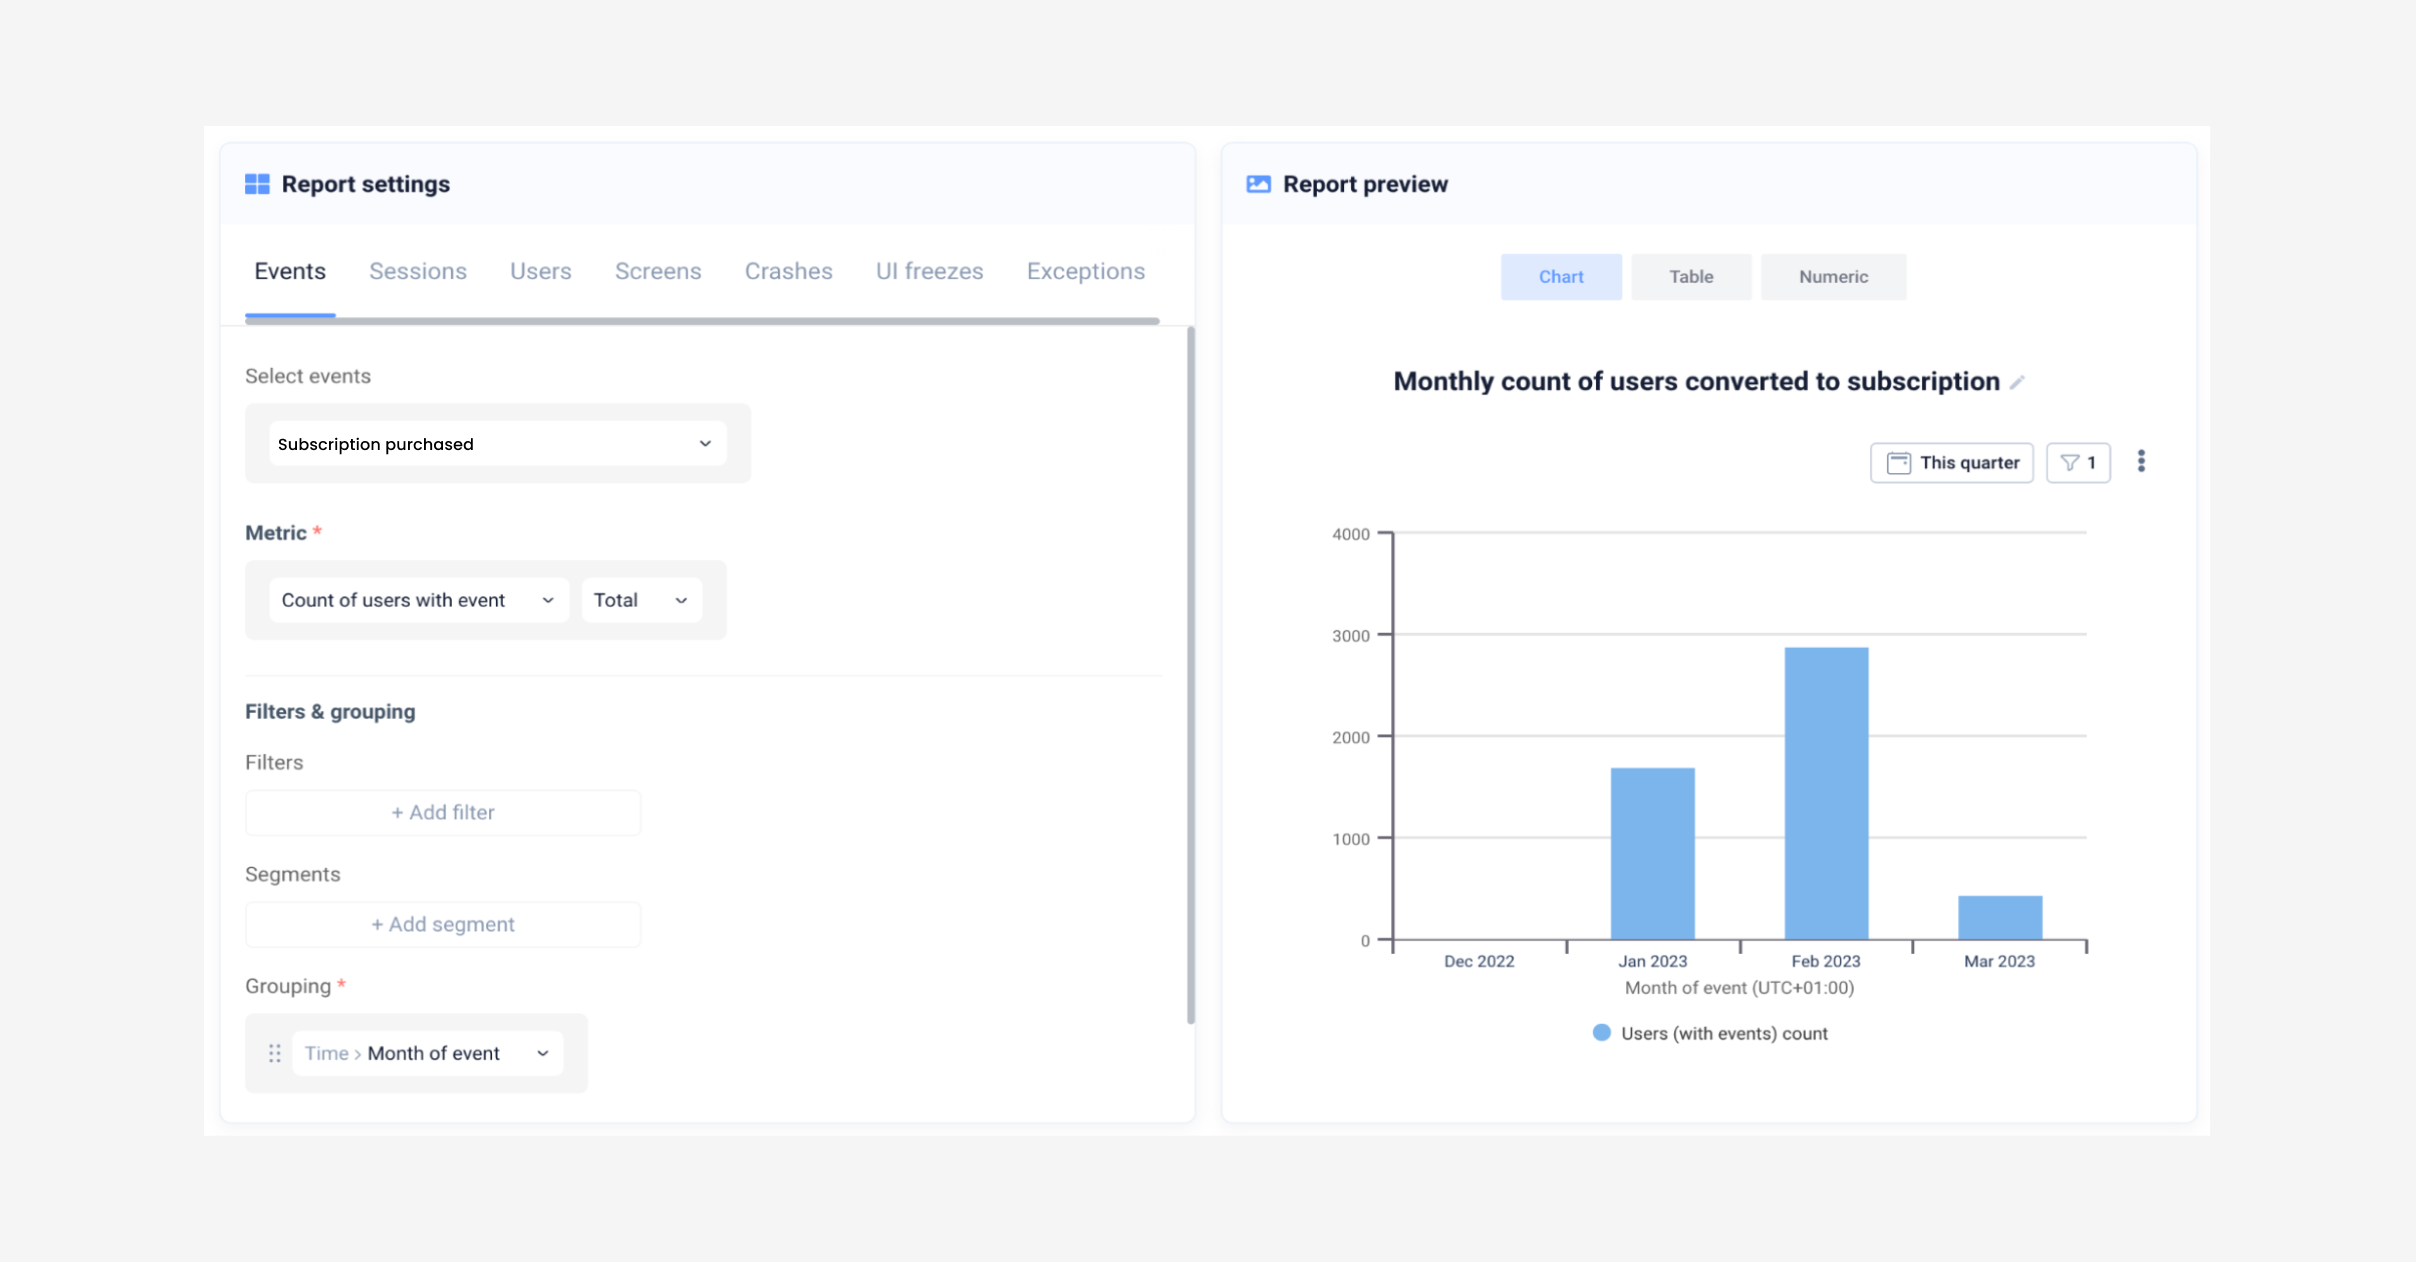
Example of parameters to use to measure free trial conversion rates
Add a report to your dashboards in UXCam to easily keep track of the number of users converting from a free trial to a subscription by using custom events.
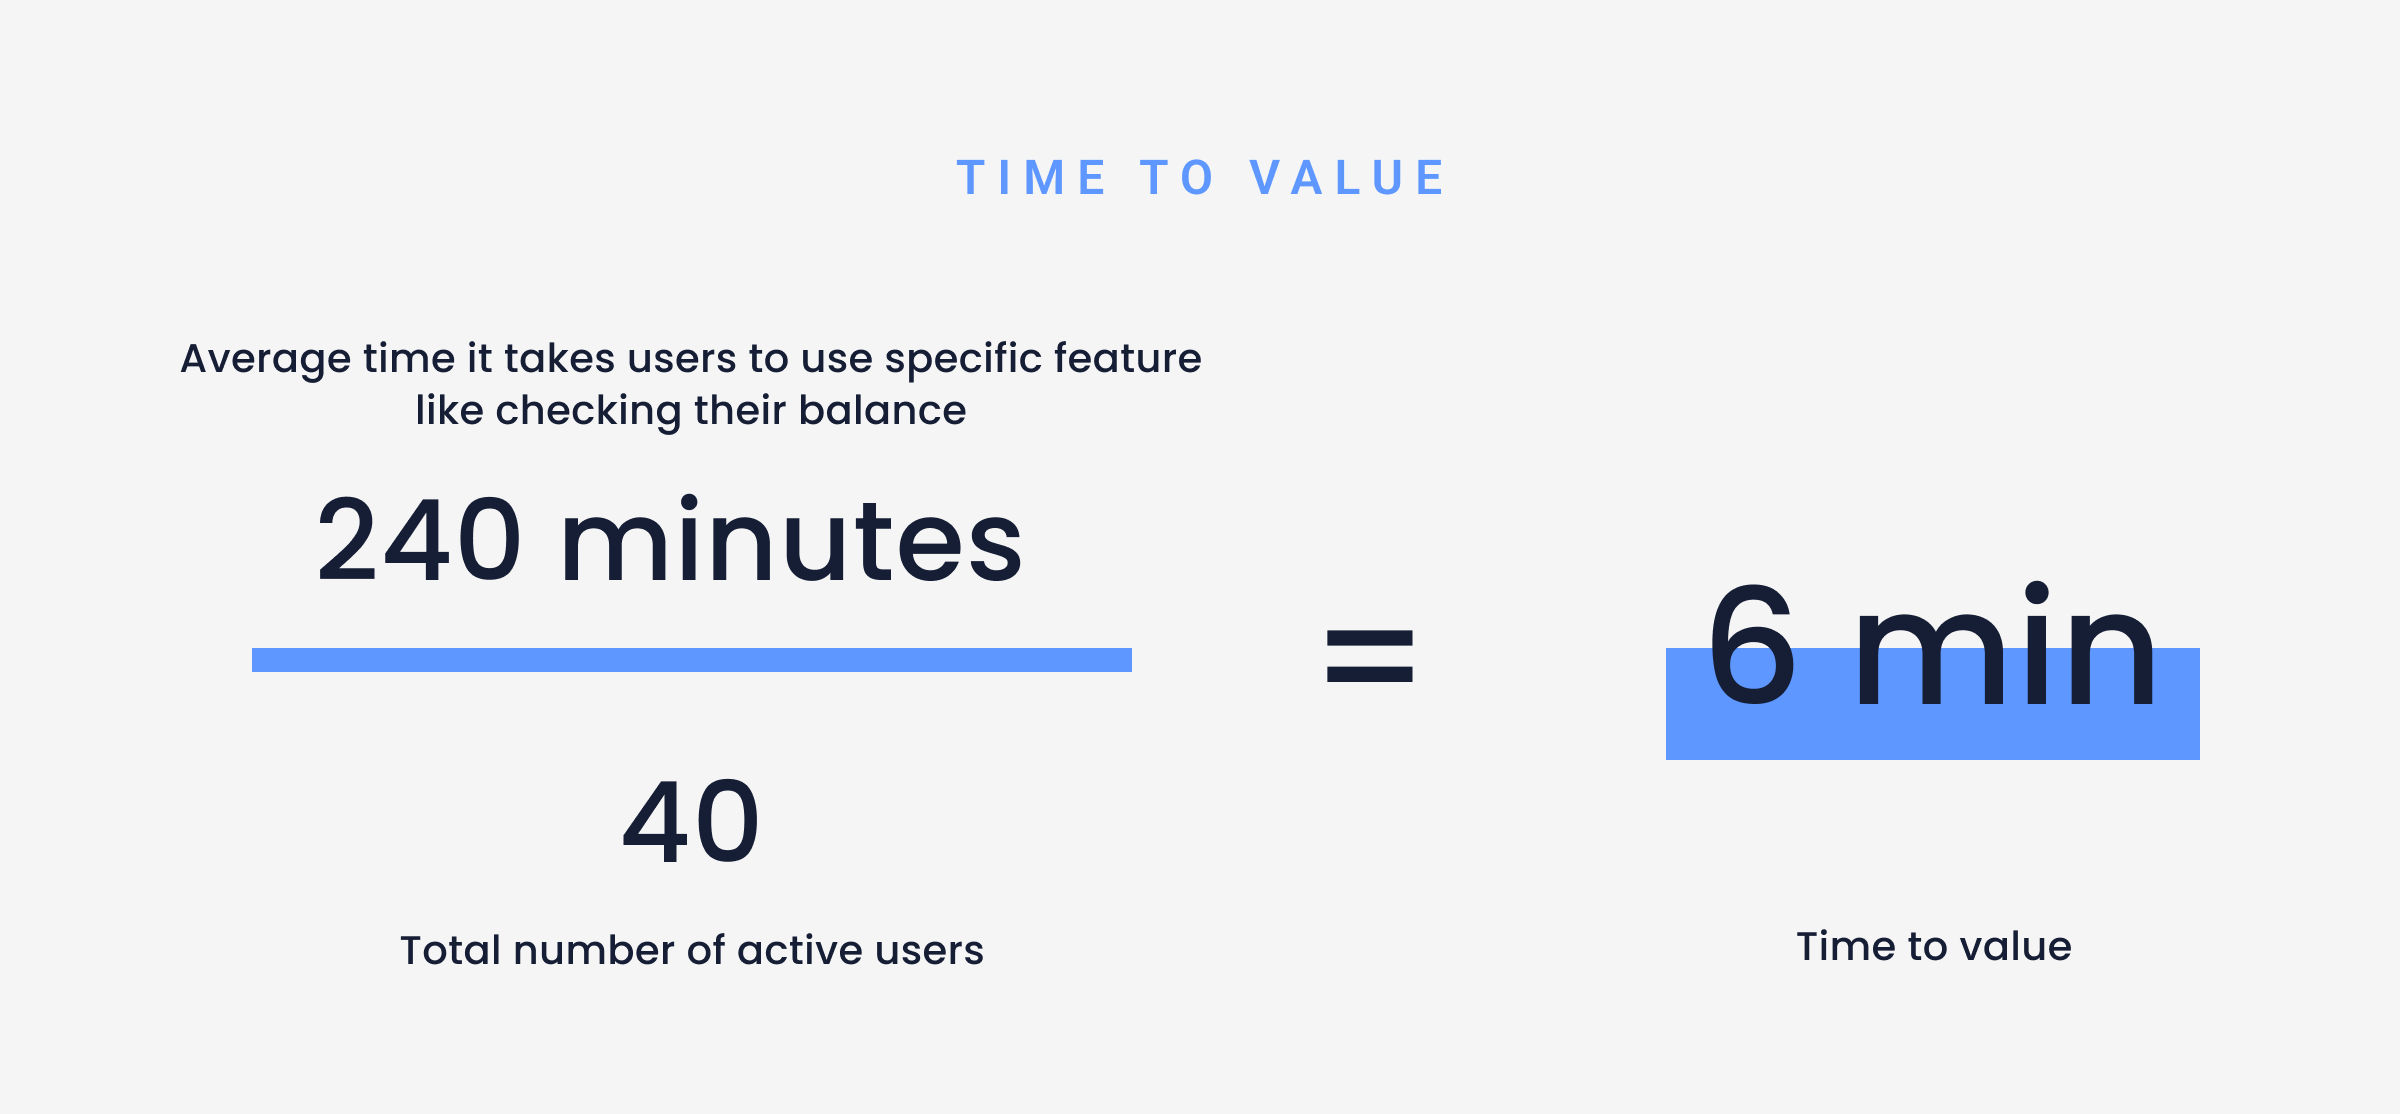
2. Time-to-value (TTV)
This metric tracks the average length of time it takes a user to get “value” from your product (value is in quotes because this is subjective to the business). A lower TTV often indicates better “stickiness” and user engagement, since users are quickly realizing the benefit of using the product.
How to measure time-to-value (TTV)
There is no set formula to measure TTV. The best strategy depends on your product, customer requirements, and business model. Start by defining a value moment for your product or service (e.g., “product purchased”). Then, measure the time customers take to reach that value and average the results.


3. Number of active users
This tells you the number of users who signed in or engaged with your product within a specific period—daily (DAU), weekly (WAU), and monthly (MAU). DAU is a good way to track your app’s “stickiness,” while MAU is better for tracking growth patterns.
How to measure number of active users
Active Users = Number of Users per [Day, Week, Month]/Number of [Days, Weeks, Months] per Measurement Period
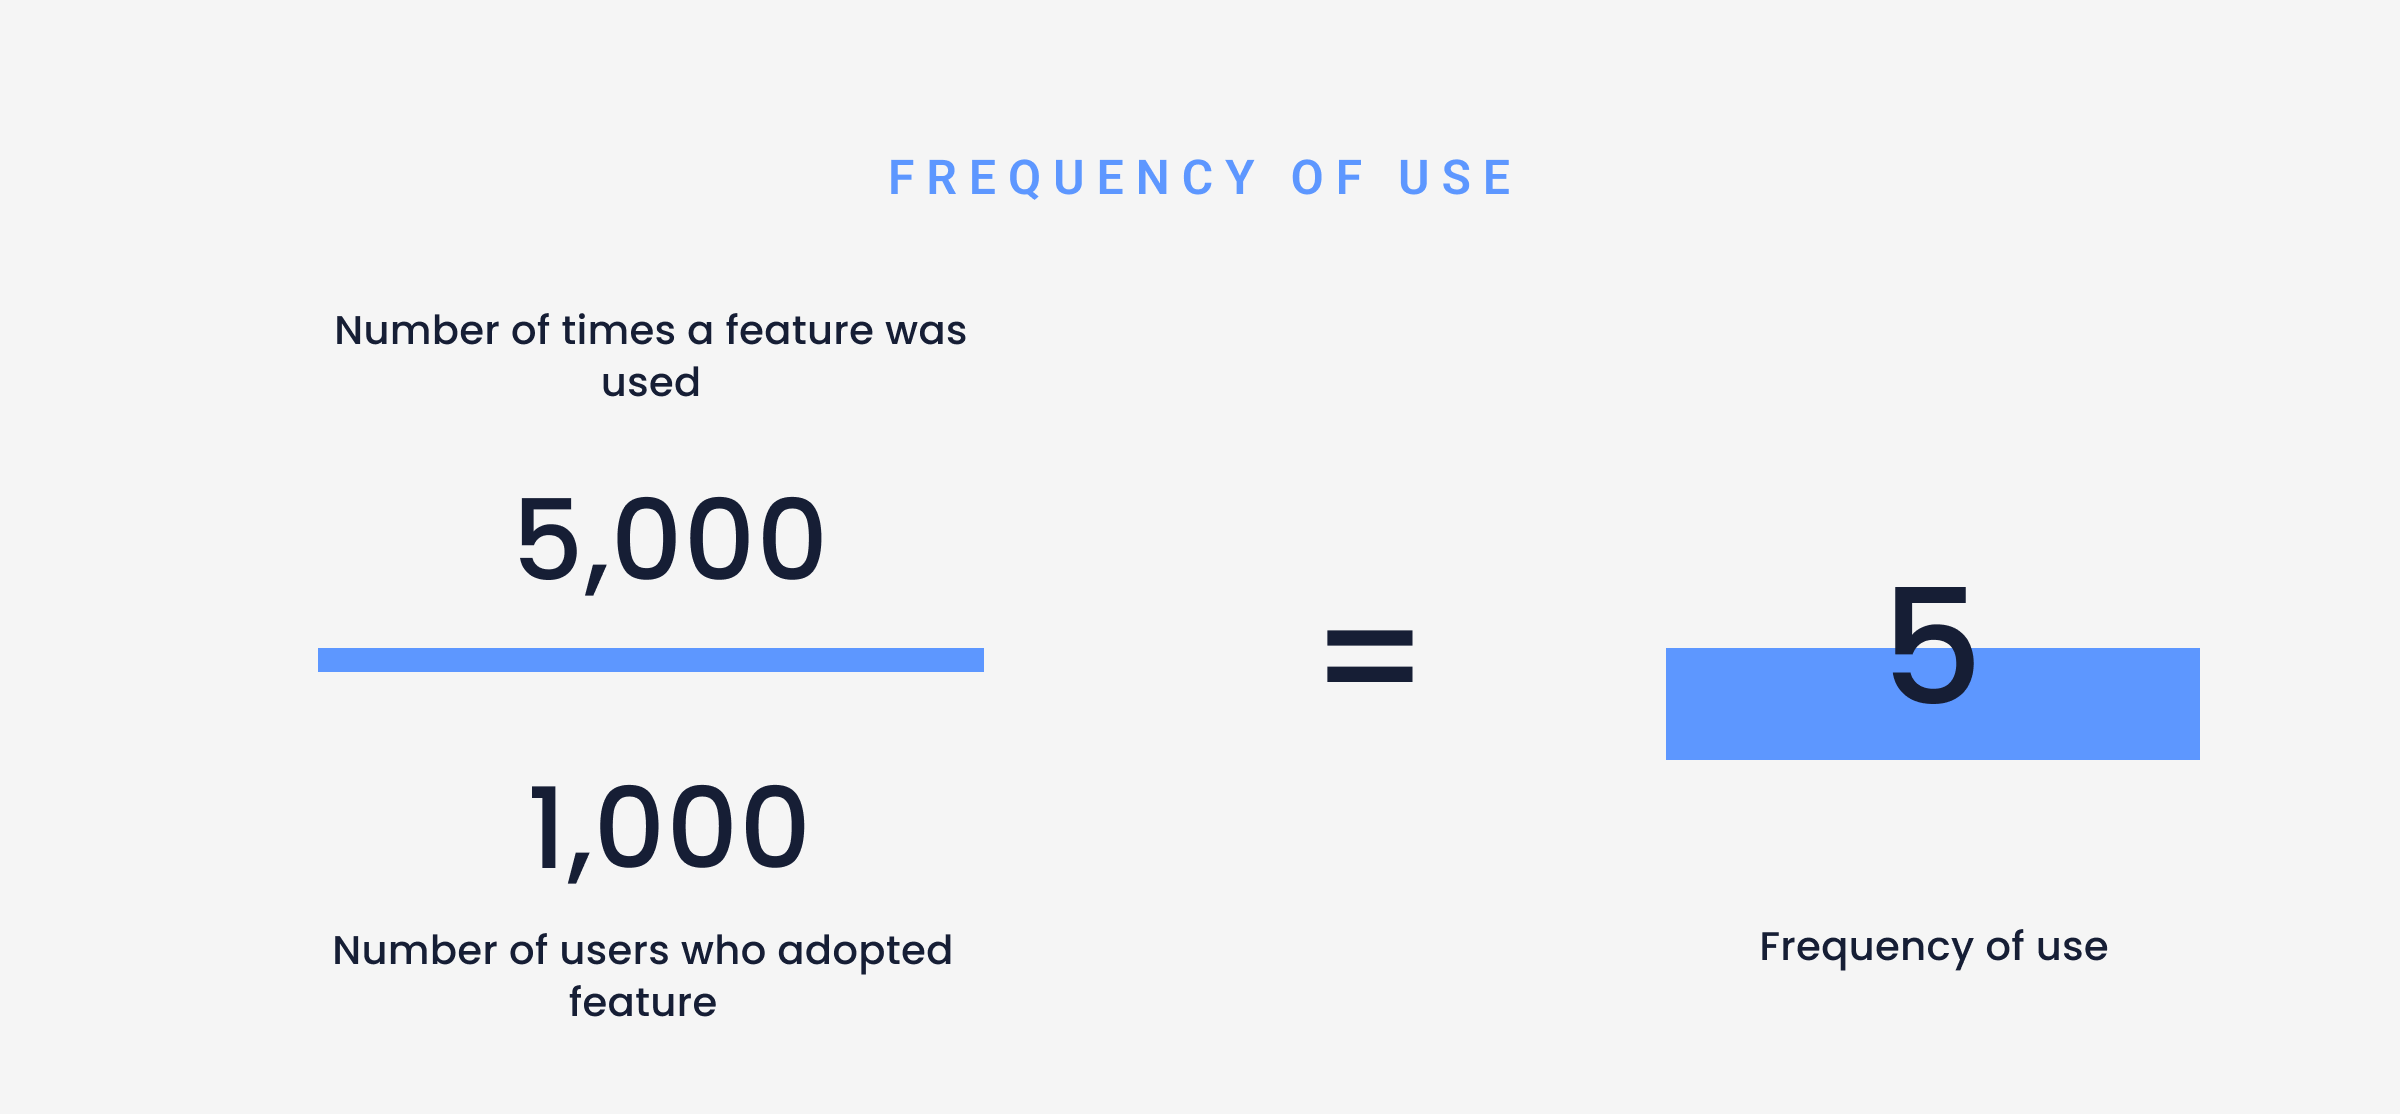
4. Usage frequency
This metric measures how often your users consistently return to use your product after initial onboarding. A high usage frequency is a great sign that users receive value in your app, and the more they return, the more likely they are to see more value.
How to measure usage frequency


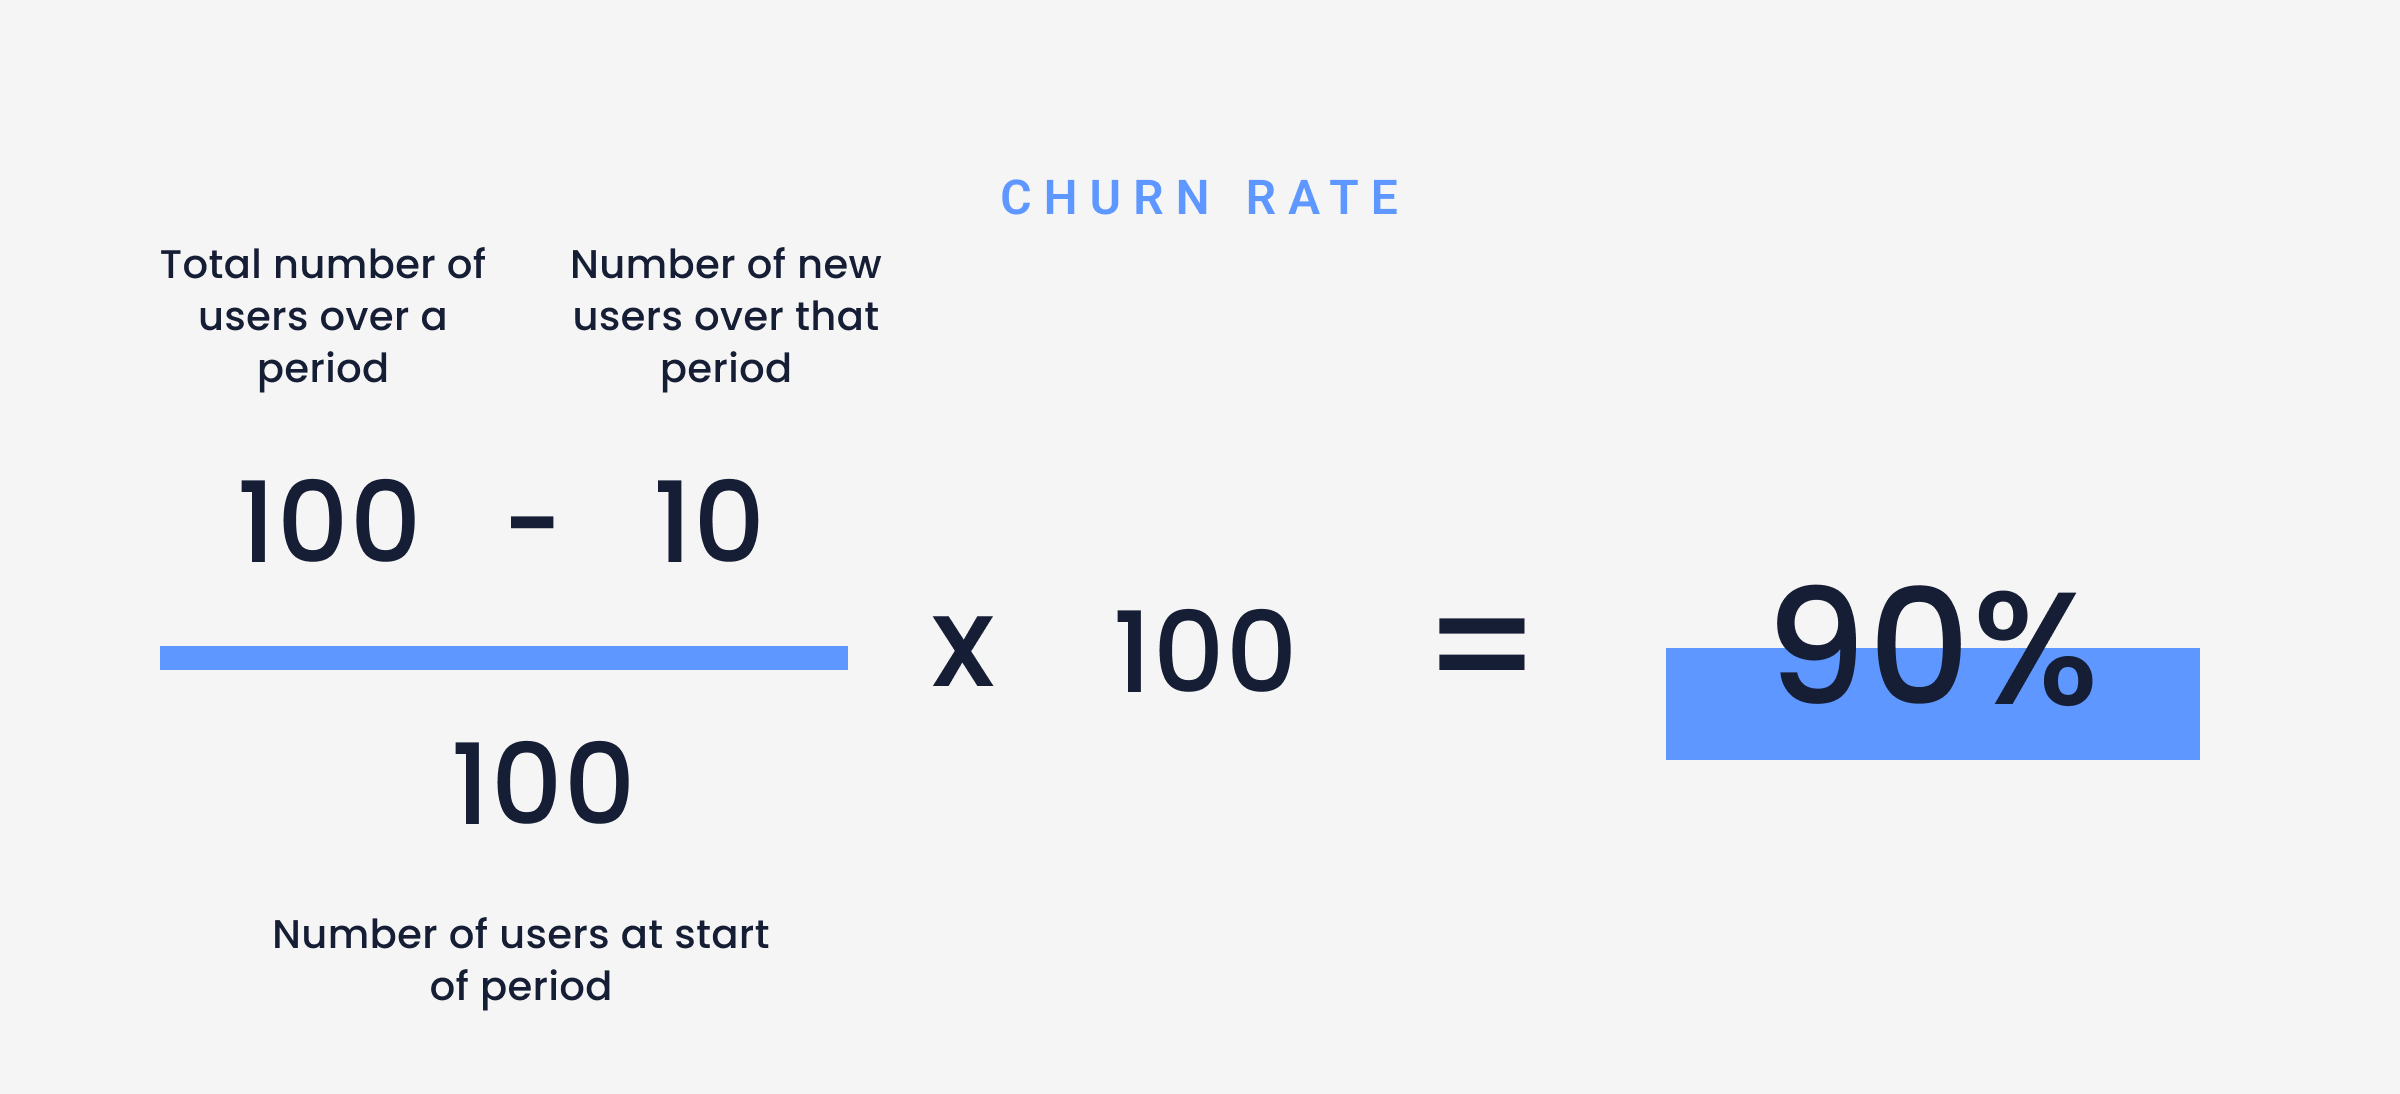
5. Churn rate
This metric measures the rate at which users leave your product. It’s important to keep track of this metric, as it can help you understand why customers don’t stick around and how you can improve the user experience.
How to measure churn rate


6. Retention rate
Customer retention rate is the number of customers you keep over a specific period. It confirms how well your app demonstrates value and supports them in reaping the benefits—for example, a successful onboarding process.
How to measure retention rate


7. Customer lifetime value (CLV)
This metric indicates how profitable your customers are. It considers the total value that each customer brings to your business, or in other words, the profit you make from them throughout their lifetime as a customer.
How to measure customer lifetime value (CLV)
CLV = Average Purchase Value × Average Purchase Frequency × Average User Lifespan
Start measuring product adoption with UXCam
Product adoption is measured by the percentage of customers actively using your product instead of activating an account and forgetting all about it. Choosing a comprehensive set of adoption metrics to track tells you how sticky your app is and how well your app convinces customers to adopt long-term.
UXCam makes it easier to spot hindrances that may impede customers from utilizing your app's value. Our platform for mobile data intelligence assists product teams in developing valuable, usable, and used products. Start your free trial today.
You might also be interested in these;
5 KPIs to measure your new feature adoption
8 KPIs CPOs should measure to improve app performance
12 KPIs to measure and improve your FinTech app onboarding strategy
AUTHOR
Tope Longe
Product Analytics Expert
Ardent technophile exploring the world of mobile app product management at UXCam.


Related articles


Product best practices
12 Apps with Great User Onboarding (2026 Examples)
The 12 mobile app onboarding flows I'd study if I were designing one today, with specific callouts for what each does well, common mistakes, and the...


Silvanus Alt, PhD
Founder & CEO | UXCam


Product best practices
Why creating a data-driven culture has less to do with data than you think
Kishan Gupta, CEO, shares 5 tips and techniques for fostering a data-driven culture based on his own experiences building and leading...


Kishan Gupta
Co-Founder of UXCam


Product best practices
Finance apps have a customer support problem, here's how to fix it
Learn about the customer support problem in finance apps and practical solutions to fix it in our latest blog post, and improve user satisfaction and...


Jane Leung
Product Analytics Expert