15+ Mobile App Engagement Benchmarks by Industry 2026


Ah, mobile app engagement — the metric we all obsess over, right? You've poured your heart and soul into building an amazing app, but the real challenge starts when you're trying to keep users coming back for more. It's like hosting a party; the invite (or download) is just the first step—the real success is in keeping the dance floor buzzing!
In this article, we dive into a guide to mobile app benchmarking and best practices to help you learn what aspects of your app design need to align more with your industry’s standard.
Overview of Mobile App Engagement Benchmarks


Source: Sendbird
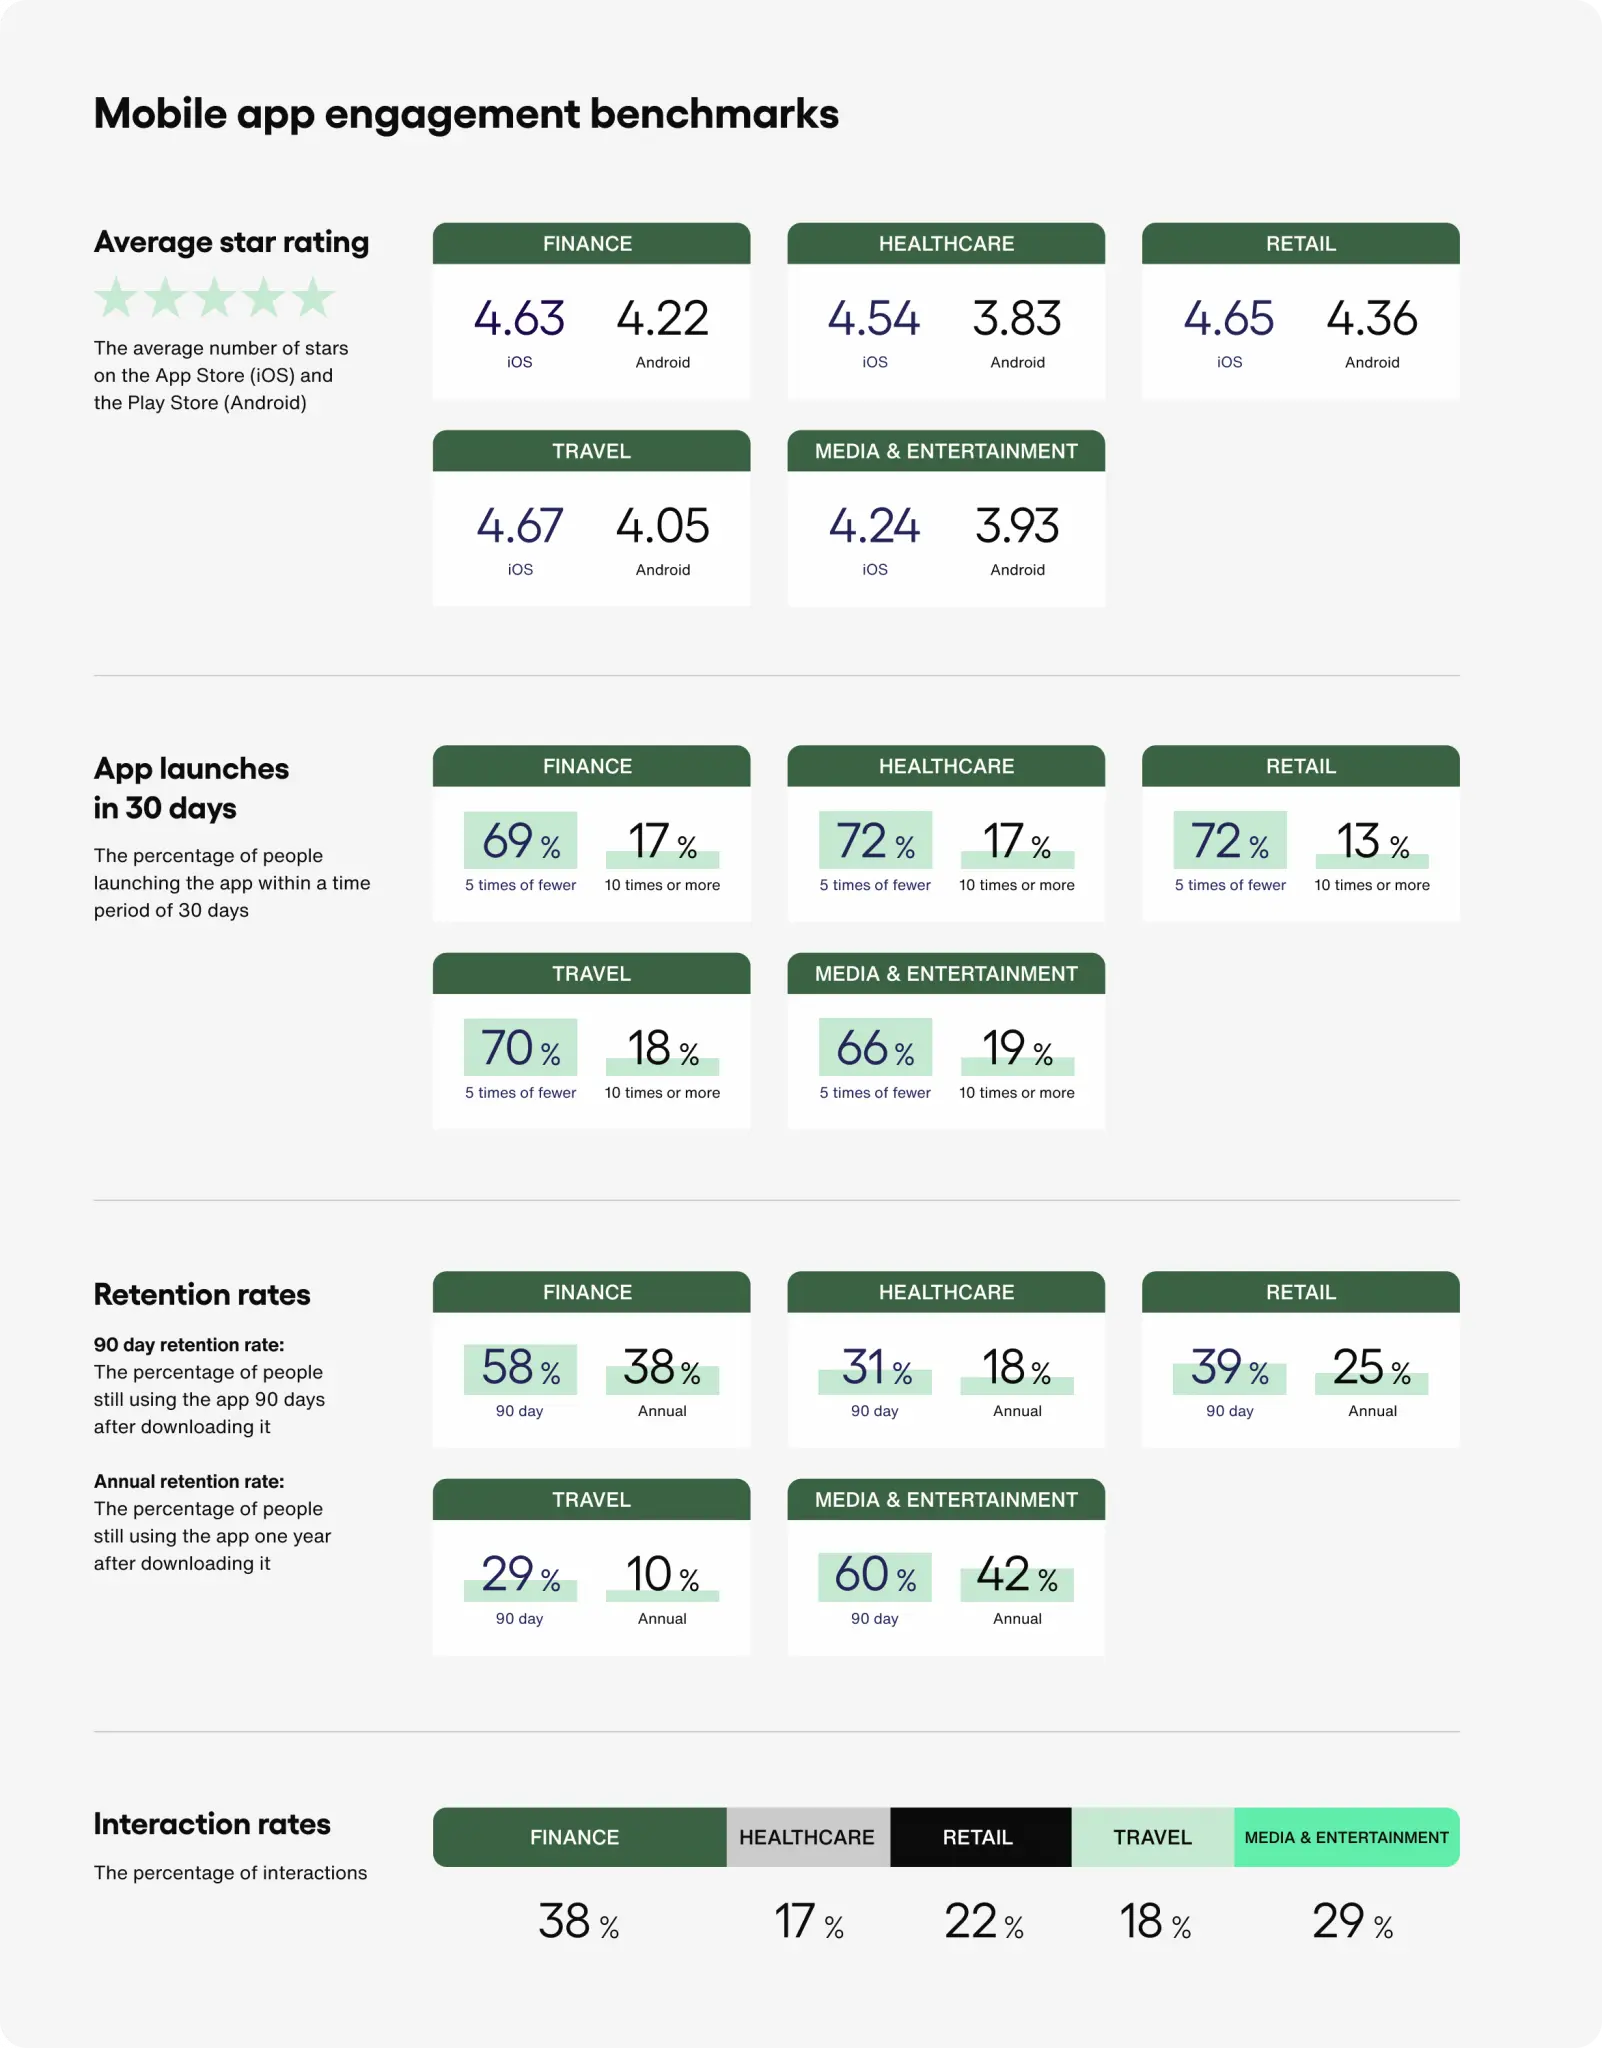
Mobile app engagement benchmarks overview by industry
Finance industry
| Average star rating | Usage | Interaction |
|---|---|---|
| iOS: 4.63 stars, Android: 4.22 stars | 69% launch app ≤5 times in 30 days, 17% launch app ≥10 times | Average interaction rate: 38%, Average interaction to response rate: 94% |
Healthcare industry
| Average star rating | Usage | Interaction |
|---|---|---|
| iOS: 4.54 stars, Android: 3.83 stars | 72% launch app ≤5 times in 30 days, 17% launch app ≥10 times | Average interaction rate: 17%, Average interaction to response rate: 95% |
Retail industry
| Average star rating | Usage | Interaction |
|---|---|---|
| iOS: 4.65 stars, Android: 4.36 stars | 72% launch app ≤5 times in 30 days, 13% launch app ≥10 times | Average interaction rate: 22%, Average interaction to response rate: 91% |
Travel industry
| Average star rating | Usage | Interaction |
|---|---|---|
| iOS: 4.67 stars, Android: 4.05 stars | 70% launch app ≤5 times in 30 days, 18% launch app ≥10 times | Average interaction rate: 18%, Average interaction to response rate: 85% |
Media & entertainment industry
| Average star rating | Usage | Interaction |
|---|---|---|
| iOS: 4.24 stars, Android: 3.93 stars | 66% launch app ≤5 times in 30 days, 19% launch app ≥10 times | Average interaction rate: 29%, Average interaction to response rate: 92% |
What are mobile app engagement benchmarks?
Mobile app engagement benchmarks are standardized metrics that help you evaluate how well your mobile app is performing in terms of user engagement. These benchmarks serve as a point of reference, allowing you to compare your app's performance against industry standards or competitor apps. They can provide valuable insights into areas like user retention, session length, daily or monthly active users, churn rate, and more. Here are some common metrics for mobile app engagement benchmarking:
Daily Active Users (DAU): The number of unique users who engage with your app on a daily basis.
Monthly Active Users (MAU): The number of unique users who engage with your app at least once in a month.
Retention Rate: The percentage of users who continue to use your app over a specific time frame, often measured at Day 1, Day 7, and Day 30 after the initial download.
Churn Rate: The percentage of users who stop using your app within a specific time frame.
Session Length: The average amount of time a user spends in your app per session.
Lifetime Value (LTV): The total revenue you expect to earn from a customer throughout their entire lifecycle of using your app.
User Engagement Rate: Measures how active users are within the app, often calculated based on specific interactions like clicks, shares, or feature usage.
Conversion Rate: The percentage of users who complete a desired action, such as making a purchase or signing up for a newsletter.
Many product teams implement an ongoing benchmarking strategy and conduct benchmarking analysis every six months or after a major release.
Why are mobile app engagement benchmarks important?
Ultimately, mobile app engagement benchmarks are essential to keep an eye on if you want your app to remain competitive in the market. Let’s examine exactly why app engagement benchmarks are so important:
Demonstrate the value of design decisions
Benchmark insights help teams show how their app improves over time through design changes. For example, you can impress your stakeholders by comparing conversion rates before and after a release to demonstrate the boost to ROI and your app’s positioning that your design changes have made.


With UXCam, you can easily share benchmarking results and the impact of your design changes using our customizable dashboards. Our platform helps you bridge your benchmarking data with your design decisions. Deliver justifiable and digestible analysis to answer everyone’s questions and have everyone sing from the same hymn sheet.
Goal setting for continuous improvement
Benchmarking involves key metrics and setting challenging yet achievable goals for constant business improvement. Transparent benchmarks help the team define clear goals for boosting engagement.
For instance, you might have noticed that your churn rates are higher than the benchmark industry standard. With this information in hand, you can start examining bottlenecks within your app that might cause users to leave, and fix them.
Understand user behavior for better UX
By holding a magnifying glass to your app through benchmarking, product teams can learn more about their user base. Engagement benchmarking highlights usage patterns, features, and functionality preferences. Knowing what resonates with users can help you connect with them by delivering on their expectations.
Additionally, benchmarking is essential for monitoring UX. Tracking engagement metrics like retention rate and session length compared to previous benchmarked results makes it easier to see whether UX has improved or dipped.
How to set your mobile app engagement benchmark
Use the right tracking and analytics tools
Do competitor analysis
Track and collect data regularly
Set a benchmark
Compare your data with your competitors
Adjust the design appropriately
Iterate and improve benchmarks
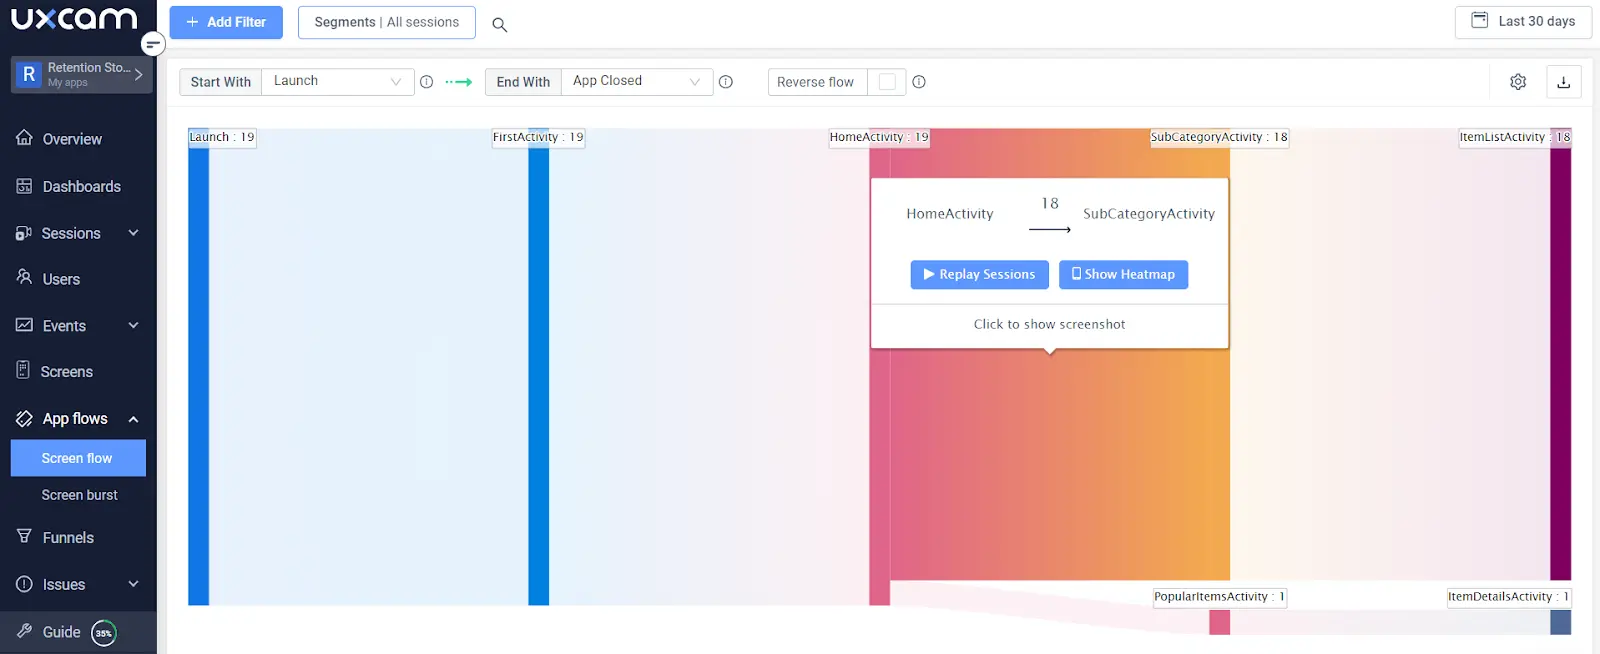
Step 1 - Use the right tracking and analytics tools


Finding the right tool is essential for a successful benchmarking strategy. For instance, UXCam collects data from every user that visits your app, giving you a detailed overview of things like churn rates, MAUs and DAUs, session length, etc., which you can then benchmark against other, similar apps.
For a thorough understanding of your users, consider our market-leading, Google-approved, lightweight SDK that will reliably collect natural, granular user behavior.
Step 2 - Do competitor analysis on mobile app engagement data in your niche
First, identify who your main competitors are. To get an accurate idea of your app’s performance, consider other apps of similar size and function. Use app store analytic apps like App Annie to determine which apps rank higher or lower than yours. Then start collecting your benchmark metrics by:
Accessing public reports such as the American Center for Productivity and Quality Benchmarking Code documents
Conduct research using a mobile intelligence tool to track the averages of your competitors’ number of downloads, session length, daily and monthly active users, etc.
With all the data gathered, analyze it to report on questions like:
Competitors' strengths and weaknesses.
Where your app’s design is behind or outdated.
The experiences you should consider adopting.
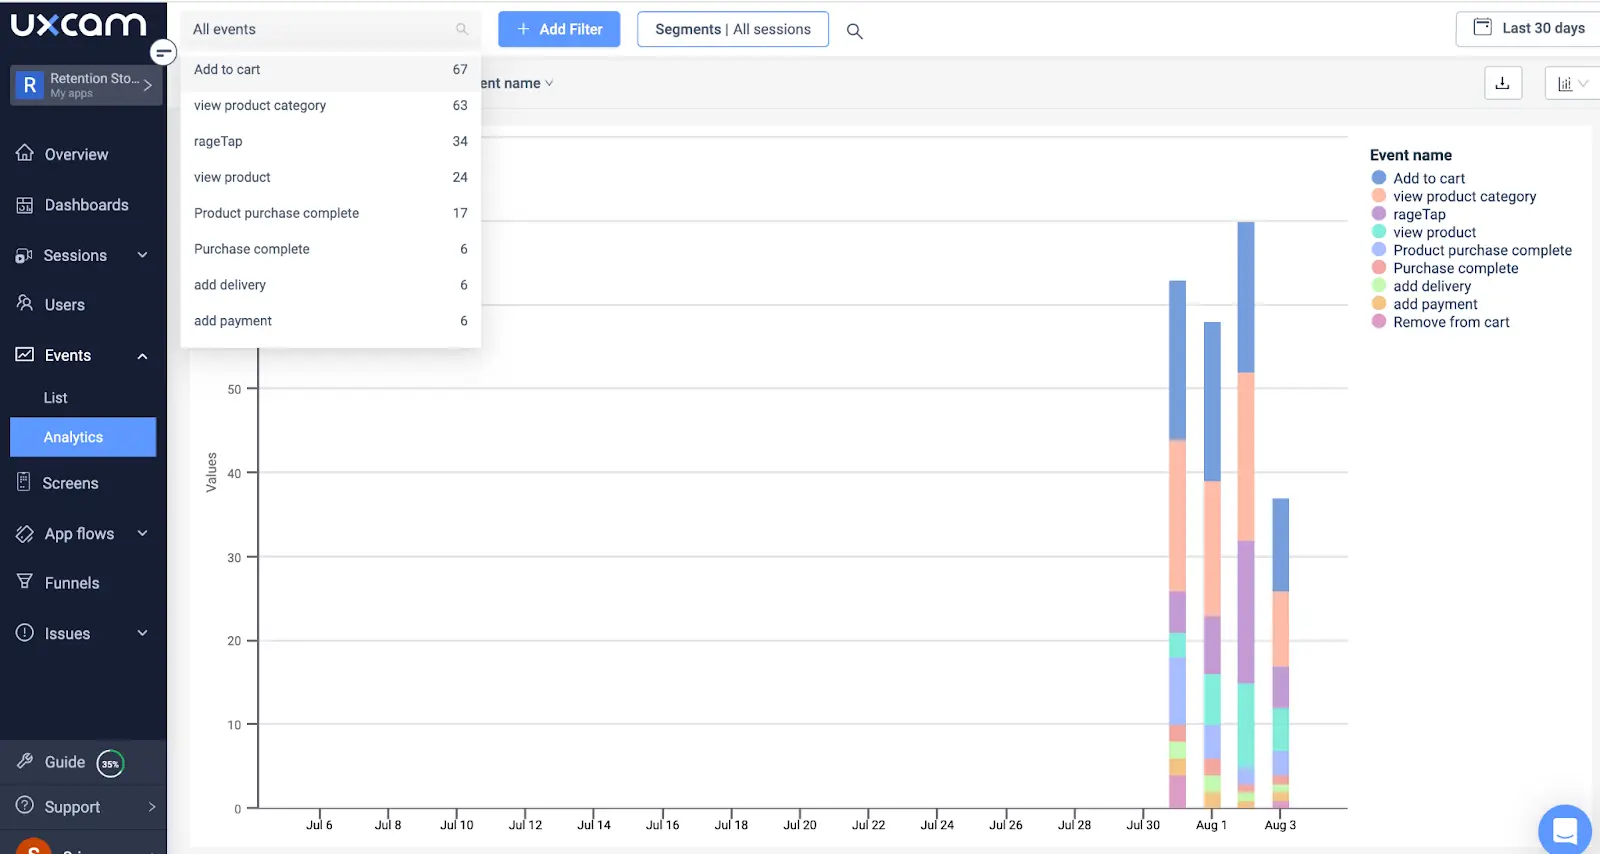
Step 3 - Track and collect data regularly (weekly, monthly, etc.)
To monitor progress and pinpoint emerging patterns, you must regularly collect, measure, and report on your competitors and your apps’ metric data. Consider setting up a schedule and using top leading analytic tools like UXCam to measure KPIs and user behavior data and generate reports for actionable and intuitive insights.


Step 4 - Set a benchmark based on your historical data, trends, and patterns


Use your understanding of your competitor's engagement metrics to set achievable engagement benchmarks for your app. Your benchmarks should align with the short and long-term improvements you wish to achieve in terms of engagement.
Consider your engagement metrics carefully; for example, striving for more active users will hold more weight than aiming for more downloads since a downloaded app does not guarantee an active user. A simple and effective example of a benchmark to measure success in active app use against your toughest competitors is to set a goal to achieve X % of downloads and Weekly Active Users.
Consider benchmarking tools such as AppTweak for industry averages and trends in your market.
Step 5 - Compare your data with your competitors
Examine the data to identify your app’s strengths and weaknesses. A S.W.O.T analysis can help uncover internal and external factors that affect your app’s performance:
Strengths: What makes your app stand out?
Weaknesses: What makes your app lose money? What app features need an upgrade?
Opportunities: Potential areas for improvement and growth.
Threats: External influences that could damage your app’s rep or performance.
And what’s next for your app design?
Additionally, reflect on your app’s performance throughout the period by answering questions like whether there’s a shift in performance.
Step 6 - Adjust the design appropriately
Use the insights gained from your KPI data comparisons to inform your design decisions and optimizing your app. The answers from your S.W.O.T analysis, app analytics tool, trends, and patterns will inform the necessary design changes. Consider how your app’s UX and technical performance can be improved.
UXCam helps by analyzing how your design changes have impacted conversions and other goals you’re focused on.


Step 7 - Iterate and improve benchmarks
Continuously iterate and refine your app design based on benchmark insights to increase engagement and improve your positioning in your industry.
Following reflection, consider whether your strategy requires adjustment. An ongoing and regular iteration and refinement of your benchmarking process is also necessary, to keep on top of engagement performance. Each time you benchmark, look at the new apps that have joined your industry since the last analysis.
Increase mobile app engagement, best practices
Use efficient onboarding: 25% of app users abandon apps after one use, so ensure your onboarding process is concise and streamlined so your customers can easily navigate and get value immediately from your app.
Gamify your app: Consider allowing users to earn rewards using UX gamification through challenges and processes. This injection of fun and rewards encourages more engagement and stickiness.
Use strategic push notifications: Push notifications help your business stay in the minds of your customers. It provides a personalized experience and re-engagement even when the app is closed.
Segment your audience: Remember your customer base is different, so segment your customers and create personalized experiences for each segment. Our platform makes it easier to see behavior patterns for your new, loyal, and slipping-away users, allowing you to design funnels to target these users specifically.


Beat the competition with UXCam
Mobile app benchmarking is the best way to see how your app measures up to the top apps in your niche. With access to public reports and benchmarking tools, you’ll see how your app performs in common KPIs such as daily and monthly active users, retention, and churn rates.
UXCam is a leading mobile app analytics tool to complete your benchmarking strategy. Use our features to learn why you got the benchmarking results you did. And understand how users engage and interact with your app to make the right design decisions.
Ready to make the design moves to blow your competitors out of the park? Start your free trial or request a demo today.
You might also be interested in these; Funnel drop-off rates - benchmarks & strategies to improve
Mobile app benchmarks to improve your product strategies
AUTHOR
Tope Longe
Product Analytics Expert
Ardent technophile exploring the world of mobile app product management at UXCam.


Related articles


Mobile app analytics
12 Mobile App Analytics Metrics That Actually Matter in 2026
Mobile app analytics metrics are the quantitative signals product teams use to measure performance, engagement, and...


Silvanus Alt, PhD
Founder & CEO | UXCam


Mobile app analytics
Mobile App Retention Benchmarks by Industry (2026)
Mobile app retention benchmarks for 2026, broken down by industry. Day-1, day-7, day-30 retention rates for fintech, ecommerce, social, gaming, and more,...
Silvanus Alt, PhD
Founder & CEO | UXCam


Mobile app analytics
Sentry vs Datadog: Features, Pricing, and Which One Fits Your Production Stack
Sentry vs Datadog compared head-to-head on features, pricing, and the production stacks each one...
Silvanus Alt, PhD
Founder & CEO | UXCam