20+ Mobile App Benchmarks by Industry 2026


With over 8 million mobile apps on the market, standing out against competitors is essential to avoid losing users to other apps.
In this guide, we will share the most important mobile app benchmarks, so you can see how you compare to your competition.
Mobile App Engagement Benchmarks


Source: Sendbird
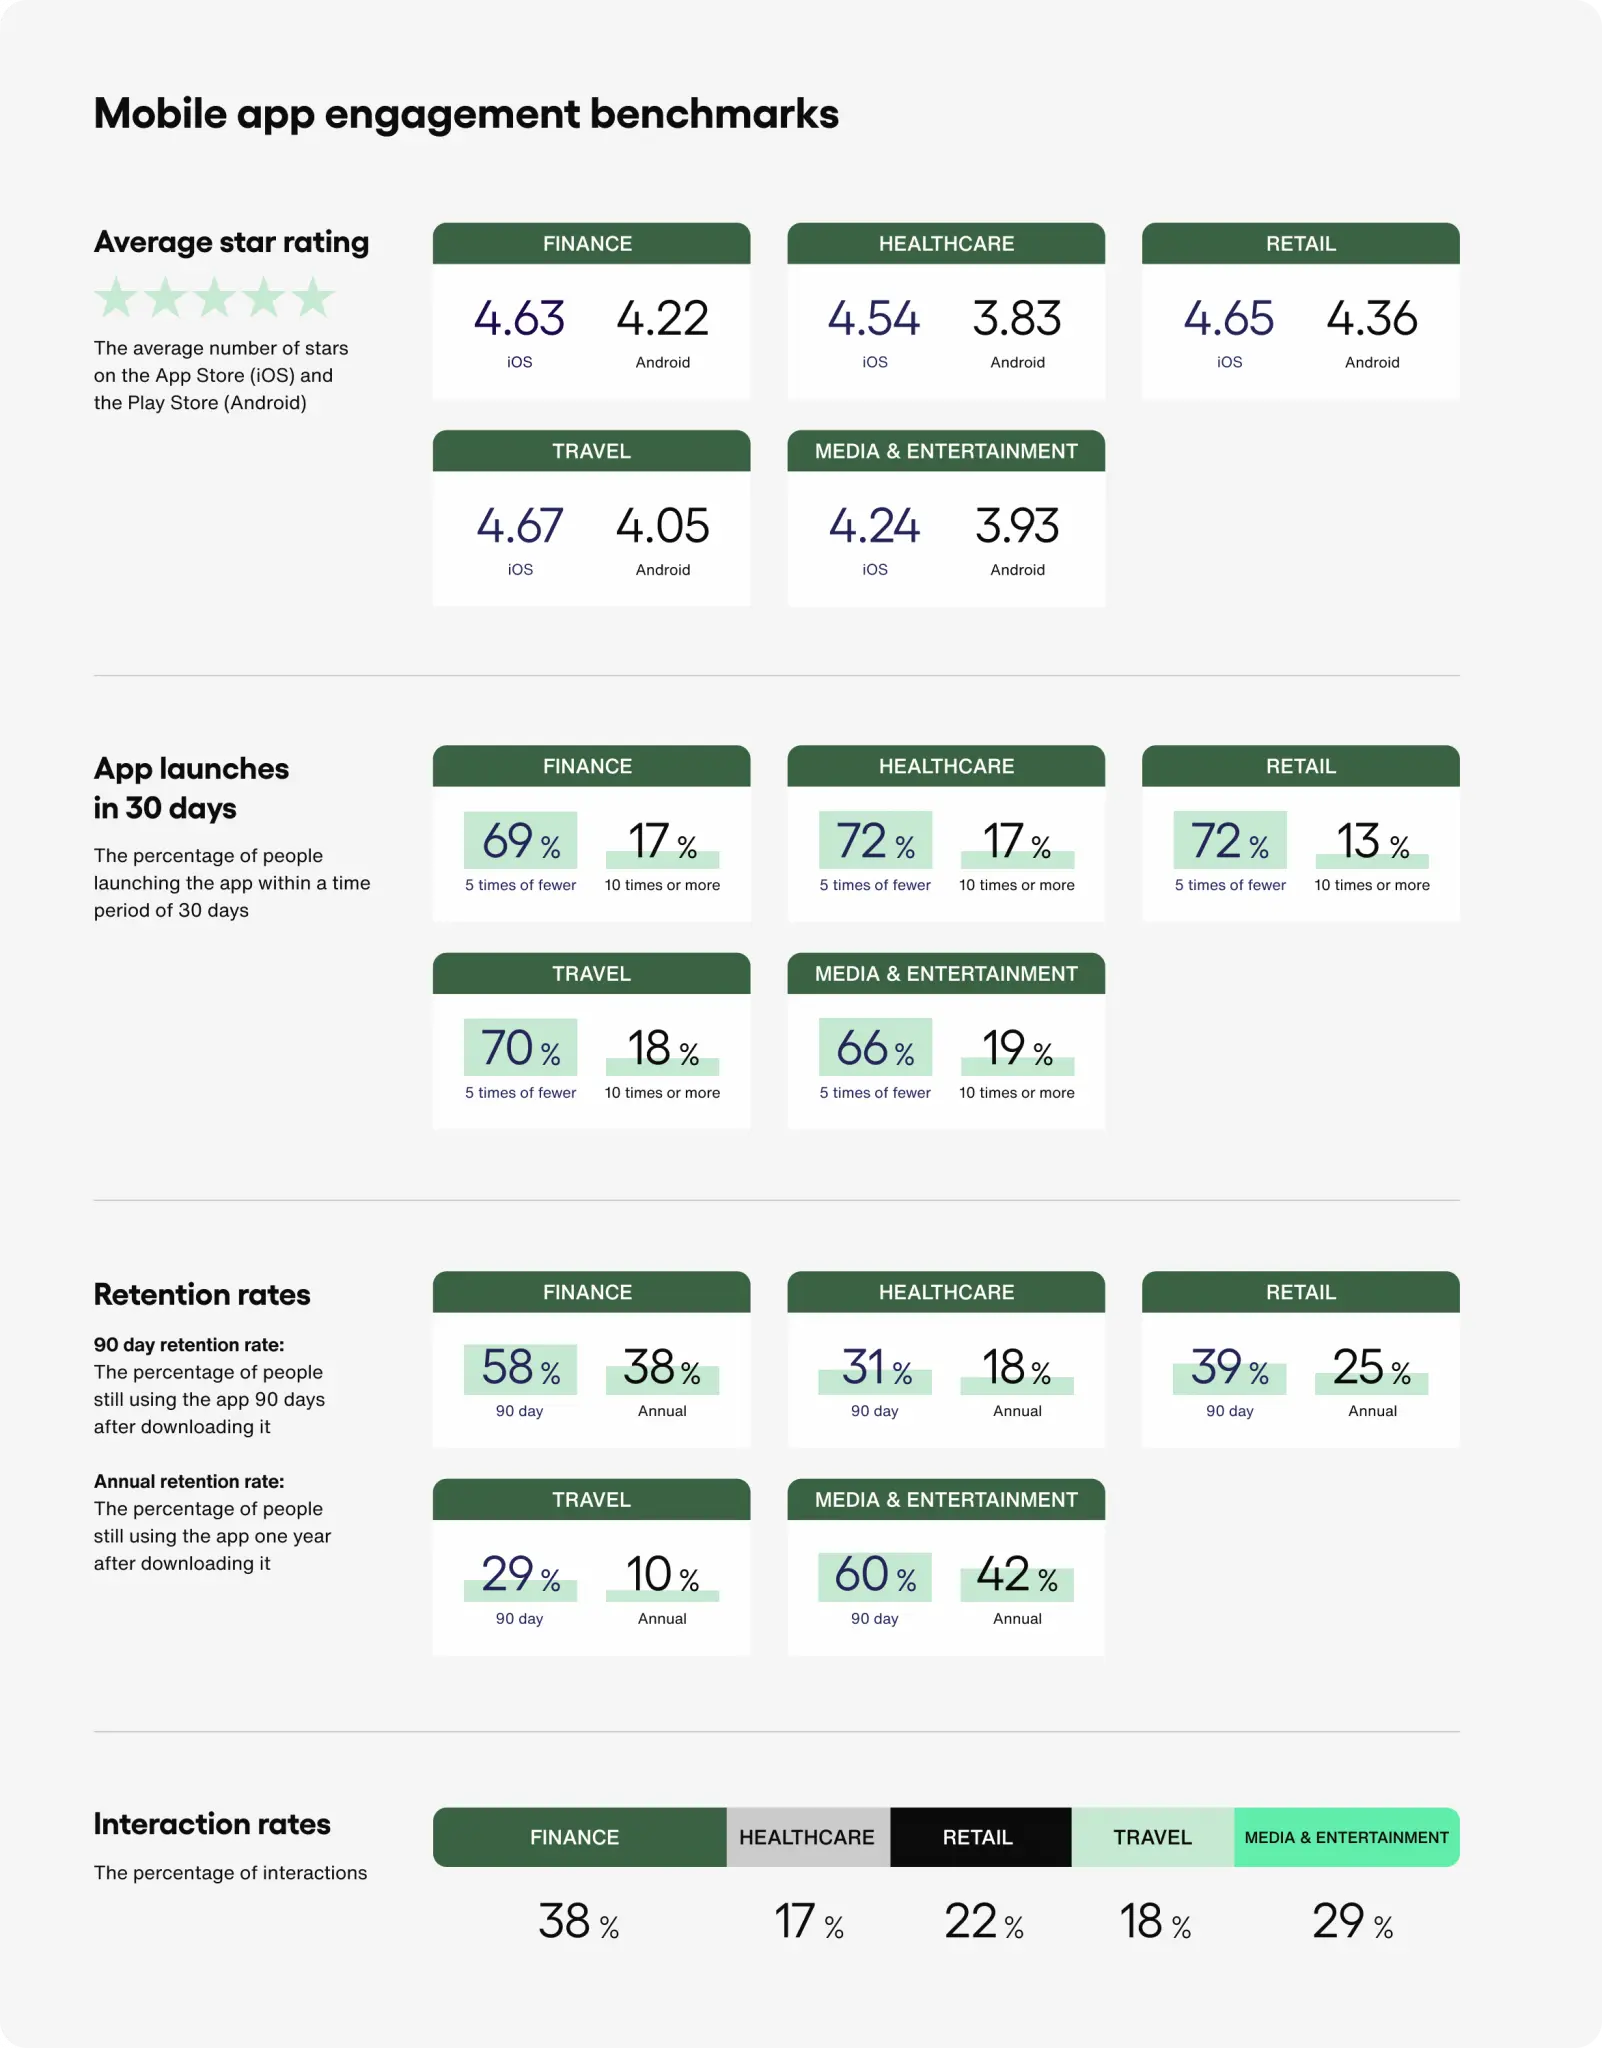
Mobile app engagement benchmarks overview by industry
Finance industry
| Average star rating | Usage | Interaction |
|---|---|---|
| iOS: 4.63 stars, Android: 4.22 stars | 69% launch app ≤5 times in 30 days, 17% launch app ≥10 times | Average interaction rate: 38%, Average interaction to response rate: 94% |
Healthcare industry
| Average star rating | Usage | Interaction |
|---|---|---|
| iOS: 4.54 stars, Android: 3.83 stars | 72% launch app ≤5 times in 30 days, 17% launch app ≥10 times | Average interaction rate: 17%, Average interaction to response rate: 95% |
Retail industry
| Average star rating | Usage | Interaction |
|---|---|---|
| iOS: 4.65 stars, Android: 4.36 stars | 72% launch app ≤5 times in 30 days, 13% launch app ≥10 times | Average interaction rate: 22%, Average interaction to response rate: 91% |
Travel industry
| Average star rating | Usage | Interaction |
|---|---|---|
| iOS: 4.67 stars, Android: 4.05 stars | 70% launch app ≤5 times in 30 days, 18% launch app ≥10 times | Average interaction rate: 18%, Average interaction to response rate: 85% |
Media & entertainment industry
| Average star rating | Usage | Interaction |
|---|---|---|
| iOS: 4.24 stars, Android: 3.93 stars | 66% launch app ≤5 times in 30 days, 19% launch app ≥10 times | Average interaction rate: 29%, Average interaction to response rate: 92% |
Mobile App Conversion Benchmarks


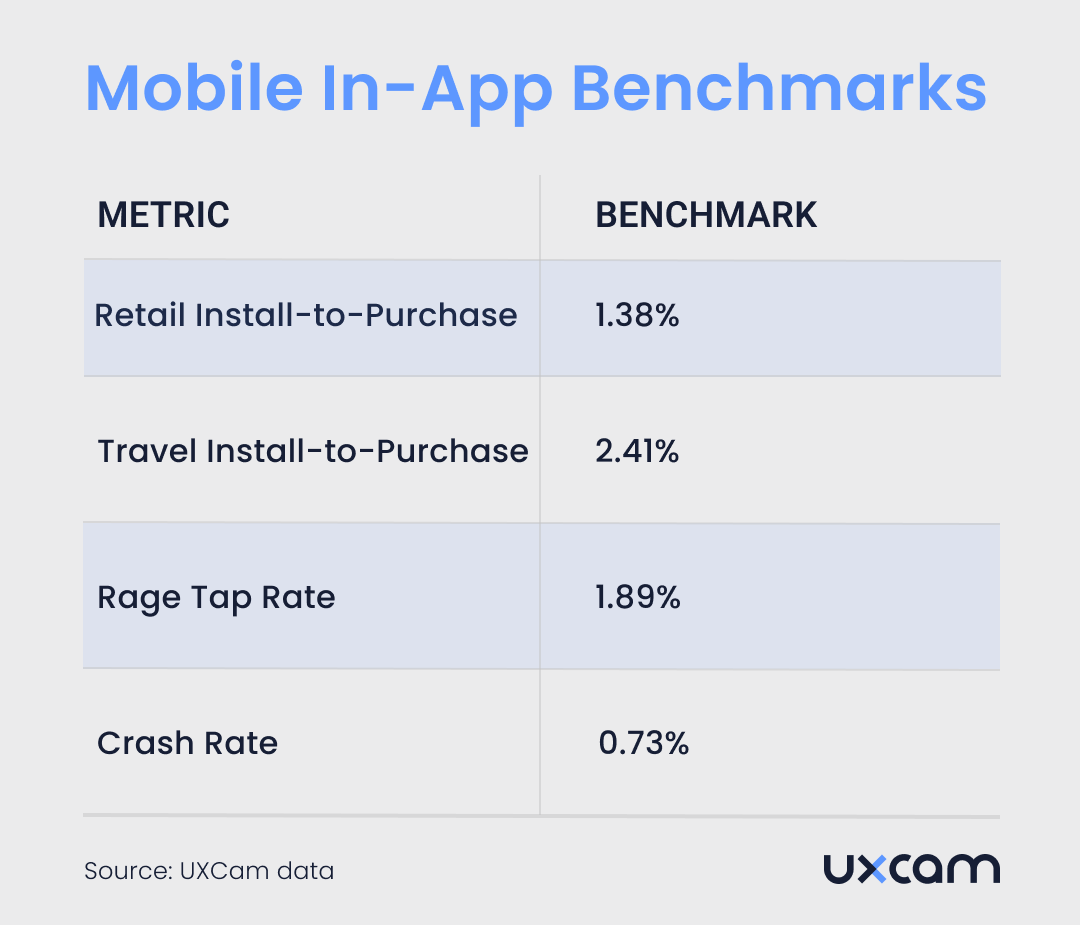
In-app conversion rate benchmarks overview
General Conversion Insight
Install-to-purchase conversion rates: 1-2%. (Source: UXCam data)
By Industry
Retail apps install to purchase conversion rate: 1.38% (Source: UXCam data)
Travel apps install to purchase conversion rate: 2.41% (Source: UXCam data)
Other benchmarks that influence in-app conversions
Rage Tap: 1.89% (Source: UXCam data)
App Crashes: 0.73% (Source: UXCam data)
App Store Conversion Rate Benchmarks
Here are the latestaverage conversion rates for the App and Google Play Store:
App Store
Page View to Install: 33.7%
Impression to Install: 3.6%
Google Play
Page View to Install: 26.4%
Impression to Install: 3.1%
Note: It's essential to consider that average conversion rates can vary significantly based on factors like app genre and niche.
Mobile App Retention Benchmarks
| Mobile App Industry | Retention Rate on Day 30 |
|---|---|
| News | 11.3% |
| Business | 5.1% |
| Shopping | 5% |
| Finance | 4.6% |
| Music | 3.8% |
| Food & Drink | 3.7% |
| Health & Fitness | 3.7% |
| Lifestyle | 3.6% |
| Productivity | 3.2% |
| Video players | 3.1% |
| Entertainment | 3% |
| Travel | 3% |
| Social | 2.8% |
| Utilities | 2.6% |
| Gaming | 2.4% |
| Education | 2.1% |
| Photography | 1.5% |
Source: Statista
Importance of mobile app benchmarking
Inform product strategies
Mobile app benchmarking helps you identify areas you’re falling short in, such as revenue or app downloads. You can use these insights to make changes to your app and improve customer experience.
Saves time, money, and resources
By benchmarking and analyzing product analytics, you make well-informed decisions, leading to significant time and cost savings in the long run.
Understand user behavior
Mobile app benchmarks provide you with behavioral insights that help you understand product experience. This way, you can build your app around your user and satisfy their demands or expectations.
Metrics to measure for mobile app benchmarking
Average revenue per user (ARPU)
ARPU measures the average amount of revenue you can expect to generate from a single user.
ARPU = Total Revenue (during set time period) ÷ Number of Active Users (during set time period)
Lifetime value (LTV)
LTV estimates the total amount of revenue a single customer will bring you throughout their time using your app.
LTV = Average Purchase Value x Average Number of Transactions x Average Retention Period
Conversion rate (CR)
Conversion rate calculates the percentage of users who make a conversion (e.g., making a purchase or signing up to a trial).
CR = (Total Conversions ÷ Total App Store Product Page Views) x 100
In-app purchase (IAP) conversion rate
IAP conversion rate tells you what percentage of users make purchases from within your app.
IAP Conversion Rate = (Total Amount of In-App Purchases ÷ Total Amount of Users) x 100
Ad revenue per user
Ad revenue per user is the average amount of revenue you generate from showing in-app ads to a user.
Ad Revenue = Ad Impressions x Effective Cost Per Mille (eCPM)
eCPM = (Total Earnings (gained from ads) ÷ Total Ad Impressions) x 1,000
Retention
Retention measures the percentage of customers who continue to use your app during a specific period of time.
Retention Rate = ((Number of Users at the End of Period - Number of Users Gained During Period) ÷ Number of Users at the Beginning of Period) x 100
App ratings
App ratings are customer reviews that score your app on a scale of 1 to 5 (usually). Use this feedback to identify areas of user frustration and make improvements to your app to boost your ratings.
Session Length
Session length calculates how long a user spends on your app per visit. A longer session means higher engagement and increases the likelihood of conversions.
How to benchmark your mobile app performance
Do a gap analysis
Plan ahead
Gather data and benchmark
Benchmark your competitors
Repeat
Step 1 - Do a gap analysis
Do a gap analysis to determine how far away you are from achieving your desired performance. Create custom surveys for users to evaluate satisfaction or utilize UXCam’s analytics tools to track metrics such as conversion rate and session length.


Step 2 - Plan ahead
Research similar apps to find worthy competitors. Separate these apps into three categories:
Direct Competitors: Apps that offer the same or similar products to yours.
Indirect Competitors: Apps that satisfy the same customer needs but offer different products to yours.
Aspirational Competitors: Apps that you aspire to be. These are often the highest-performing apps within your niche.
You should also research your target audience to learn more about their wants and needs. This will help you make improvements to your app and reach your mobile app benchmarks.
Step 3 - Gather data and benchmark
Gather data on your competitors’ app performance via public reports or data intelligence platforms like Apptopia.


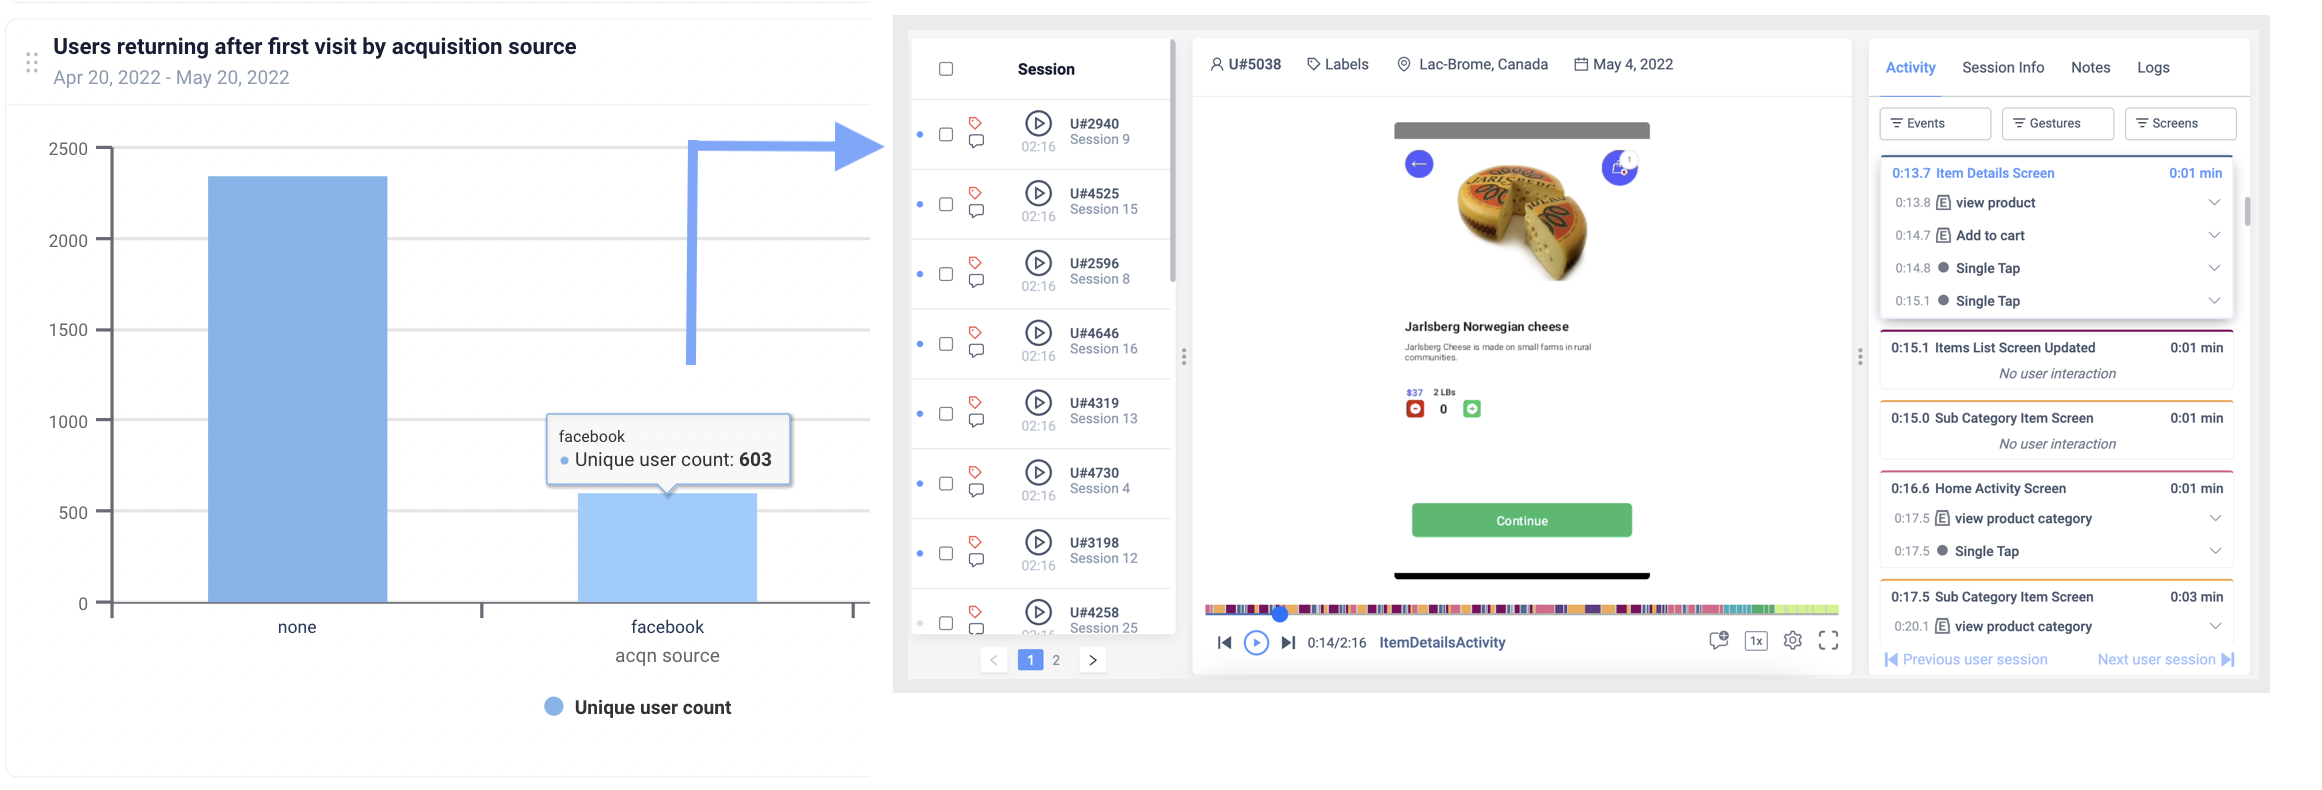
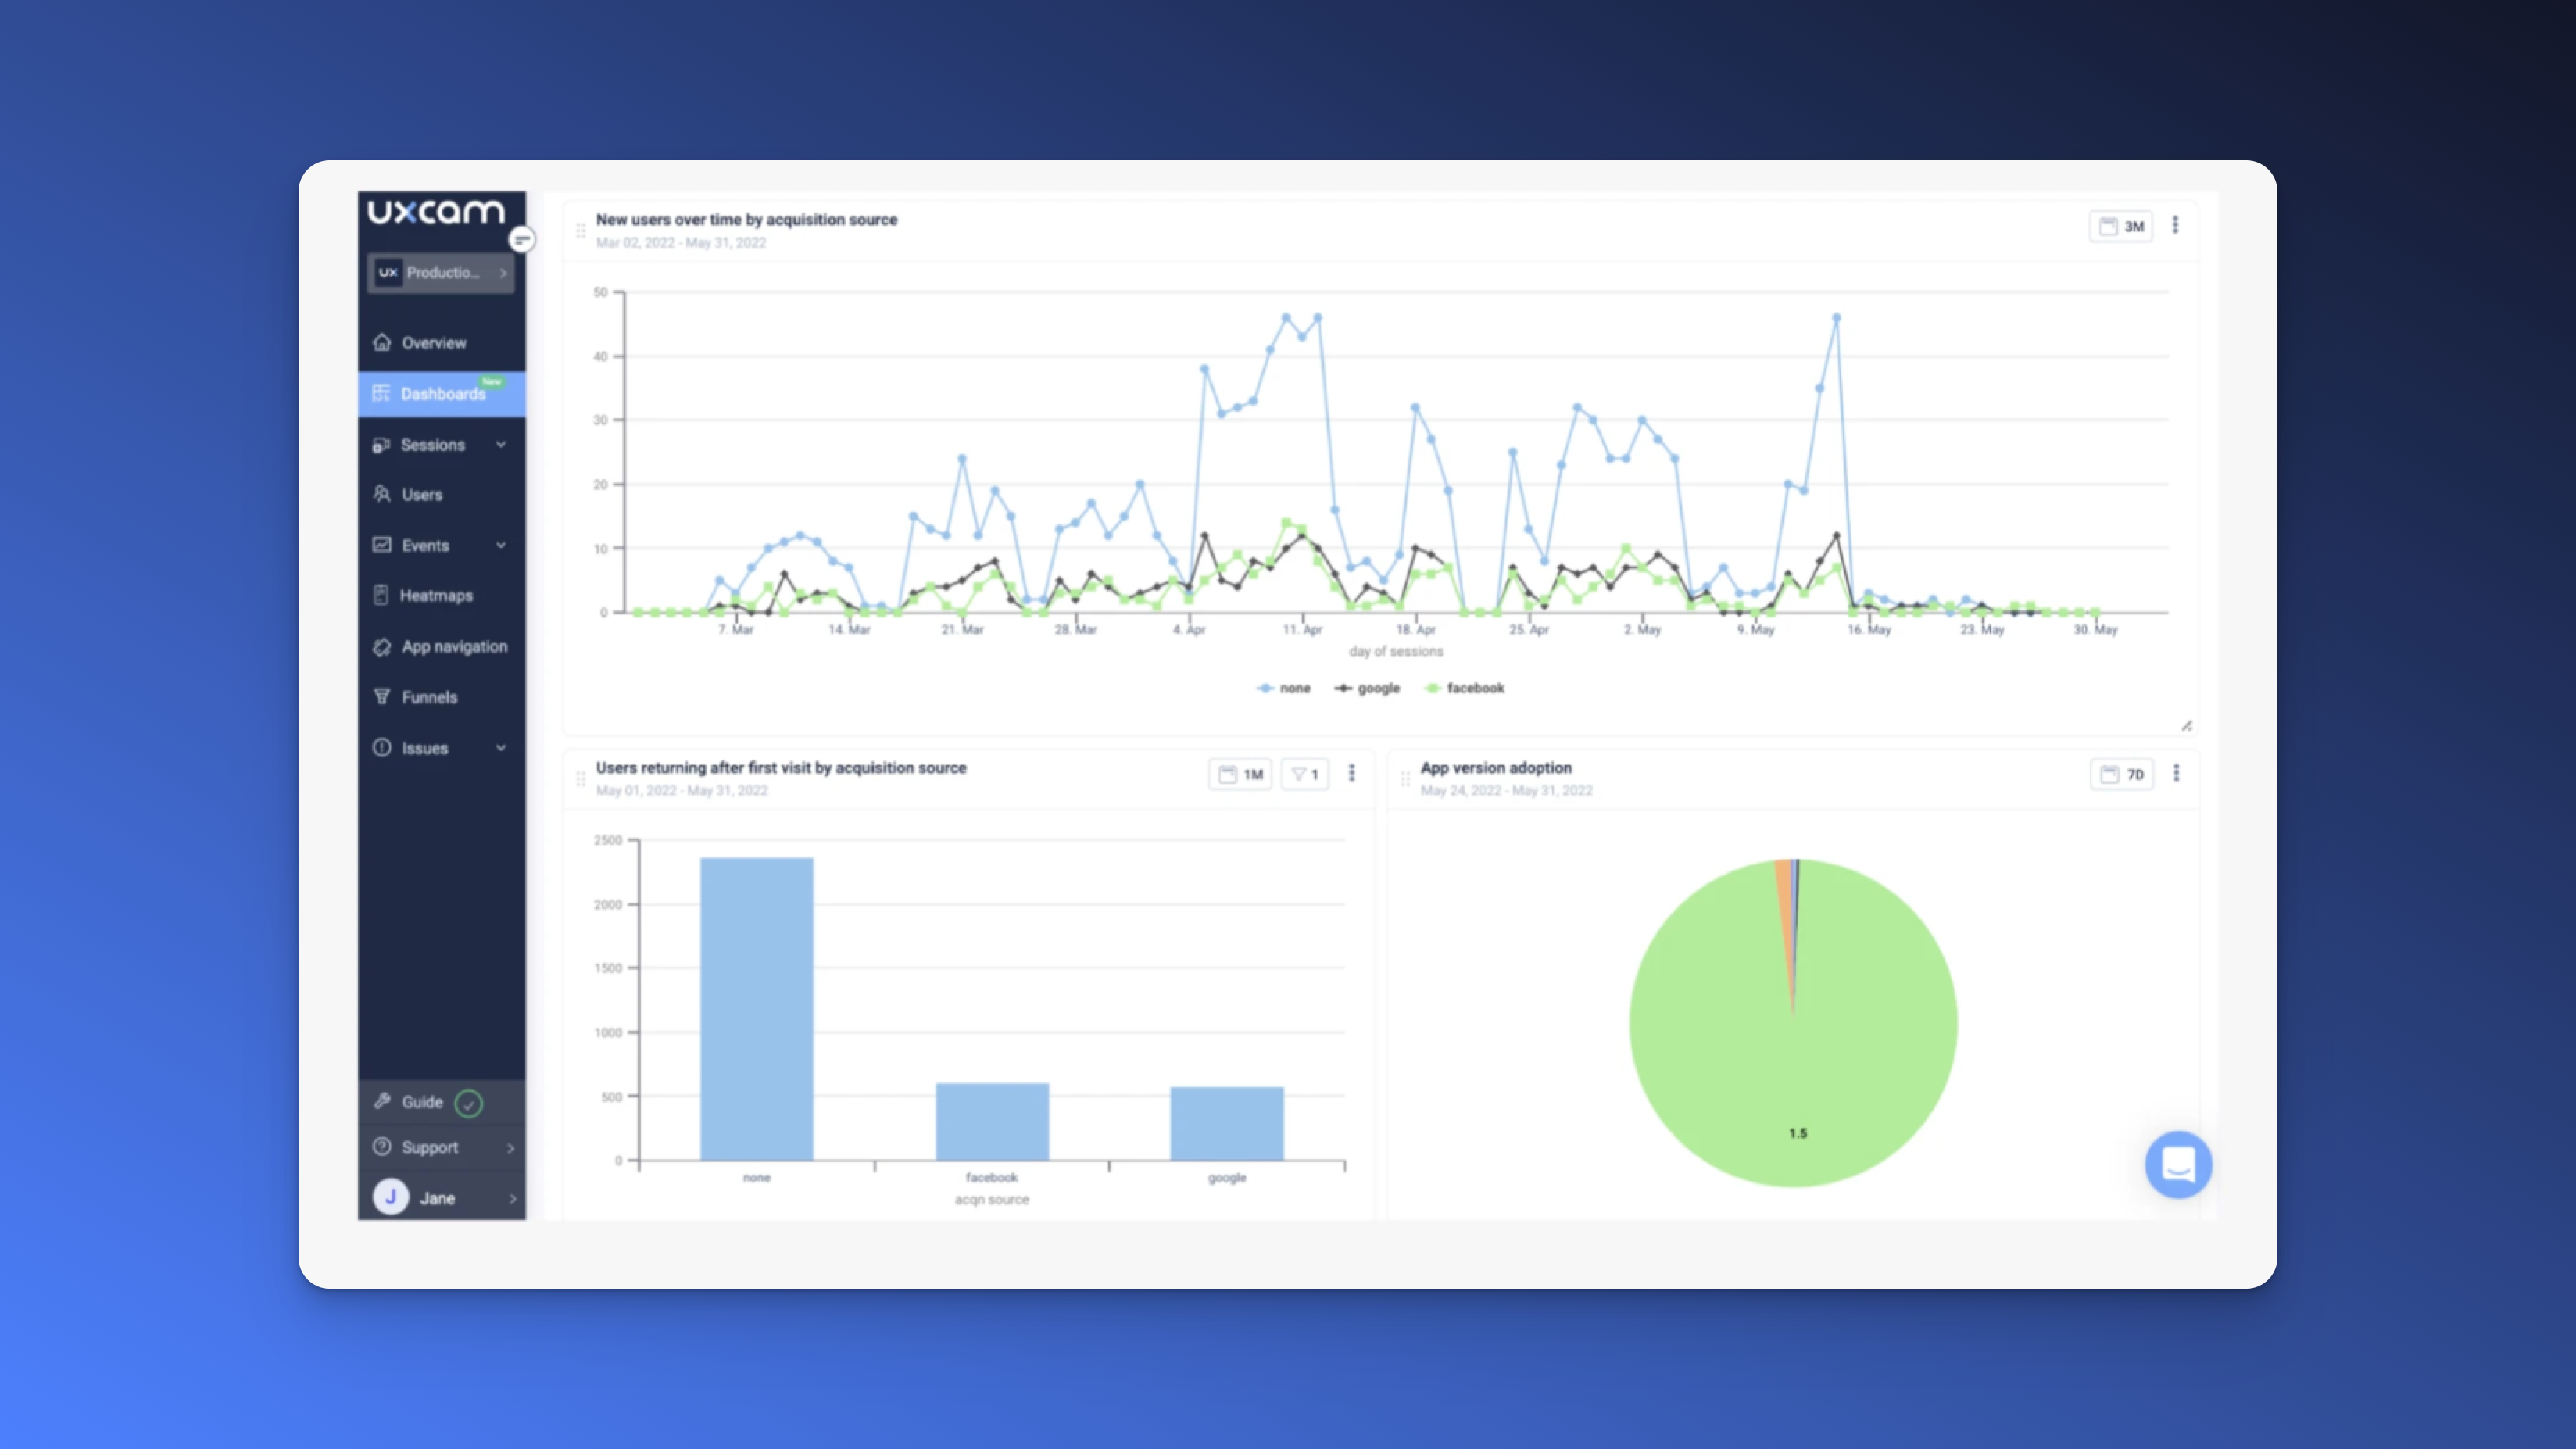
You also need to gather data on your own app using in-app feedback tools like UXCam. Visualize all your product analytics on one dashboard, including Total Time Spent in App, Weekly Active Users over Time, and much more.


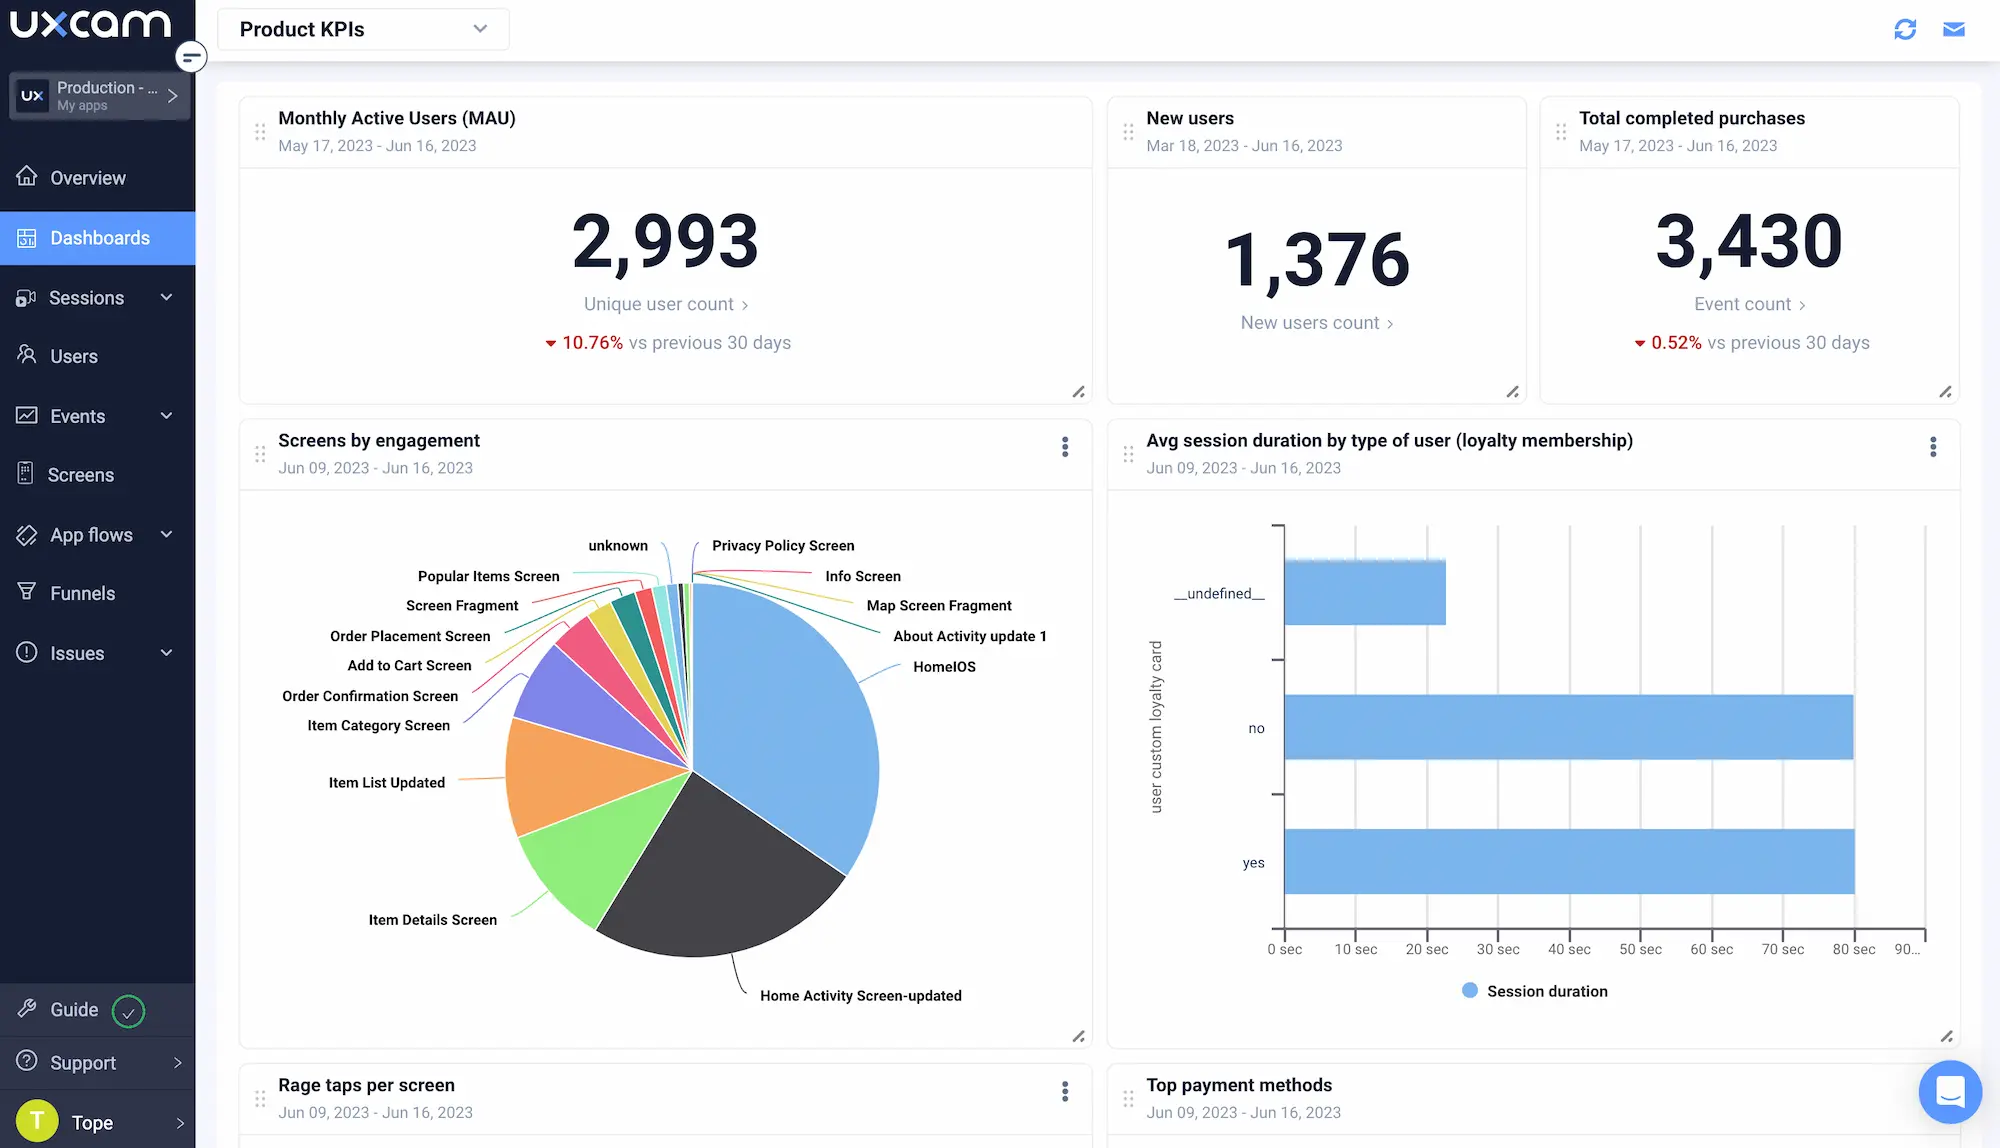
Pro Tip: Instantly Track Key Metrics
Set up dashboards in one click using UXCam's extensive recommended reports library for effortless KPI monitoring.
This streamlined setup allows you to combine quantitative and qualitative data seamlessly with an intuitive, no-formula interface.
With everything integrated, you can transition smoothly from metrics to actionable insights by accessing user sessions directly from your dashboards.
Step 4 - Benchmark your competitors
Compare your data to your competitors and determine which metrics you’re falling short in. Set goals for those metrics and aim for the same or higher results than your competitors.
Consider the following things:
What is a realistic goal to aim for?
What statistics do you need to achieve to become top in your app category?
Does your app need changing (e.g., adding new features)?
What are the differences between your and your competitors’ metrics? How big is the gap?
What monetization or marketing methods are your competitors utilizing? Are there any strategies you can adopt?
Improve opt-in rates for push notifications
Boost your user engagement with opt-in push notifications. Once a user installs your app, you can give them the option to turn on push notifications to simplify the process. This way, users get reminded of your app’s existence on a regular basis, which encourages them to visit your app more often.
Push notifications also allow you to send messages to your customers from outside the app, which helps strengthen user relations.
Step 5 - Repeat
Benchmark your mobile app periodically to see if there are any changes to your performance. If possible, assess new competitors every time you analyze your mobile app benchmarks.
What is mobile app benchmarking?
Mobile app benchmarking involves comparing your app's performance metrics against those of your competitors. By analyzing these key performance indicators (KPIs), you can gauge your app's standing within its niche and identify areas for improvement.
Using competitors as a benchmark, you can set tangible goals for your app. For instance, if a competitor boasts 500 monthly active users (MAU), you might set a target to match or surpass this figure. Such goal-setting ensures your app remains competitive and relevant in its market segment.
For a comprehensive view of your app's performance, tools like UXCam offer in-depth experience analytics. With such product experience software, you can easily monitor KPIs, including Daily Active Users over Time and Average Events per Day, all consolidated on a single dashboard.


Conclusion
It’s difficult to gauge the success of your app if you don’t have any points of comparison. That’s why it’s important to conduct mobile app benchmarks and assess your performance against competitors in your niche. View valuable product insights with tools such as UXCam to easily keep track of your KPIs.
Request a demo to get a closer look at our analytics tools, or start a free trial today to gain access to in-depth performance metrics.
You may also be interested in; Mobile app conversion rate: benchmarks & best practices
Mobile app KPI dashboard examples and how to use them
How to increase mobile app engagement
Funnel analysis examples: How to improve app conversions
Say hello to new funnels: Analyzing app conversion rates just got easier
AUTHOR
Tope Longe
Product Analytics Expert
Ardent technophile exploring the world of mobile app product management at UXCam.


Related articles


Conversion Analysis
React Native Crash Reporting + Best Tools and Techniques
Learn how to improve your mobile app's stability with effective React Native crash reporting. Explore the top techniques and tools for monitoring and managing...
Tope Longe
Product Analytics Expert


Conversion Analysis
Flutter Performance Monitoring - Best Tools and Techniques
In this article, we'll introduce you to the top Flutter performance monitoring tools and demonstrate how UXCam can help you monitor your app's performance with...
Tope Longe
Product Analytics Expert


Conversion Analysis
How to measure, analyze, and reduce app churn
All the user acquisition in the world won't matter if you've got a high churn rate on your app. If you want to know why users are uninstalling or unsubscribing, tools like screen flow, heatmaps, and screen recordings can get users loving — instead of leaving your...
Tope Longe
Product Analytics Expert