Mobile App Conversion Rate Benchmarks & Tips for 2026

TABLE OF CONTENTS
- What is mobile app conversion rate?
- What is a good conversion rate for mobile apps in 2026?
- Mobile app conversion rate benchmarks
- App Store conversion rate benchmarks
- Mobile app retention rate benchmarks
- Types of mobile app conversions
- Why should you measure mobile app conversion rates?
- How to increase app conversion rate
- Use UXCam for Mobile App CRO
- Conclusion - Improve app conversion rate
Are you looking to increase the conversion rate of your mobile app?
If so, you’re not alone. Roughly 48% of all businesses are looking to connect and convert customers with mobile apps. But many companies still struggle to make their apps more effective at boosting sales and engagement.
Luckily, there are some simple steps you can take to improve your mobile app conversions. In this guide, we'll cover best practices for improving your app's performance and provide mobile app conversion benchmarks for measuring success.
Ready? Let's dive in!
What is mobile app conversion rate?
The mobile app conversion rate is a KPI that reports on what percentage of your end users took a desirable action on your app.
The importance of conversion rates lies in how they reflect the overall effectiveness of your app—as well as the product and marketing strategies behind it. The higher your mobile app conversion rate, the more successful your app is likely to be.
What is a good conversion rate for mobile apps in 2026?
Most mobile apps see install-to-purchase conversion rates between 1% and 2%, though this varies significantly by industry. Here's how two key verticals compare:
Retail apps: 1.38% install-to-purchase rate (Source: UXCam data)
Travel apps: 2.41% install-to-purchase rate (Source: UXCam data)
Mobile app conversion rate benchmarks
We researched the most recent conversion rate stats for mobile apps. The data was collected from a variety of sources, including surveys and studies.


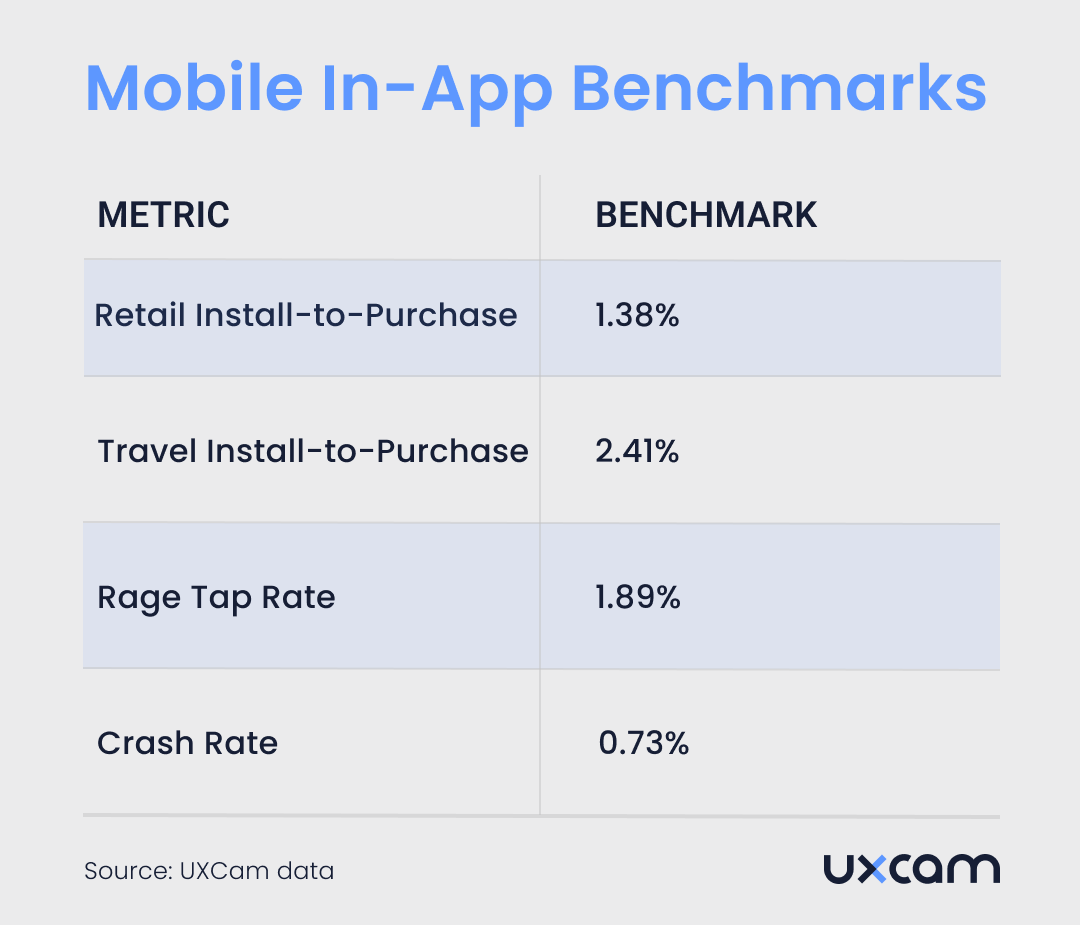
Beyond install-to-purchase rates, two often-overlooked metrics can quietly erode your in-app conversions: rage taps and crashes. Rage taps occur when a user repeatedly taps on an area of the screen out of frustration, typically because they expect something to happen and it doesn't.
Using UXCam's rage tap analytics across a randomized sample of 670,478 sessions spanning 87 established apps, 1.89% of sessions contained rage gestures on average (Source: UXCam data). You can track rage taps with UXCam here.
Crashes are another conversion killer. In that same sample, 0.73% of sessions ended in a crash (Source: UXCam data).


App Store conversion rate benchmarks
Your App Store conversion rate is the percentage of people who view your app listing and then download or redownload your app. It's an important metric to track because it tells you how effective your app store listing is at convincing people to install your app. What is a good app store conversion rate?
According to the most recent available data, the average mobile app conversion rate across both app stores is as follows:
Page View to Install Conversion Rate (App Store): 33.7%
Page View to Install Conversion Rate (Google Play): 26.4%
Impression to Install Conversion Rate (App Store): 3.6%
Don't put too much stock in these industry averages, though—average conversion rates are highly dependent on factors like genre and niche.
Mobile app retention rate benchmarks
Here are benchmarks for average app user retention rates by industry:
| Mobile App Industry | Retention Rate on Day 30 |
|---|---|
| News | 11.3% |
| Business | 5.1% |
| Shopping | 5% |
| Finance | 4.6% |
| Music | 3.8% |
| Food & Drink | 3.7% |
| Health & Fitness | 3.7% |
| Lifestyle | 3.6% |
| Productivity | 3.2% |
| Video players | 3.1% |
| Entertainment | 3% |
| Travel | 3% |
| Social | 2.8% |
| Utilities | 2.6% |
| Gaming | 2.4% |
| Education | 2.1% |
| Photography | 1.5% |
Source: Statista
Types of mobile app conversions
Since there are usually a bunch of “desirable actions” app developers care about, there are also a plethora of different mobile app conversions.
Here are three of the most common:
App Store Conversion Rate: When people talk about conversion rates in the context of mobile apps, they usually refer to the percentage of visitors that install your app after viewing its dedicated page in the app store.
In-App Conversion Rate: This is the percentage of users that take some desirable action within the app after installing it. It could be subscribing to a service, making an in-app purchase, or completing a tutorial.
Advertising Conversion Rate: This is the percentage of users that install your app after clicking on an advertisement.
Why should you measure mobile app conversion rates?
To answer this question simply—because it's the best way to get a baseline understanding of how your app and its marketing assets are performing with end users.
That said, there are a few more specific reasons you should be measuring your app's conversion rate:
Lower customer acquisition cost (CAC)
The more you can increase the percentage of users you convert (at any stage of their journey), the lower your CAC.
To see this effect in action, look no further than Placemakers. The Placemakers team noticed a decrease in the in-app conversion rate so dramatically that it would eventually double their required acquisition spend. They used UXCam's Session Replay and Heatmap features to look for the cause and realized that a single label they were using to tag temporarily unavailable products was tanking conversions.


A quick UI adjustment didn't just solve the problem—it doubled the company's sales.
Better UX and product insights
Finally, you can use conversion rates to identify which product or UX changes have the most significant impact.
This is especially true when you use a tool like UXCam to get a granular view of user behavior within your app’s funnel. You can pinpoint the exact features, screens, and products where users are most likely to drop off—or convert.


How to increase app conversion rate
Boosting your app's conversion rate can lead to increased revenue and customer satisfaction. To improve your mobile app's conversion rate, consider factors such as user experience, user acquisition, and customer engagement.
1. Make your app easy to install and set up
People are generally pretty lazy when it comes to downloading and setting up mobile apps—the smallest obstacles can be enough to make them abandon the process entirely. You must ensure that your app is quick to install and easy to set up.
You don't have any control over the app store installation process. But once users land in your app, you can make sure that the setup process—sign-up, permissions, onboarding, and tutorial—is quick and painless.
Here are some simple ways to make it easier:
Visualize the onboarding process. Progress bars, checklists, and other visuals can help users quickly grasp what's required to finish the setup process. You can also gamify the onboarding process to make it more engaging.
Minimize permission requests. Only ask for the permissions you need, and make sure to explain why each one is necessary.
Take users to the correct setting. If your setup process involves changing settings, link to them directly from your app.
2. Write compelling app descriptions
Your app's description in the app store is one of its most important sales pitches—especially when it comes to converting app store browsers who’re discovering your app for the first time.
Both the App Store and Google Play give you 4,000 characters to work with for the long app description. That's a fairly generous amount of space—use it wisely!
Here are a few best practices for optimizing this important real estate:
Avoid walls of text. Bulleted lists are a great way to make information-dense descriptions more skimmable.
Include keywords. You want to ensure that browsers searching for apps like yours can easily find it.
Connect features with benefits. People want to know how your app will make their life easier, so explain in clear terms how the features you've built can help them.
3. Optimize your app for first impressions
Data shows that roughly 25% of app installs only lead to a single session. To translate, a huge percentage of your users may be opening your app once and never coming back.
The solution to this problem is simple—seize the small window of time you have to make a great first impression by optimizing your onboarding process.
To do this, you should:
Use A/B testing. Systematically test different onboarding flows and messaging to boost conversions.
Highlight value-adds upfront. Introduce users to your most important (and valuable) features as quickly as possible.
Analyze new user sessions. Use UXCam's Session Replays to get a better look at how users are engaging with your app, so you can identify and address any drop-off points for new users.


4. Keep mobile UI/UX simple
When it comes to mobile user interfaces, less is (almost) always more. Not only are maximalist UIs out of fashion with app users, but they’re also much harder to get right.
Minimal UI design means fewer opportunities for users to get confused or sidetracked. Your app should be intuitive and self-explanatory, with clear pathways for users to take. And your navigation should get users to their destination as quickly and directly as possible.
Here are a few best practices for simplifying your UX and UI:
Include whitespace. Cluttered apps are visually overwhelming, and they can make users hesitant to interact.
Focus on clarity. Labels, buttons, and pathways should all be as clear and straightforward as possible.
Test your app. Regularly run tests to measure UX factors like user flow, and loading speed.
5. Optimize loading and processing speeds
Mobile users hate waiting—research shows that 53% will abandon a search if they’re forced to wait more than three seconds for a page to load. This need for quick loading applies to your app, too.
Optimizing loading and processing speeds increases your conversion rate by reducing the number of users who drop off due to frustration. And as a bonus, you're also increasing overall user satisfaction.
Here are a few tips for optimizing app speed:
Reduce unnecessary animations. Animations can be fun, but they also take up resources.
Compress image sizes. Larger images take longer to load, so compress them before you upload them.
Reduce the number of API calls. Every API call takes valuable time, so make sure you're only using the necessary ones.
6. Actively manage ratings and reviews
Ratings and reviews can have a massive effect on your app's conversion rate.
For starters, they're one of the top ranking factors that the App Store and Google Play use to decide which apps to promote. Plus, users look to ratings (and reviews, to a lesser extent) when deciding which apps to install.
Some best practices for managing your app’s ratings and reviews include:
Aim for 4.1-4.9 stars. A rating under 4 stars is a red flag for many users. Ratings between 4.1 and 4.9 are the sweet spot.
Direct feedback strategically. You want positive feedback to end up in app stores and negative feedback to stay in-house—use in-app prompts to make this happen.
Respond to feedback. Negative reviews are an opportunity to show users how much you care about their experience by responding promptly and thoughtfully.
7. Choose metrics and KPIs to track
Tracking as much as possible is important, but it's just as important to make sure you're tracking the right things.
Your product team should agree on key metrics and KPIs that will give you actionable insights into user behavior. This could be anything from average install time to the number of daily active users.


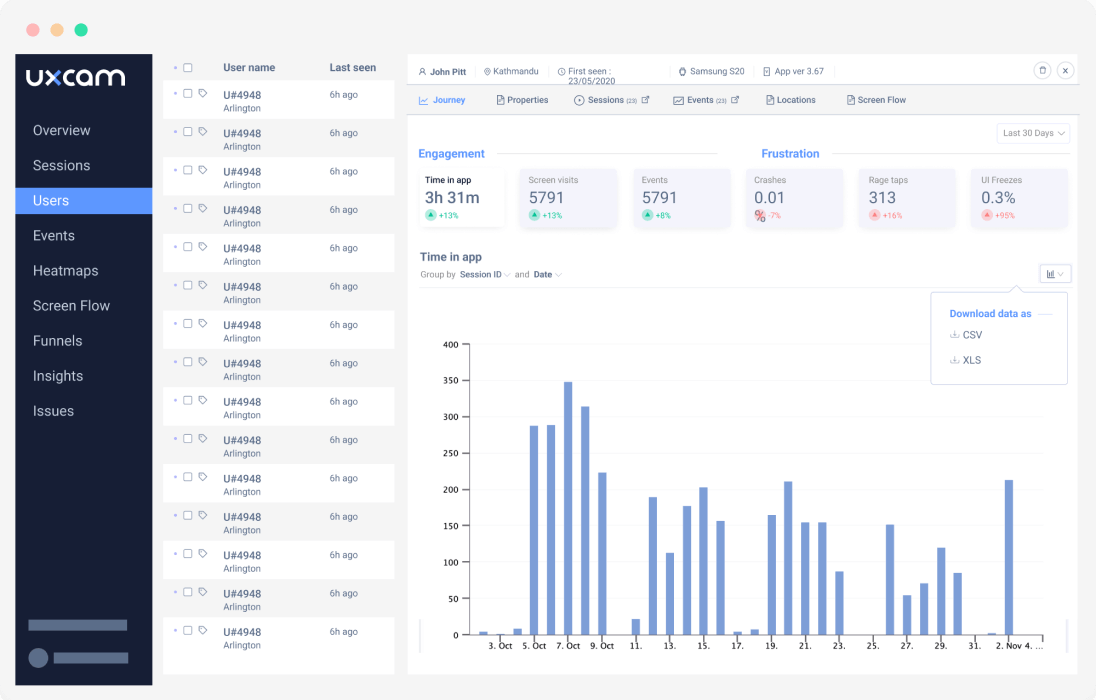
UXCam's suite of tools can help you monitor key performance indicators like engagement and funnel drop-off rates. UXCam users can also use Session Replays and Heatmaps to gain a micro view of how users engage with their applications.
By tracking the right metrics, you'll be able to identify trends and pinpoint areas for improvement. This will help you optimize your app for higher conversions—and better user experiences.
Use UXCam for Mobile App CRO
Believe it or not, there is a straightforward methodology to increase your conversion rates. For many product managers, the biggest bottleneck is the arduous process of setting up events and a conversion funnel.
In the following steps, we’ll show you how to save months, days, and hours on your conversion rate analysis. With the right tools, you’ll be able to easily identify opportunities for higher conversion and track your progress.
Step 1: Define conversion goals and events
Begin by clearly defining your conversion goals. Consider the specific actions or events you want to track as conversions within your mobile app. Refer back to our section ‘CRO by industry’ to understand what’s important to your organization. Some examples of conversion events include:
User registration/sign-up: Encourage users to create accounts or sign up, enabling data collection and personalization of their experience.
In-app purchases: Drive revenue by tracking conversions related to the purchase of products or subscriptions.
Level or content completion: For gaming or educational apps, track user progress by counting completed levels or chapters.
Step 2: Set up your events and name screens
Requesting and waiting for engineers to implement your events is by far the biggest bottleneck in setting up tracking for conversion rate optimization. Fortunately, there are 3 ways to cut down on time on this step.
1. UXCam’s no-code, Smart Events enables product managers to click-to-add events without support from engineers. With Smart Events you can:
Capture events directly from your app without coding
Create events from gestures and UI elements in session replays
Analyze user behavior with these events
Currently available for native frameworks, Smart Events are based on user gestures such as taps and long-presses and you can create them directly within session replays, making event tracking more efficient and accessible. For more granular event properties, you can still use coded events.
2. Autocaptured screens and gestures: To make setup even easier, screen names, user, device, and crash data are all automatically collected when you install the UXCam SDK. Screens are automatically collected so you can start building conversion funnels from day one, and you can freely rename your screens from the Sessions list.
3. Segment integration: If you use Segment for event tracking and data collection, you can send events to be analyzed in UXCams. This integration automates the transmission of screen names, events with properties, and user properties from Segment to UXCam, enhancing the depth of analysis for user interactions.
Step 3: Map out user paths
Mapping out the most common routes to conversion helps you spot issues and areas for improvement. But as you know, there could be various routes a user can take from the initial interaction with the app to, say, completing a purchase. Fortunately, identifying conversion journeys can go from days to minutes with UXCam’s Screen Flows and Funnel Suggestions.


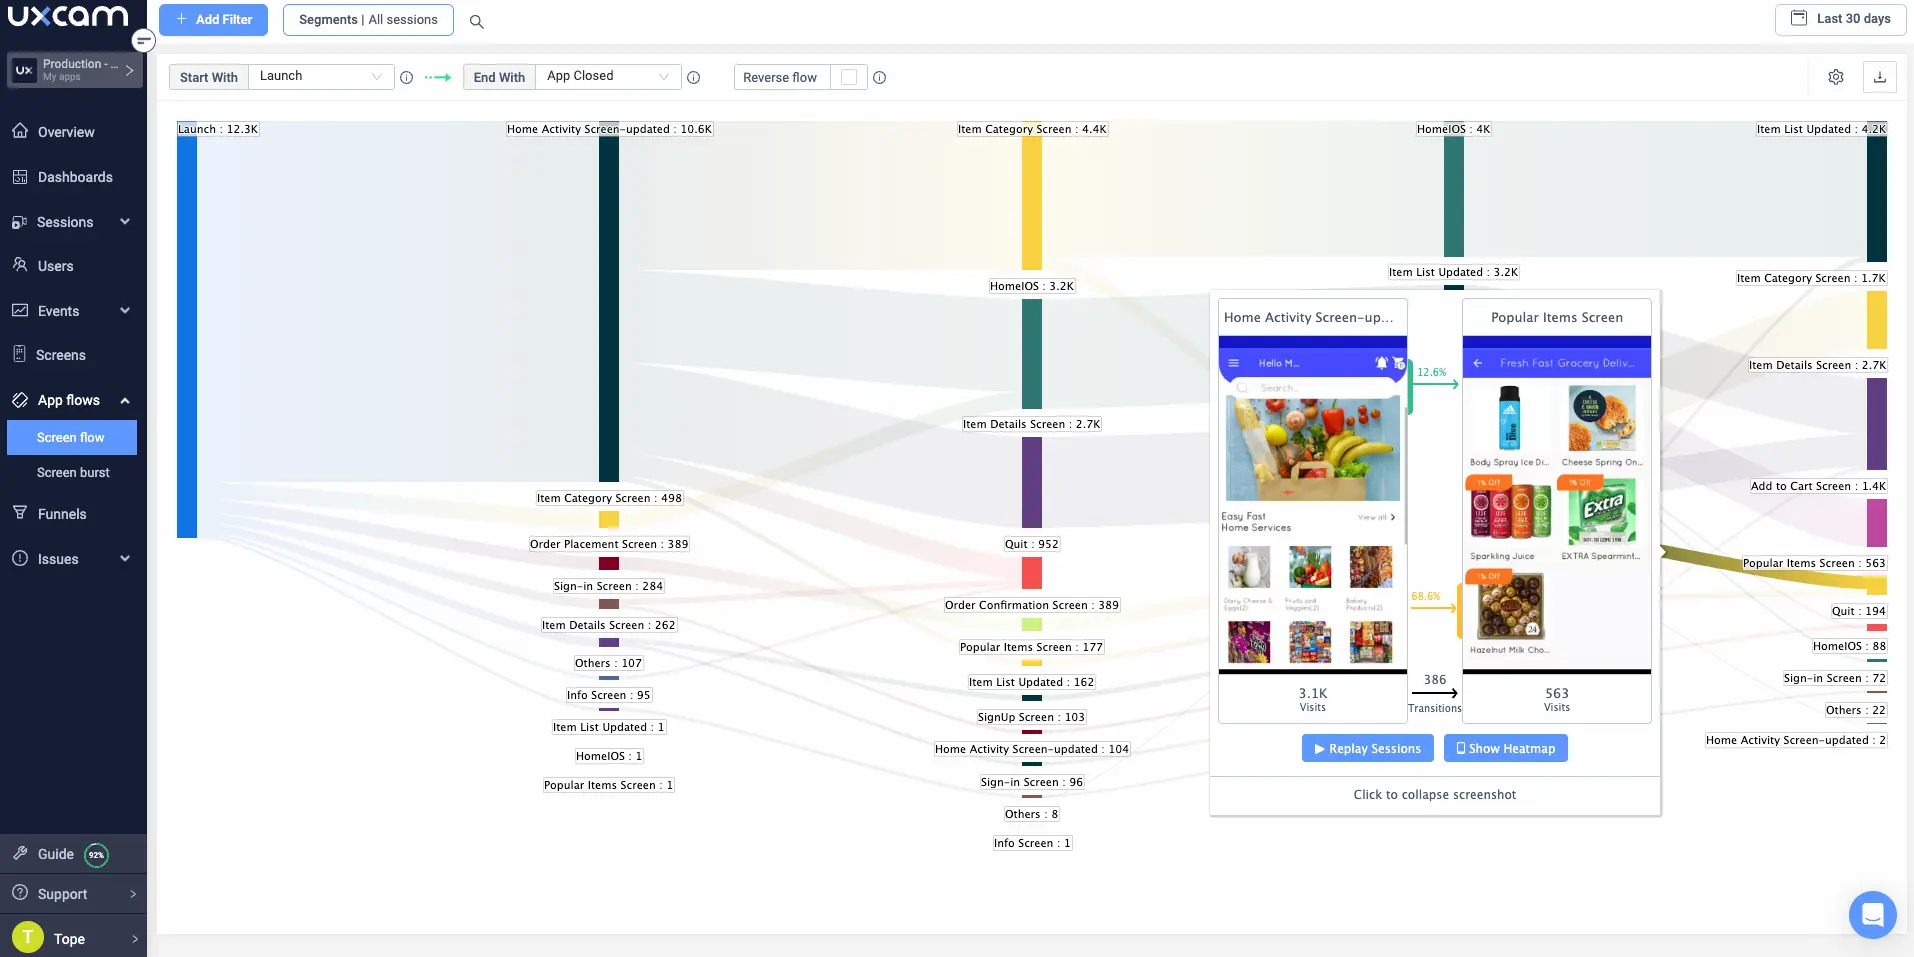
Getting a birds-eye view
To start brainstorming the big picture of user journeys, Screen Flows presents a big-picture visual representation of the paths users take as they move through the app, showing the order and connections between screens. Just set your start and conversion screen or event (e.g. from App Launch to Checkout). To get quick insights, hover over each path to click into the session replays and heatmaps in those steps.
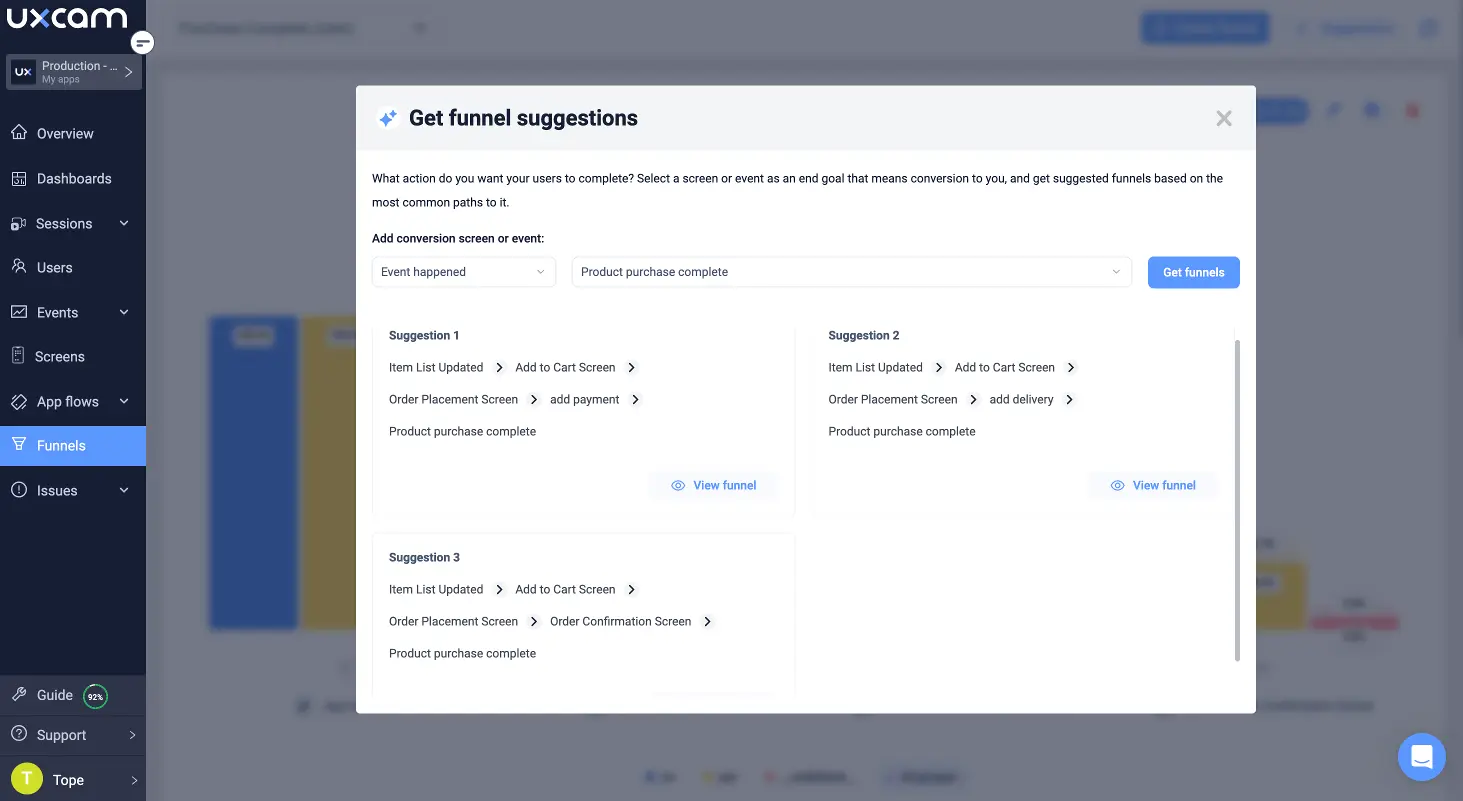
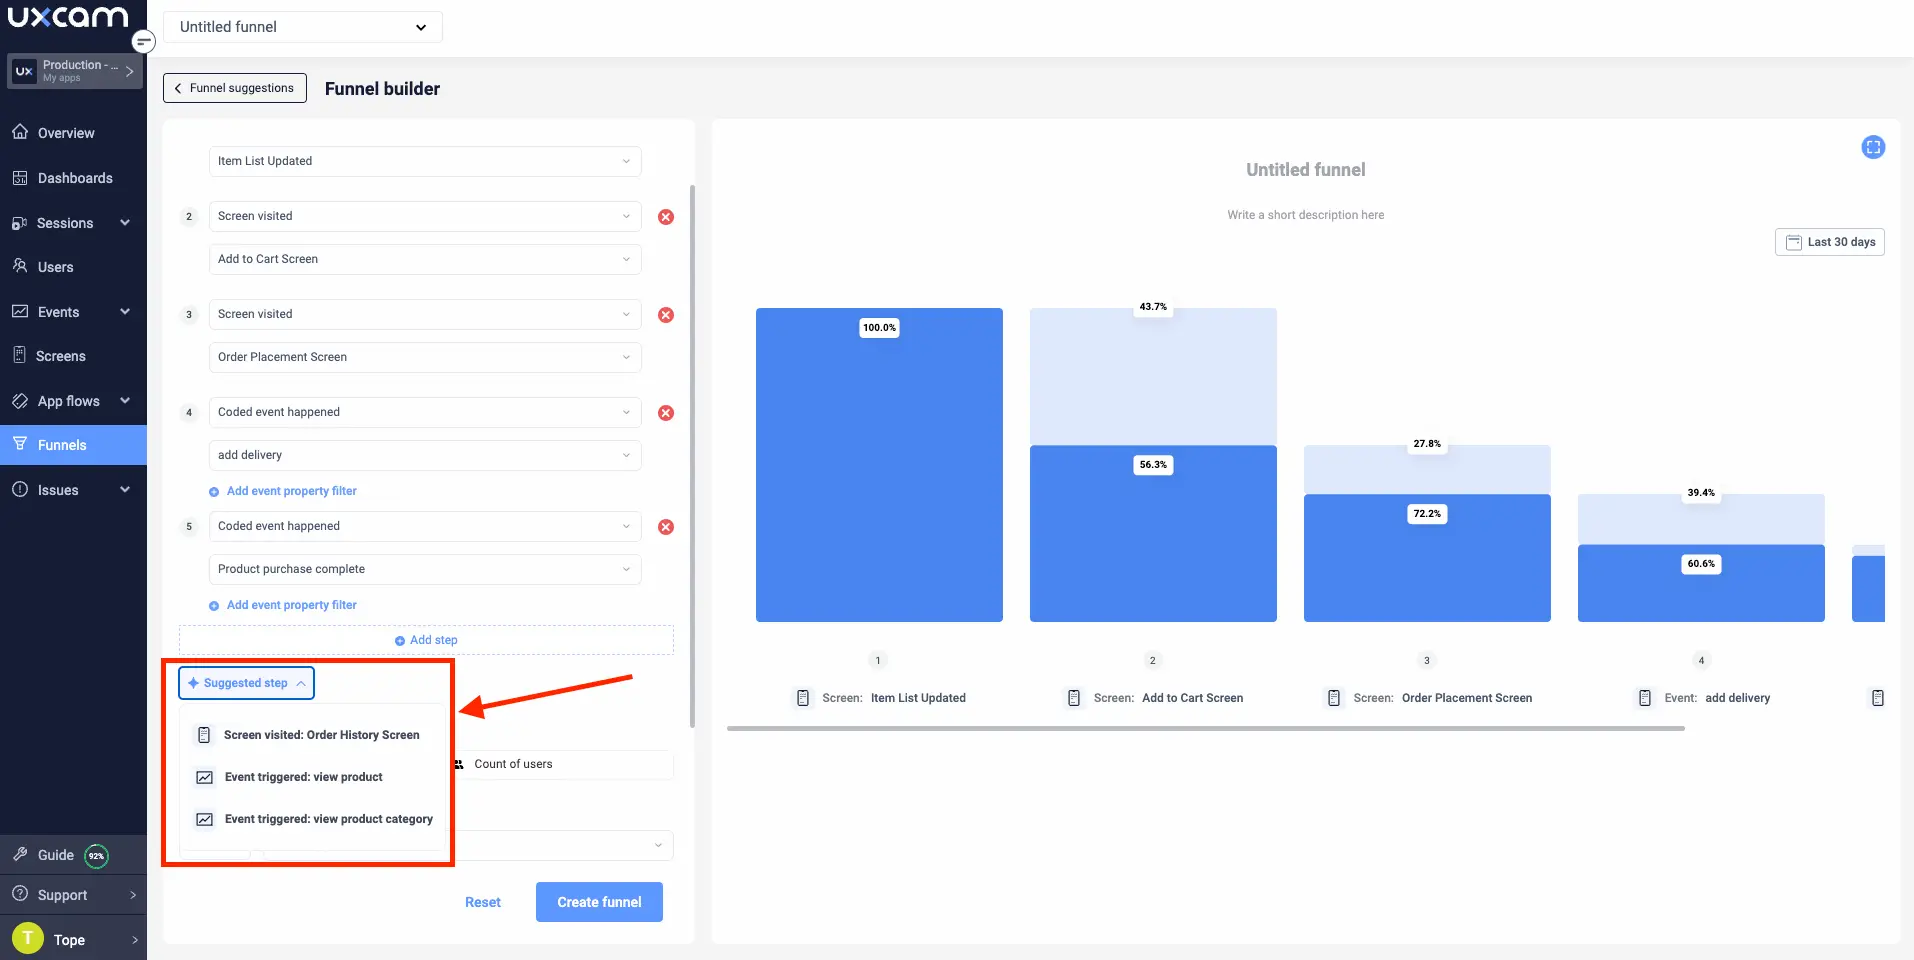
A little help from AI
To speed up mapping out the user paths and uncover unexpected behavior patterns, UXCam’s Funnel Suggestions leverages AI to recommend the next steps or actions within a conversion funnel for a mobile app. Once you input your conversion event or screen, the tool suggests the most probable and effective user paths to your goal.
UXCam’s powerful AI can reveal unexpected user behavior patterns that deviate from the traditional or assumed paths. This insight can lead to the discovery of new, potentially more efficient user journeys that can be optimized for better conversions.


Step 4: Build your funnels
Validating funnels
Now you have the building blocks of your funnel, it's time to validate it. There’s nothing worse than a leaky funnel.
The Funnel Suggestions tool has done its part but relying solely on hard-coded events can lead to data issues. What kind of data issues? Well, some events may only be on iOS but not on Android. Not to mention, app updates or redesigns can render previous event tracking outdated or inaccurate.
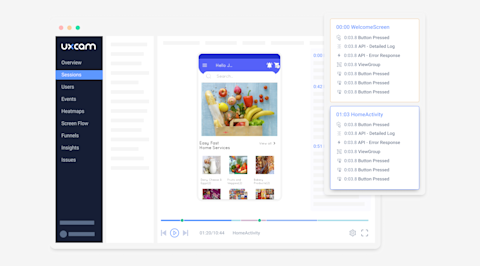
To check the integrity of your funnels, watch 6-7 session replay videos to validate whether the journeys and events are correct. As you watch the sessions, check that users aren't going around the funnel and behaving in different ways than you have expected. Analyze both sessions where users drop off from the conversion path and sessions where users successfully convert. You can double-check the events on the right-hand panel of session replays.


Once you’ve refined your funnels from the session replay findings, you can use the AI-powered Next Step Funnel Suggestions. Suggestions are based on data collected from user's past actions and behaviors within the app, helping to tailor the suggested actions to what has historically led to successful conversions.
Whenever you tweak your funnel, you can periodically go back to the Funnel Suggestions in the funnel builder and check if our AI recommends a new step for existing funnels. This way you are constantly validating your funnel as you continue to optimize the steps.


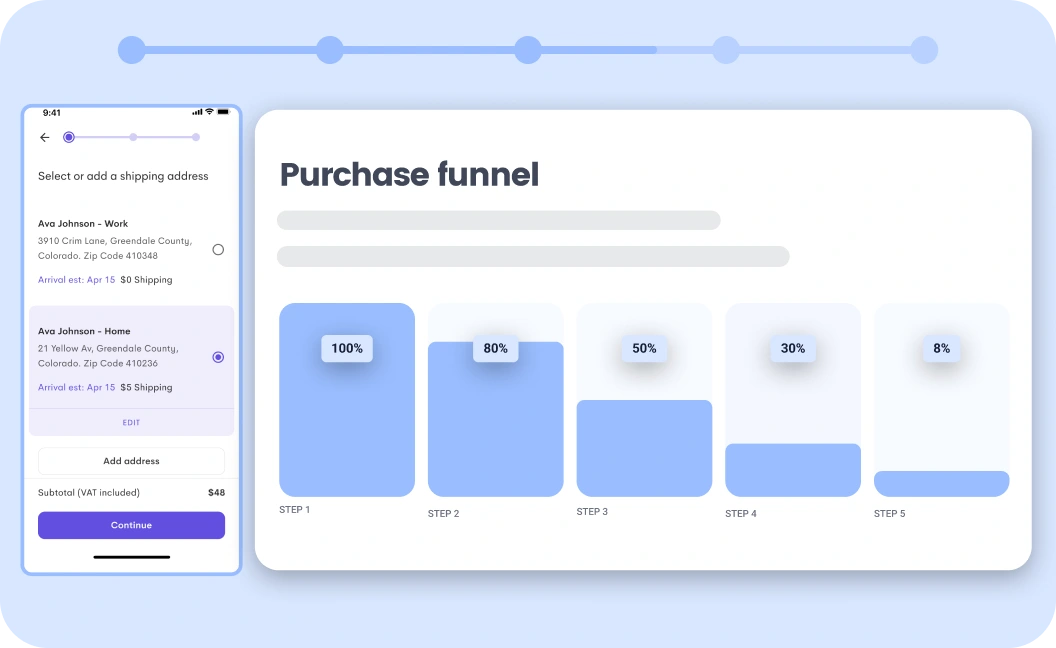
Step 5: Analyzing drop-off rates
So, how much drop-off is normal? How much is raising alarm bells? The range of install-to-purchase conversion rates usually ranges from 1-2%. Here are benchmarks by industry:
Retail apps install to purchase conversion rate: 1.38%
Travel apps install to purchase conversion rate: 2.41%
Source: UXCam data
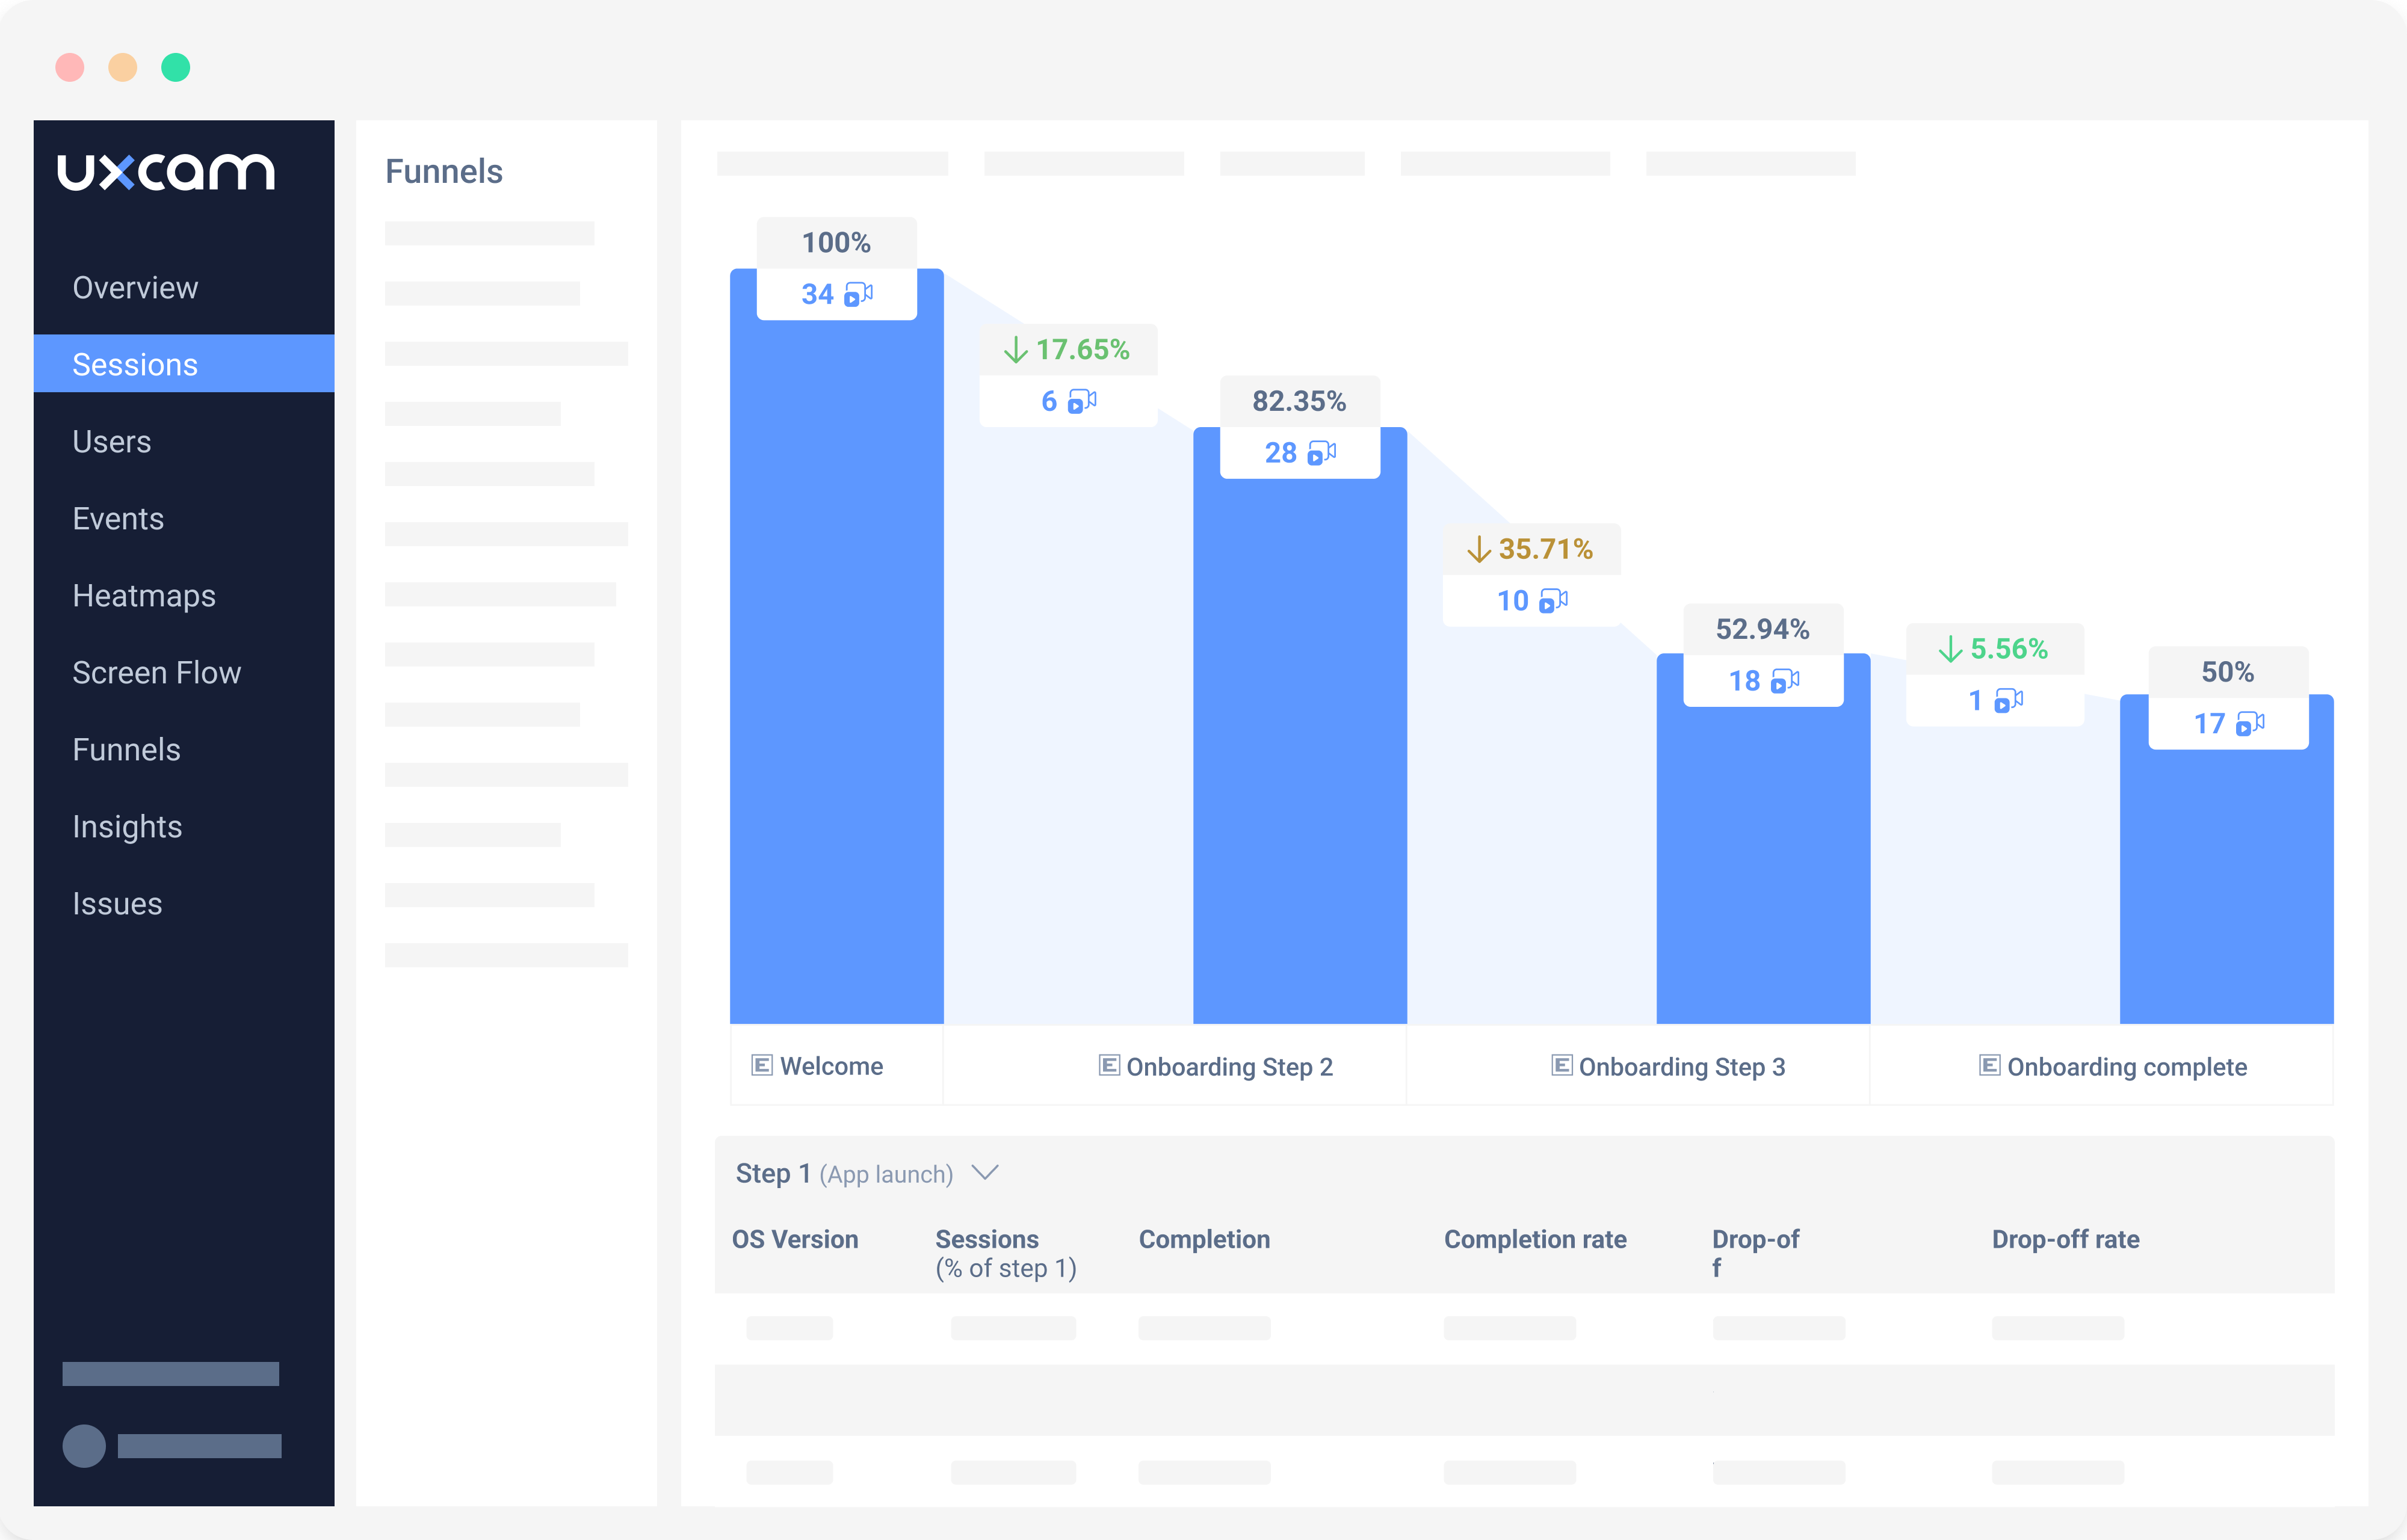
If you’re using UXCam funnels, you can hover over the percentage of users dropping off at each stage of the conversion funnel and notice which stages users seem to be encountering hurdles. Drop-offs can be caused by a variety of reasons like:
Lengthy forms during sign-up that deter users.
Confusing navigation or unclear call-to-action buttons.
Unexpected errors or technical issues.
Complex or time-consuming actions are required from the user.
Step 6: Segmenting drop-offs
Segmentation and grouping help identify and target specific user groups, optimizing strategies to increase the likelihood of successful conversions for each segment.
Segment and group funnel
But what’s the difference between grouping and segmentation?
Grouping is a simpler method of categorization than segmenting and typically involves sorting data based on predefined parameters without necessarily considering the heterogeneity within each group. Segmentation is more sophisticated and involves a deeper analysis to identify distinct, meaningful subgroups based on specific characteristics or behaviors.
Ideas for grouping:
Engagement levels: High-engagement users (spend a significant time within the app) vs. Low-engagement users (minimal interaction within the app)
Subscription Level Grouping:
Free users (using the app without a subscription)
Basic plan subscribers
Premium plan subscribers
Usage-based Grouping:
New users (first-time app users)
Returning users (those who have used the app before)
Inactive users (haven't used the app in a defined period)
Ideas for segmentation:
Frequency of Use: Categorizing users based on how often they use the app, providing insights into the engagement levels and habits of different user groups.
Device or App Version: Creating segments based on the type of device (iOS, Android) or the app version users are using to uncover variations in user experiences.
Conversion Pattern: Dividing users based on their conversion patterns, such as those who completed a conversion, dropped off at a specific step, or followed a particular path.
Step 7: Analyzing drop-offs
Now you know the what and the who of drop-offs, now it’s time to investigate the why. If you’re using UXCam funnels, you can click into the drop-offs and begin filtering through sessions to watch the behavior of why users fell off.
When you get to sessions, filter for UX / UI or technical issues to shortlist the number of videos you need to watch. Use the quick or custom filters and root out sessions with high numbers of crashes, rage taps, and unresponsive gestures. Once you have a list that has a significant number of users with a common drop-off problem, watch 3-4 sessions.
As you watch the sessions, use labels to categorize reasons for the issues. Say you are looking at drop-offs in a KYC process, you can start gathering reasons, such as failing to upload documents, bad light, or loading issues.
From there, you can understand which of those issues has the highest number of problems. As you discover new things you want to track, Smart Events can also be used here to mark some additional events and quantify them, such as every time a user saw an error window that stated their photo couldn’t be uploaded.


Step 8: Analyzing problem sessions and screens
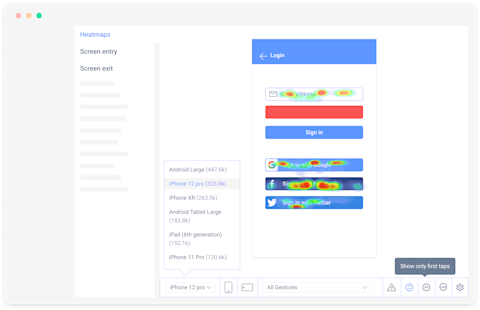
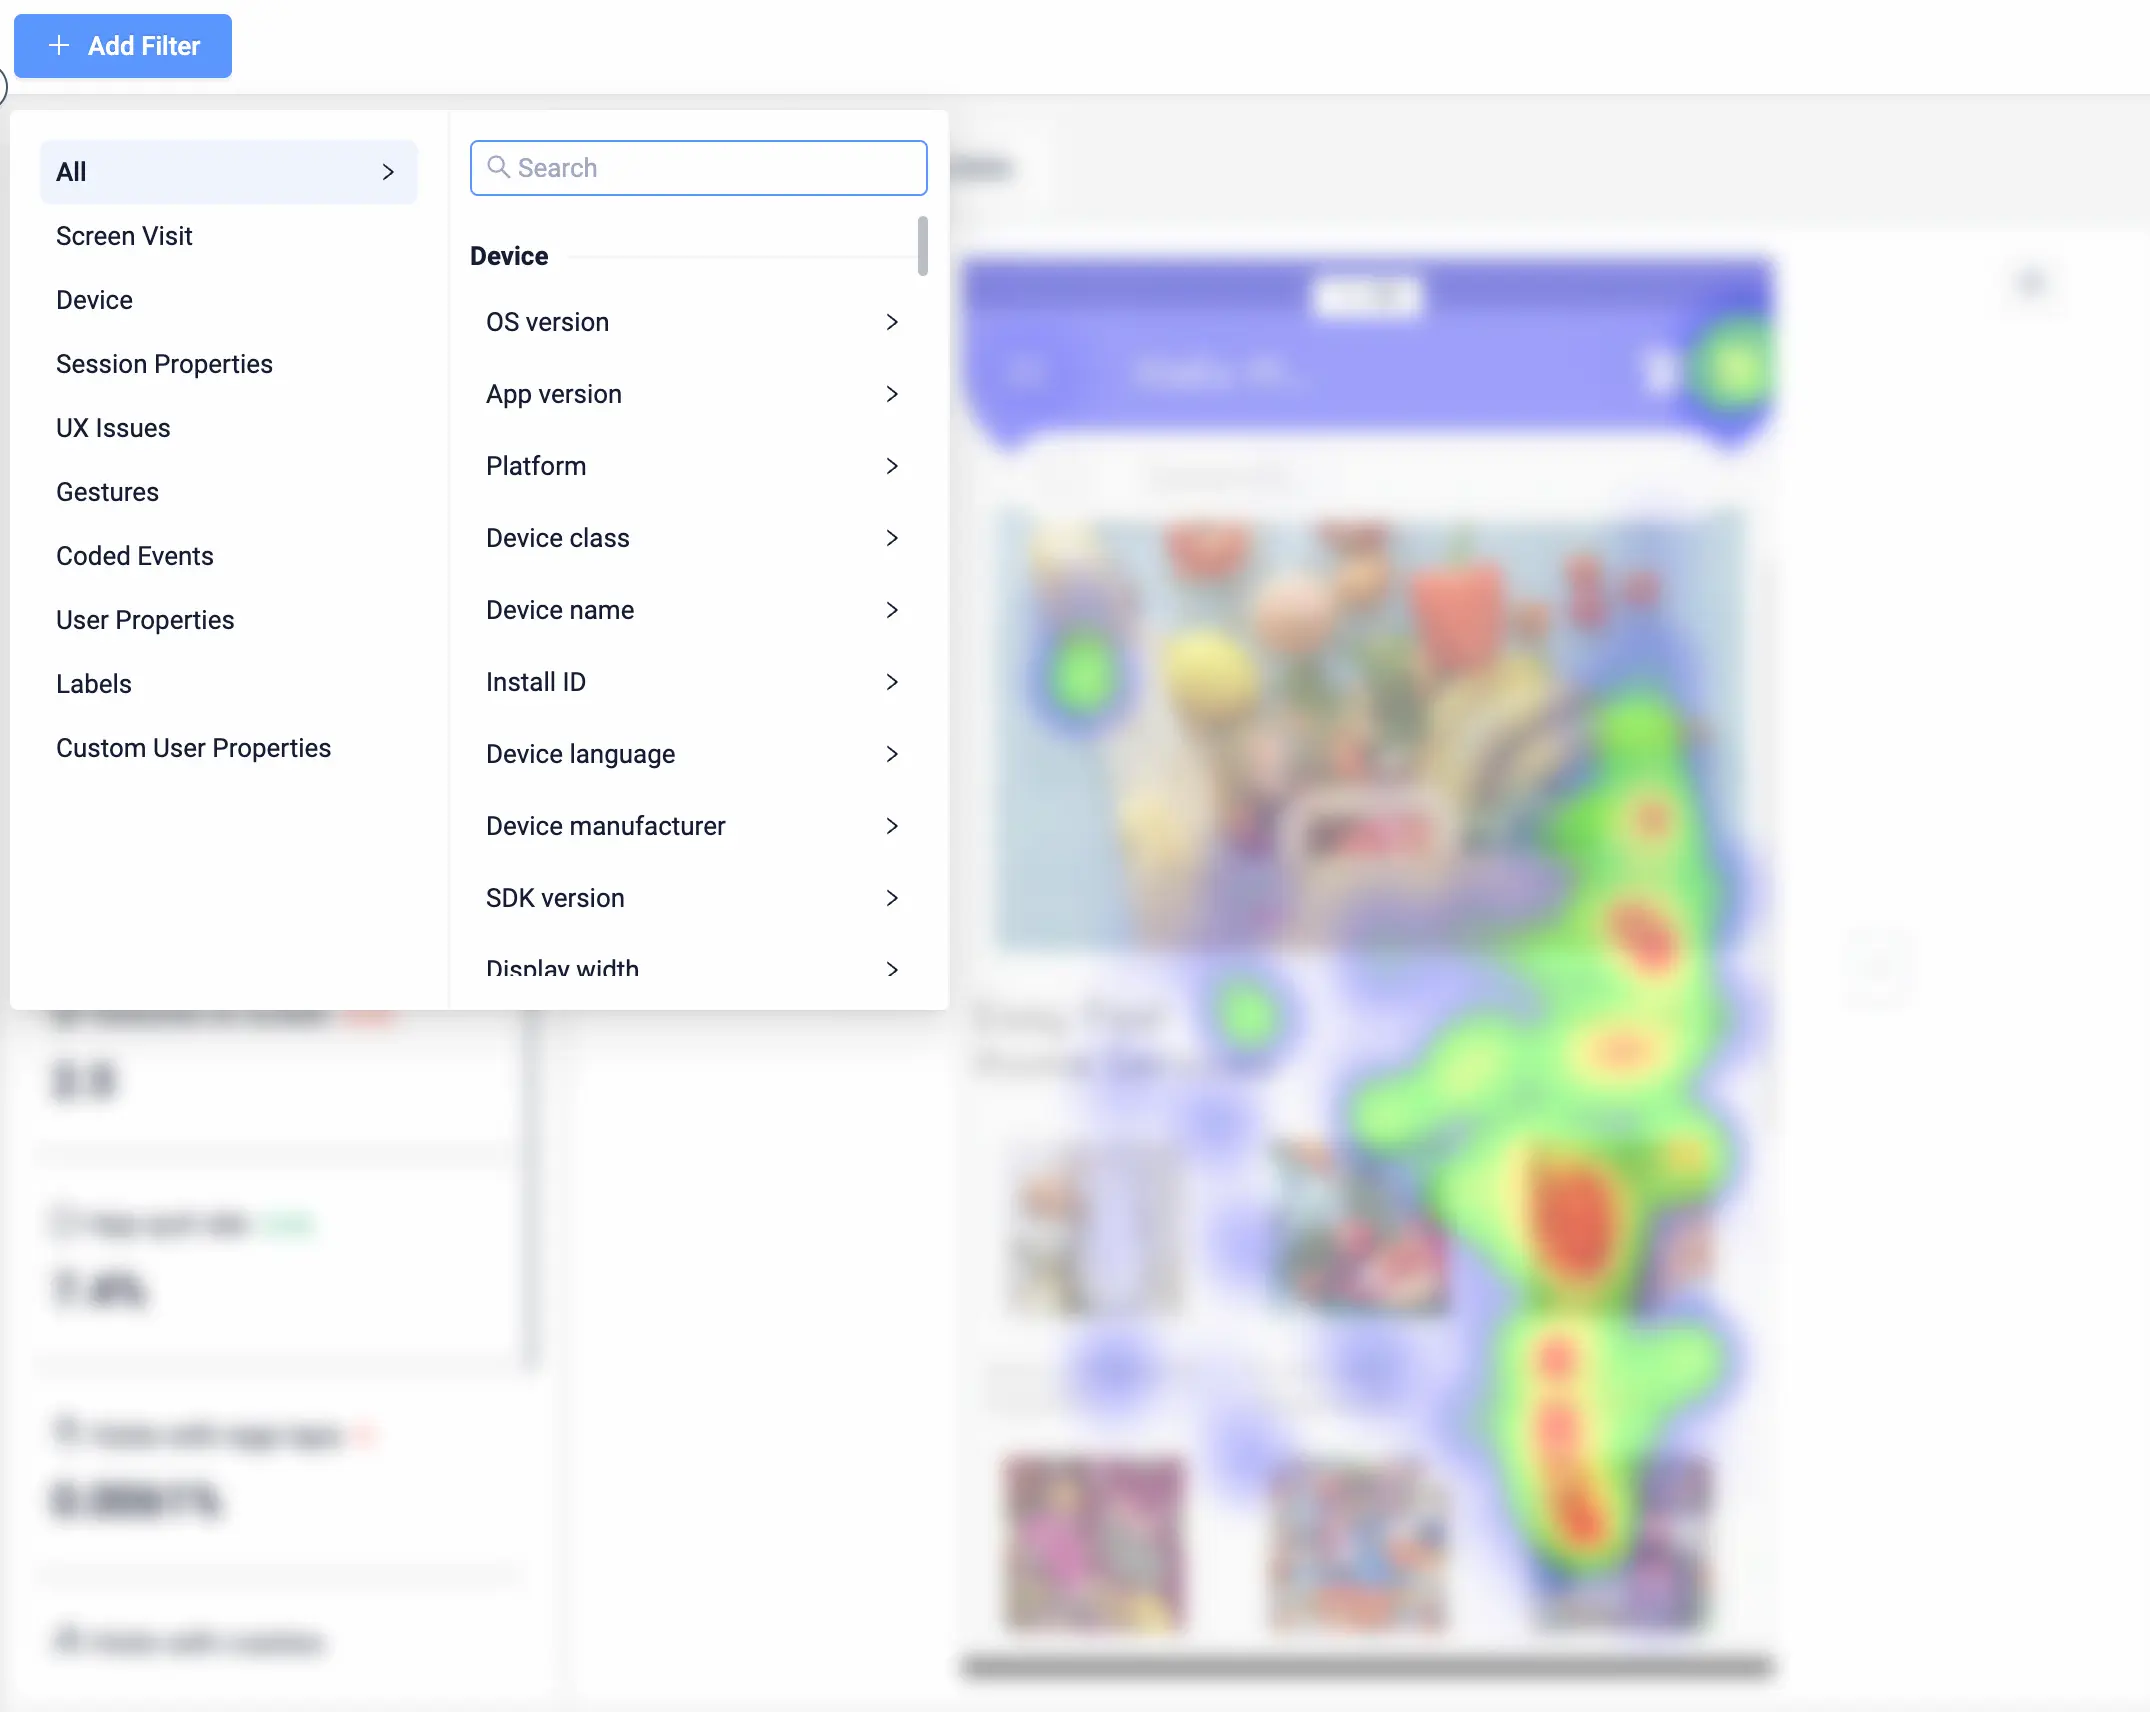
From the list of sessions, you can dive deeper with heatmaps to validate the potential reasons for users leaving the app mid-conversion. Let’s say you’re analyzing sessions from a drop between the checkout page and the payment completed page.
Play 3 sessions and find that all 3 sessions had an issue where users were clicking on the credit card option, but the field to enter the number was disabled and not working.
Click into the corresponding heatmap using the screen name icon in the session replay
Filter your heatmaps by unresponsive gestures or rage taps to see how common this behavior is.
If you see that the rage taps are relatively high, you’ve likely found your problem. If not, keep searching


If you’re running A/B tests, you can send your experiment key or Test ID to UXCam as a user property e.g. Checkout_recommendation_carrousel, and use control/variant as a value. This way you’ll be able to filter out these properties everywhere on UXCam and see different versions of your screens on heatmaps or session replays.
Step 9: Monitor the impact of changes
In the highlights bar on the funnels page, you’ll be able to easily see your total conversions and average time to conversion By adjusting the date range, you’ll be able to see improvements in your conversions over time.
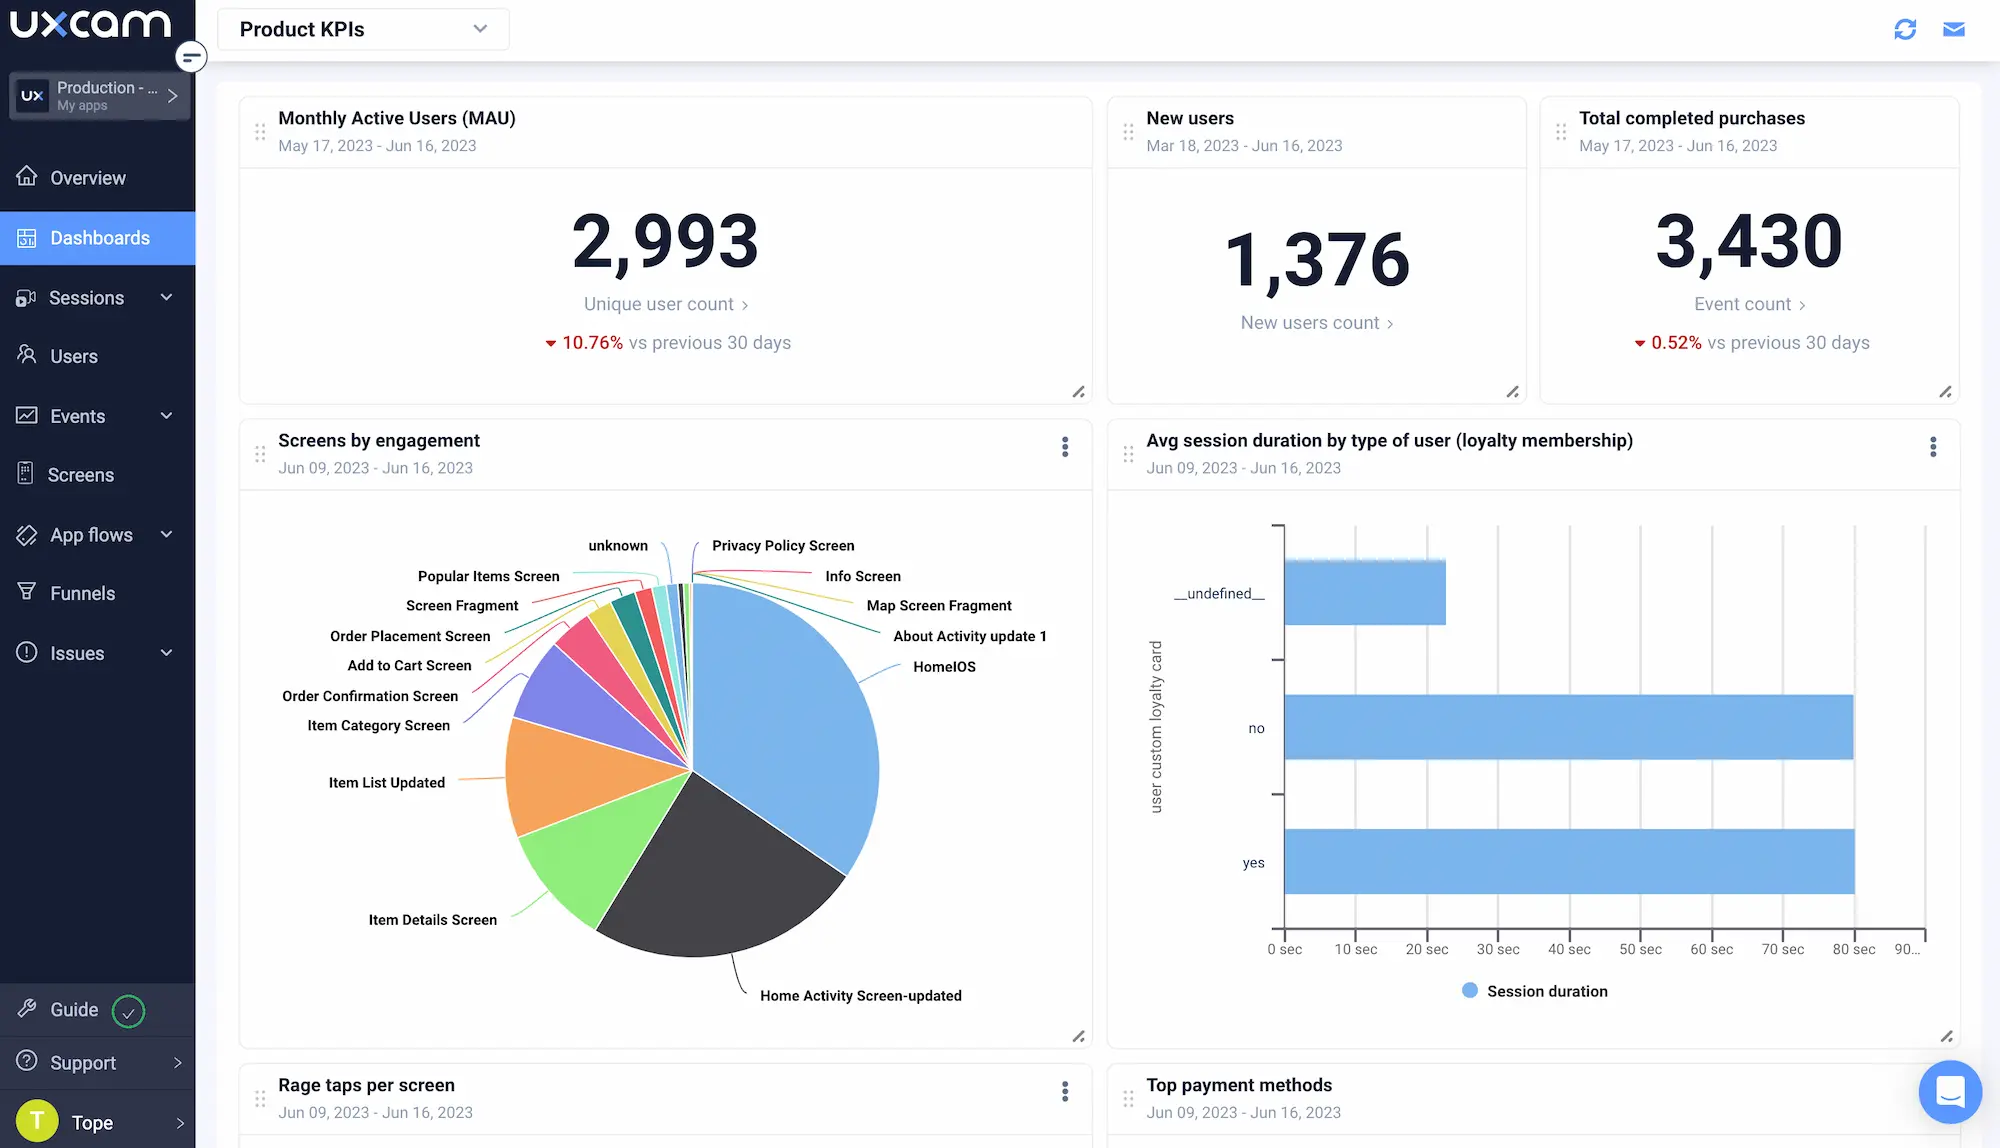
You can also set up a dashboard to track your conversion events over time. Either set up a report from scratch or use a pre-built one and adjust the parameters. Dashboards make it easier to share your progress with internal and external stakeholders.


Conclusion - Improve app conversion rate
A sub-par mobile app conversion rate can be incredibly frustrating. Mobile app development is a complicated, time-consuming process,
A sub-par mobile app conversion rate can be incredibly frustrating. It's important to remember that it isn't a lost cause. By following the simple steps outlined above, you can make your app more user-friendly and increase conversions.
At UXCam, we provide powerful tools that give you access to the data you need to optimize your app's conversion rate and user experience. Our Session Replays and Heatmaps let you see how users interact with your app on a micro level—so you can identify areas for improvement and fine-tune your app to cater to user needs.
So, if you're looking for a way to supercharge your app conversions, give UXCam a try with a 14-day free trial. You might also be interested in these;
How to analyze session recordings
Say hello to new funnels: Analyzing app conversion rates just got easier
Mobile app engagement benchmarks - how to measure success


TABLE OF CONTENTS
- What is mobile app conversion rate?
- What is a good conversion rate for mobile apps in 2026?
- Mobile app conversion rate benchmarks
- App Store conversion rate benchmarks
- Mobile app retention rate benchmarks
- Types of mobile app conversions
- Why should you measure mobile app conversion rates?
- How to increase app conversion rate
- Use UXCam for Mobile App CRO
- Conclusion - Improve app conversion rate


Related articles


Conversion Analysis
React Native Crash Reporting + Best Tools and Techniques
Learn how to improve your mobile app's stability with effective React Native crash reporting. Explore the top techniques and tools for monitoring and managing...


Tope Longe
Product Analytics Expert


Conversion Analysis
Flutter Performance Monitoring - Best Tools and Techniques
In this article, we'll introduce you to the top Flutter performance monitoring tools and demonstrate how UXCam can help you monitor your app's performance with...
Tope Longe
Product Analytics Expert


Conversion Analysis
How to measure, analyze, and reduce app churn
All the user acquisition in the world won't matter if you've got a high churn rate on your app. If you want to know why users are uninstalling or unsubscribing, tools like screen flow, heatmaps, and screen recordings can get users loving — instead of leaving your...
Tope Longe
Product Analytics Expert