Top 19 Mobile App Analytics Tools in 2025
PUBLISHED
2 January, 2025

Growth Lead

With so many mobile app analytics tools competing for a place in your tech stack, finding the right fit can be daunting.
According to a Harvard Business Review study, researchers found that “businesses that integrate multiple sources of customer data significantly outperform other companies.”
Best Mobile App Analytics Software and Tools
That's why it’s time for a detailed comparison of the best mobile analytics tools on the market today. We did extensive research to find the list of 18 best app analytics tools and software to help you choose the right solution for your mobile app.
Quick Summary - Mobile analytics tools
Here's our pick of the 6 best mobile app analytics tools:
UXCam - Best for mobile product analytics
Firebase Analytics - Best for free mobile analytics
Mixpanel - Best for event-based mobile analytics
Userpilot - Best for in-app engagement insights to drive adoption
Amplitude Analytics - Best for predictive mobile analytics
AppsFlyer - Best for marketing mobile analytics
Comparison Chart: Top Mobile App Analytics Software and Tools
| Mobile Analytics Tool | Best For | Website |
|---|---|---|
| UXCam | Product analytics with session replay & heatmaps | uxcam.com |
| Firebase (Google Analytics for Mobile) | Free mobile analytics | firebase.google.com |
| Apple App Analytics | In-depth iOS app analytics | developer.apple.com |
| Mixpanel | User interaction and retention | mixpanel.com |
| Userpilot | Product adoption | userpilot.com |
| Amplitude | Product intelligence | amplitude.com |
| Countly | Self-hosted analytics | count.ly |
| Adobe Analytics | Enterprise-level analytics | adobe.com |
| Glassbox | Mobile app experience analytics | glassbox.com |
| Upland Localytics | Mobile marketing automation | uplandsoftware.com |
| Contentsquare | Experience analytics platform | contentsquare.com |
| App Radar | App store optimization | appradar.com |
| AppsFlyer | Mobile attribution and marketing analytics | appsflyer.com |
| Survicate | Surveys and feedback | survicate.com |
| Singular | Unified marketing data | singular.net |
| Adjust | Mobile measurement and fraud prevention | adjust.com |
| MoEngage | Customer engagement and retention | moengage.com |
| Kochava | Unified audience platform | kochava.com |
| Woopra | Customer journey analytics | woopra.com |
UXCam App Analytics
| G2 Rating | Platform | Price |
|---|---|---|
| 4.7/5 | iOS / Android / React Native / Flutter / .NET | Free Trial / Pricing Upon Request |
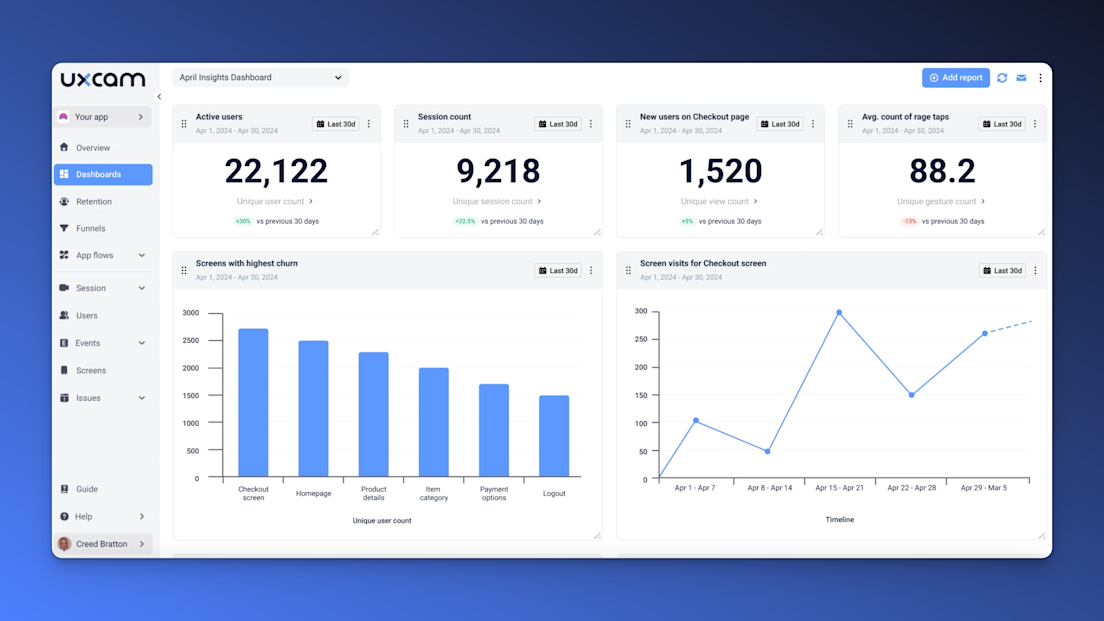
That's us! With UXCam, you get a 360-degree view of your app's performance.
Our platform offers more than just basic metrics - it gives you a deep understanding of user behavior and helps you to interpret data.
Get insights into your most important metrics with AI-powered KPI dashboards.
Reveal the hidden story behind user behavior with UXCam's session recordings and heatmaps.
Gain an in-depth understanding of what drives users to convert or drop off with funnel and retention analytics.
Reduce bugs and save developer time with crash analytics - replicate every crash in under 30 seconds.
What customers say about UXCam
Don't just take our word for it. Here's what the internet has to say about UXCam:
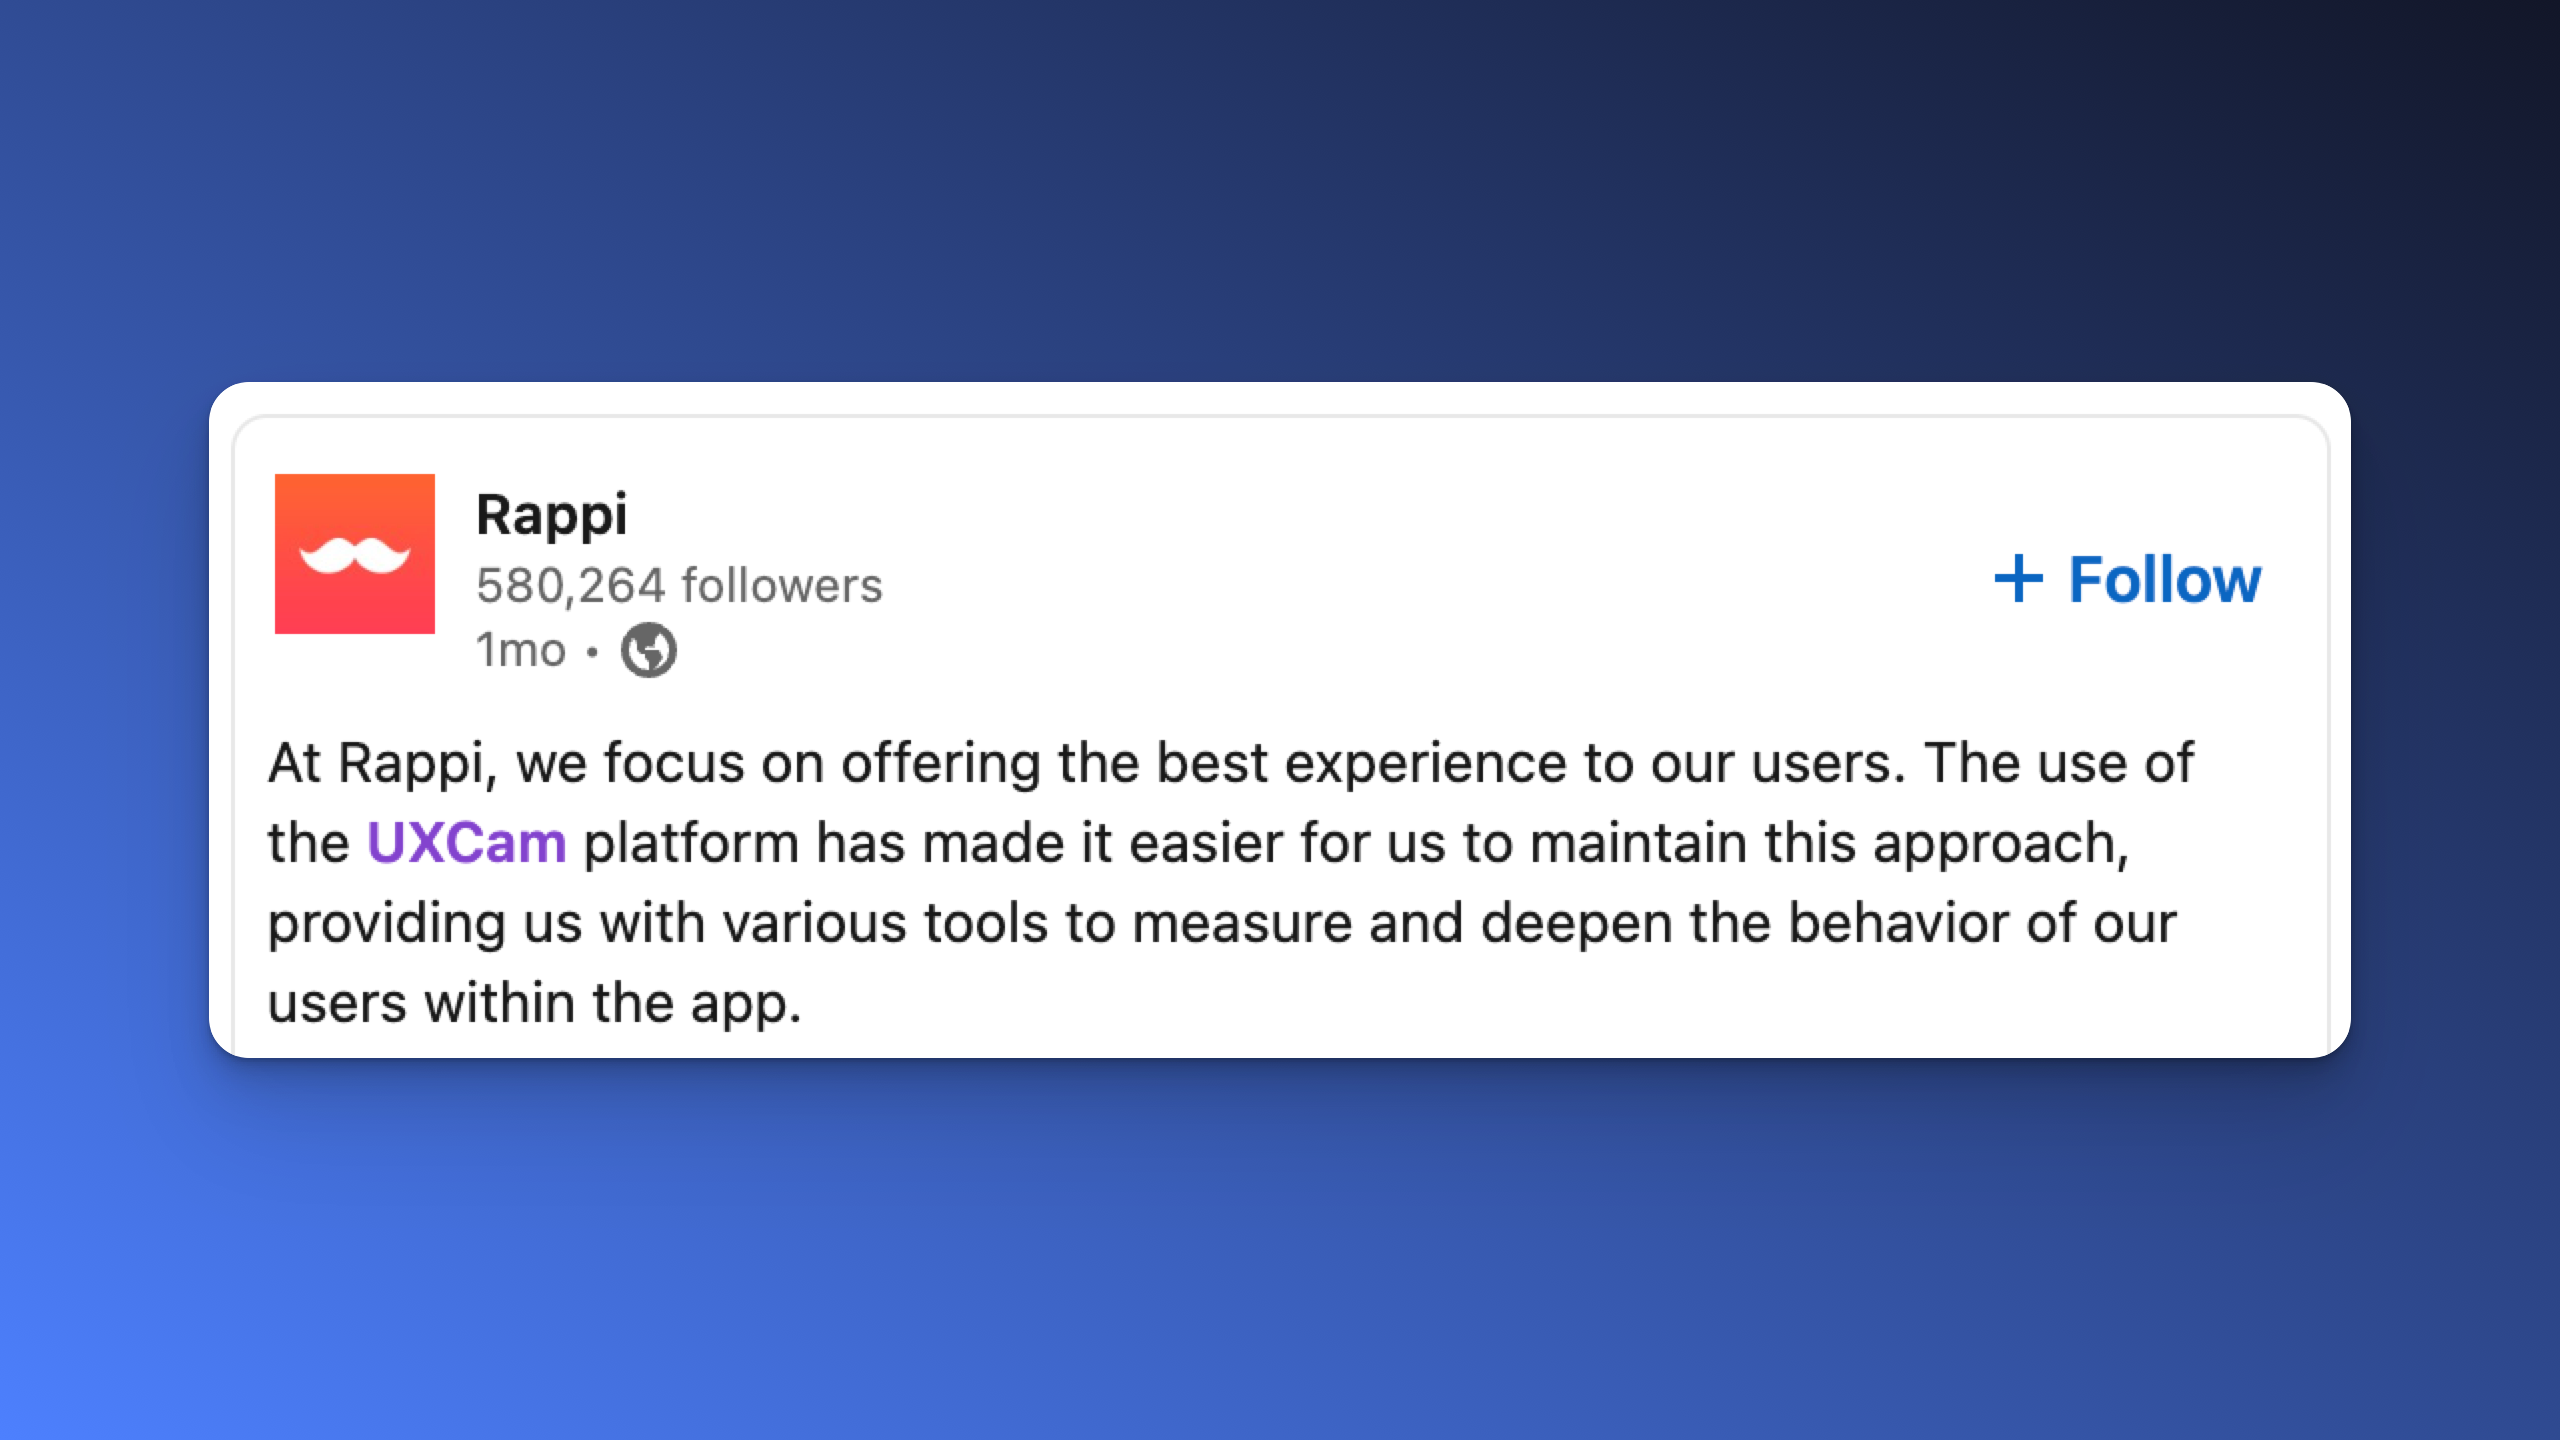
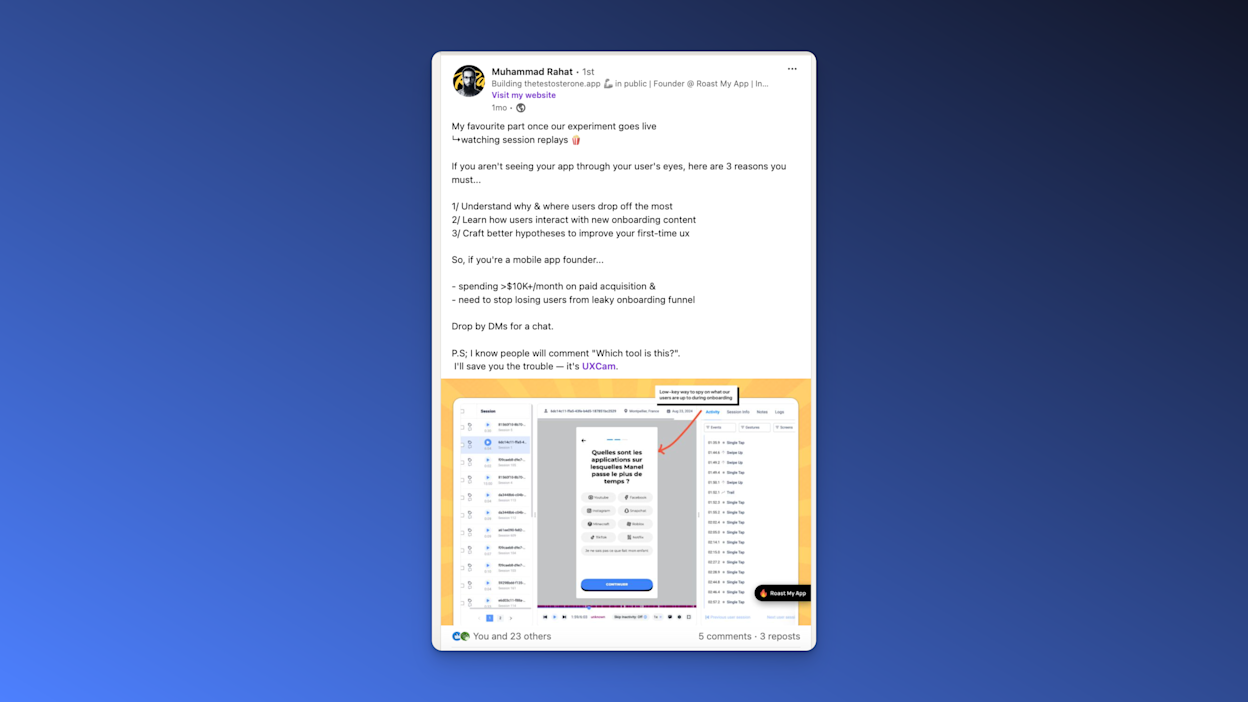
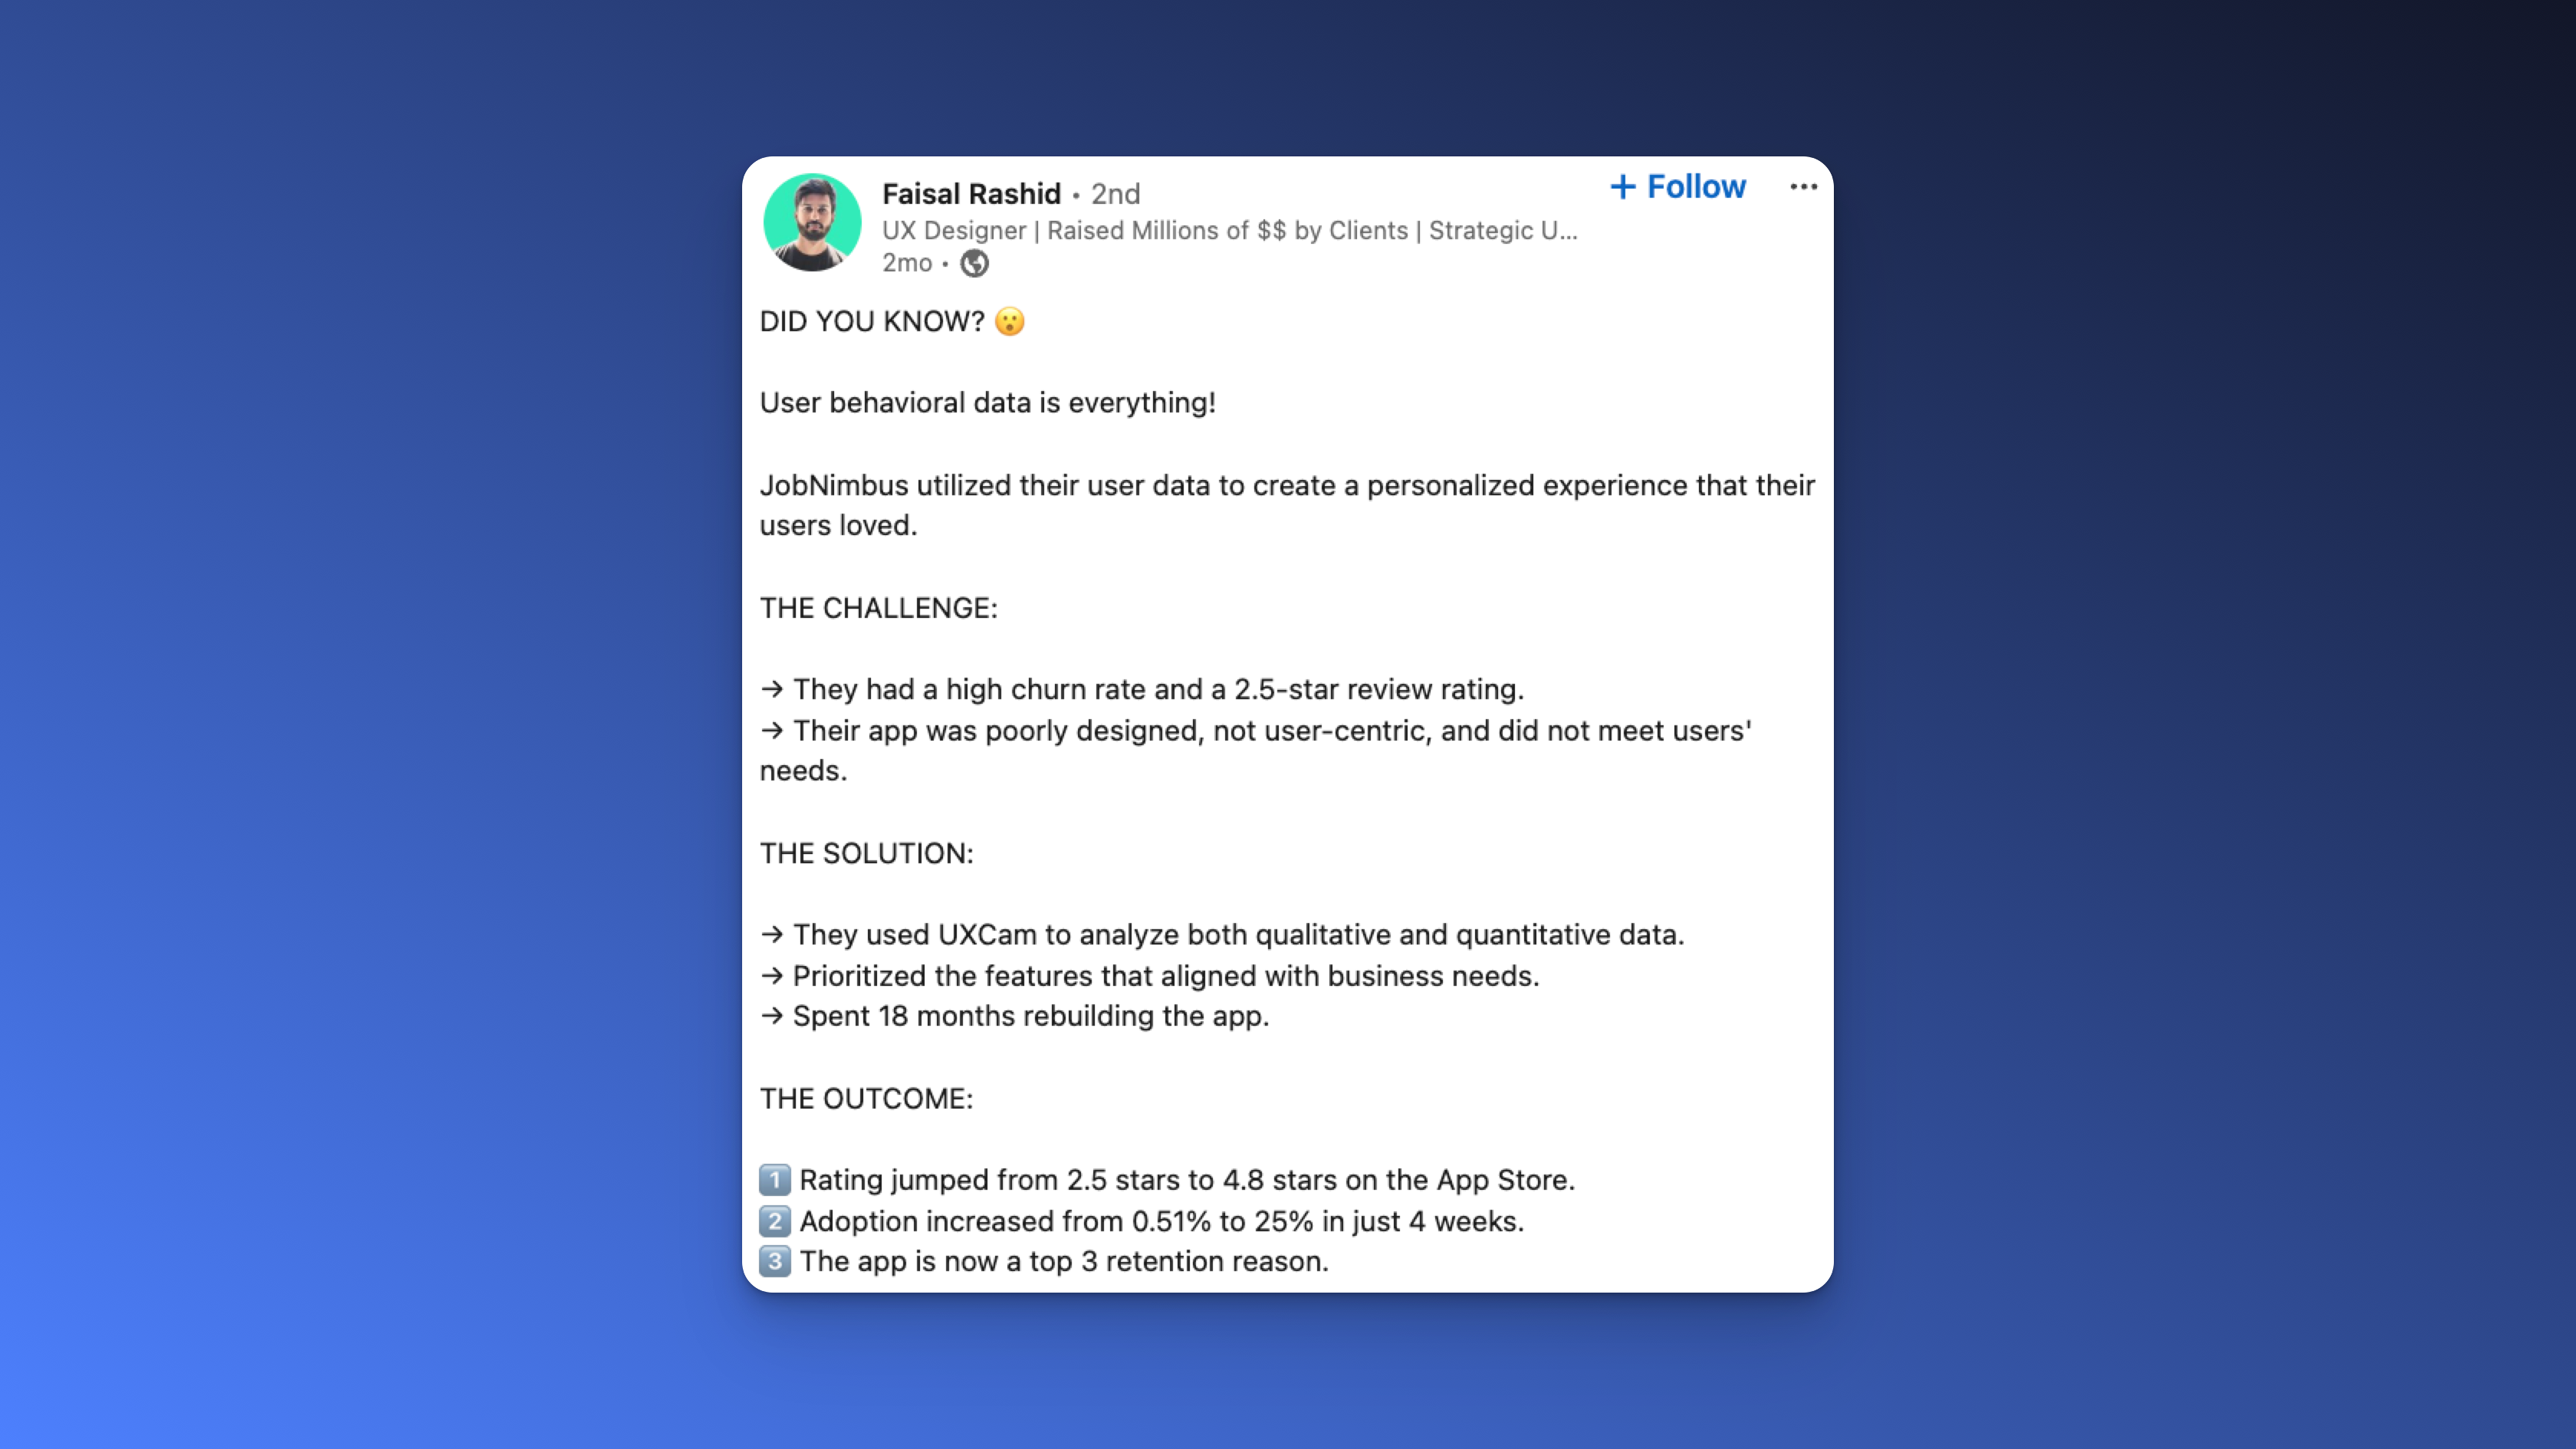
UXCam is installed in over 37,000 apps. Customers have reported higher conversion and retention rates since they started using UXCam:
Coca-Cola's Costa Coffee increased user registration by 15% with UXCam [Link to case study].
Housing.com increased feature adoption by 20% with UXCam [Link to case study].
PlaceMakers doubled sales with UXCam [Link to case study].
Features
Take advantage of in-depth behavior analytics: With detailed analytics including heatmaps, screen flow analysis & funnel tracking – UXCam can be your single source of truth for user behavior.
Improve app performance: UXCam provides insights into UX issues, alerting you to crashes, UI freezes, and handling exceptions that are easily preventable.
Understand user journeys: UXCam's tracking capabilities allow you to see the complete user journey, helping you understand how users interact with your app and identify areas for improvement.
Increase conversion rates: By identifying and addressing user struggles, UXCam can help increase conversion rates and improve the overall effectiveness of your app.
Customizable dashboards: UXCam's AI-powered customizable dashboards allow you to track the performance metrics that matter most to your app and easily understand how your app is performing.
Pros and Cons
| Pros | Cons |
|---|---|
| Captures all micro-interactions | Limited free plan |
| Qualitative analytics: session replay and heatmaps | Taps are not preserved when videos are exported |
| Quantitative analytics: funnels & customizable KPI dashboards | |
| Lightweight SDK | |
| High data security |
UXCam offers a free plan and a free trial. You can integrate UXCam into your mobile app in 5 minutes with one code snippet.
If you have any questions about UXCam, reach out for a 1:1 demo.
Firebase
| G2 Rating | Platform | Price |
|---|---|---|
| 4.5/5 | iOS / Android | Analytics is free, you pay for other services such as app hosting |
Firebase offers a one-stop shop for app development needs, combining analytics and infrastructure into an all-inclusive service. One of the main advantages of using Firebase is that it offers a wide range of features, including analytics, crash reporting, hosting, and A/B testing, all under a single product.
G2 gives Firebase a rating of 4.5 out of 5, and it is available on iOS and Android platforms. The tool is free to use, but paid options are available for those with higher traffic volumes.
Features
Event Tracking: Monitor user interactions with specific elements within your app.
Audience Segmentation: Group users based on shared characteristics or behaviors.
Conversion Tracking: Measure the success of predefined user actions, like making a purchase.
Retention Analysis: Understand how well you retain users over different periods.
Real-time Data: Access updates on user activity as it happens.
Funnels: Visualize the steps users take to complete specific actions within your app.
Attribution: Identify where your users are coming from, whether it’s organic search, paid ads, or social media.
Deep Linking: Navigate users to specific content within your app, enhancing engagement.
Pros and Cons
| Pros | Cons |
|---|---|
| Free to use with robust functionalities. | Steep learning curve for beginners. |
| Real-time tracking and reporting. | Limited customization compared to some other analytics platforms. |
| Seamless integration with other Firebase tools. | Data is sampled, which might affect the accuracy of reports in high-traffic apps. |
| Comprehensive reports on user behavior and engagement. | Privacy concerns due to data storage on Google's servers. |
| Supports both app and web analytics. | Less intuitive UI compared to some competitors. |
| Automatic tracking of key user events. | Dependency on internet connectivity for real-time updates. |
| Custom event and audience segmentation capabilities. | Some advanced features might require technical expertise to implement. |
Mixpanel
| G2 Rating | Platform | Price |
|---|---|---|
| 4.5/5 | iOS / Android / Web | Free / Paid (starts at $28/month for 10k events) |
Mixpanel tracks user interactions and allows you to build custom reports. This mobile app analytics platform lets you evaluate user actions by segmenting them and creating funnels.
One of the key features of Mixpanel is the ability to segment user actions and create funnels to understand how users are interacting with your app. This can be especially useful during the onboarding process optimization.
In addition to tracking user interactions, Mixpanel also provides information about data points such as location, device, and channels, which can give you insights into your users' demographics and behavior. Overall, Mixpanel is a good tool for understanding user behavior and optimizing your app for the best possible user experience.
Features
Event Tracking: Monitor user actions in real-time to understand how people interact with your app.
Segmentation: Break down your user base into segments to get detailed insights on specific groups.
Funnel Analysis: Identify where users drop off in their journey and optimize conversion rates.
Retention Reports: Track how well you’re retaining users over time and what features keep them coming back.
User Profiles: Create detailed profiles for each user, including their actions and preferences.
Cohort Analysis: Group users based on their behavior or demographics for deeper insights.
Pros and Cons
| Pros | Cons |
|---|---|
| Can define detailed events | It's time and resource-intensive to set up |
| Allows for easy audience segmentation | Build for web, mobile app tracking lacks behind |
| Fast software | Limited date range for user flows |
Userpilot
| G2 Rating | Platform | Price |
|---|---|---|
| 4.7/5 | Web / iOS / Android | Growth plan starts at $799/month (mobile is an add-on) |
Userpilot is a comprehensive product growth platform that offers powerful analytics and engagement tools for both web and mobile applications. The platform enables product teams to understand user behavior, create personalized onboarding experiences, and improve product adoption without requiring technical expertise.
Mobile analytics is available as an add-on to Userpilot's Growth and Enterprise plans, with pricing starting at $799/month.
Features
Cross-Platform Analytics: Unified analytics for web and mobile, allowing you to track the entire user journey in one place.
Custom Dashboards: Build flexible datasets and reports tailored to your specific product goals and team needs.
Mobile Screen Analytics: Monitor key metrics and user flows to identify friction points and optimization opportunities.
Advanced Segmentation: Group users based on behavior, demographics, or custom properties for targeted analysis.
In-App Engagement Tools: Create mobile carousels, slideouts, and push notifications without code.
User Feedback Collection: Gather qualitative insights with NPS, CSAT, and CES surveys directly in your mobile app.
Behavior-Based Triggers: Launch the right experience at the right time based on user actions.
Pros and Cons
| Pros | Cons |
|---|---|
| All-in-one solution combining analytics and engagement tools | Higher entry price point compared to some competitors |
| Mobile-optimized UI components that feel native to the app | Mobile available only as an add-on to paid plans |
| No-code builder for product managers and marketers | May require initial setup time to configure properly |
| Unified analytics across web and mobile | More focused on product engagement than deep technical analytics |
| Built-in user feedback tools with multiple survey types | |
| Advanced segmentation for personalized experiences | |
| SOC-compliant security standards |
Userpilot stands out by offering a single platform that addresses the entire user journey from onboarding to retention, with mobile-specific components rather than repurposed web UIs. The platform is designed for cross-functional teams who want more control over the product experience without constant reliance on developers.
Amplitude
| G2 Rating | Platform | Price |
|---|---|---|
| 4.5/5 | iOS / Android | Free / Paid (starts at $49/month for 1k MTUs) |
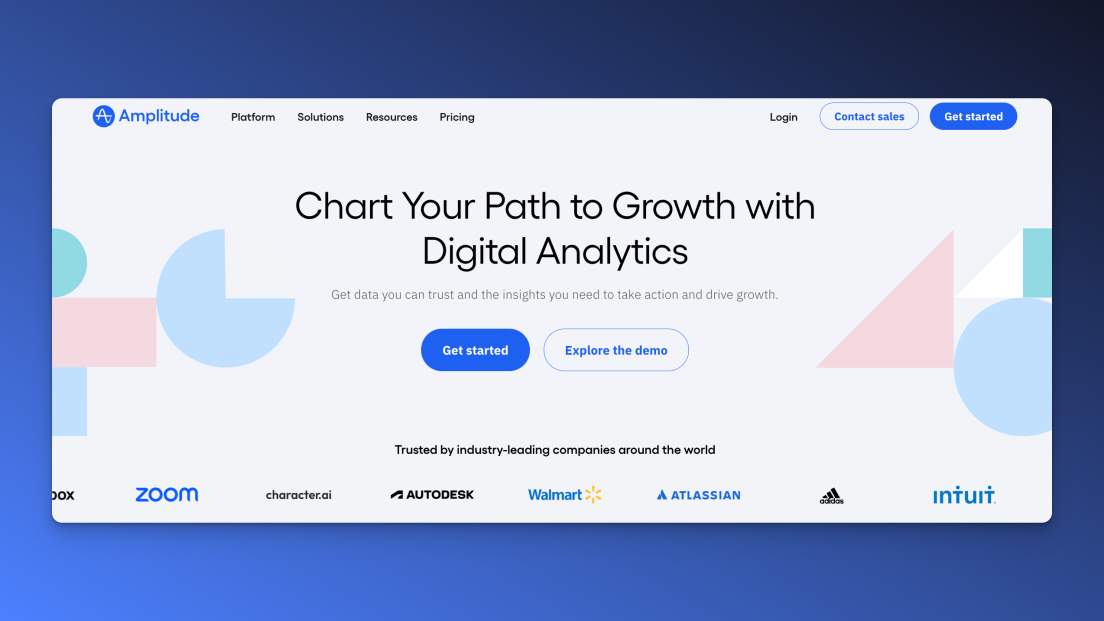
Free up to 10 million user actions per month. If your app exceeds that, you must go for an annual contract that starts at $2K/month on the lowest plan.
Amplitude is a robust quantitative analytics tool. Its features and use cases are comparable to those of Mixpanel.
One of the key features of Amplitude is its ability to track user actions and analyze user behavior. It provides a range of tools and metrics that can help you understand how users are interacting with your app, including tracking user events, analyzing user demographics, and identifying areas for improvement. You can also use Amplitude to create custom reports and funnels to understand how users are progressing through your app and identify any areas where they may be struggling or dropping off.
Features
User Journey Tracking: Examine the paths users take through your app to identify opportunities and pitfalls.
Segmentation: Break down your audience into distinct groups to analyze specific behaviors and characteristics.
Retention Analysis: Measure how well you keep users engaged over a defined period.
Funnel Analysis: Understand where users drop off and how they move through different stages of your app.
Behavioral Cohorts: Create user segments based on behavior patterns to tailor your engagement strategies.
Pros and Cons
| Pros | Cons |
|---|---|
| Customizable dashboards | No auto-capture |
| Fast support | Needs training and support |
| Strong cohort & funnel analytics | Time-intensive to define events |
Countly
| G2 Rating | Platform | Price |
|---|---|---|
| 4.1/5 | iOS / Android / Web | Paid plans start at $80 per month |
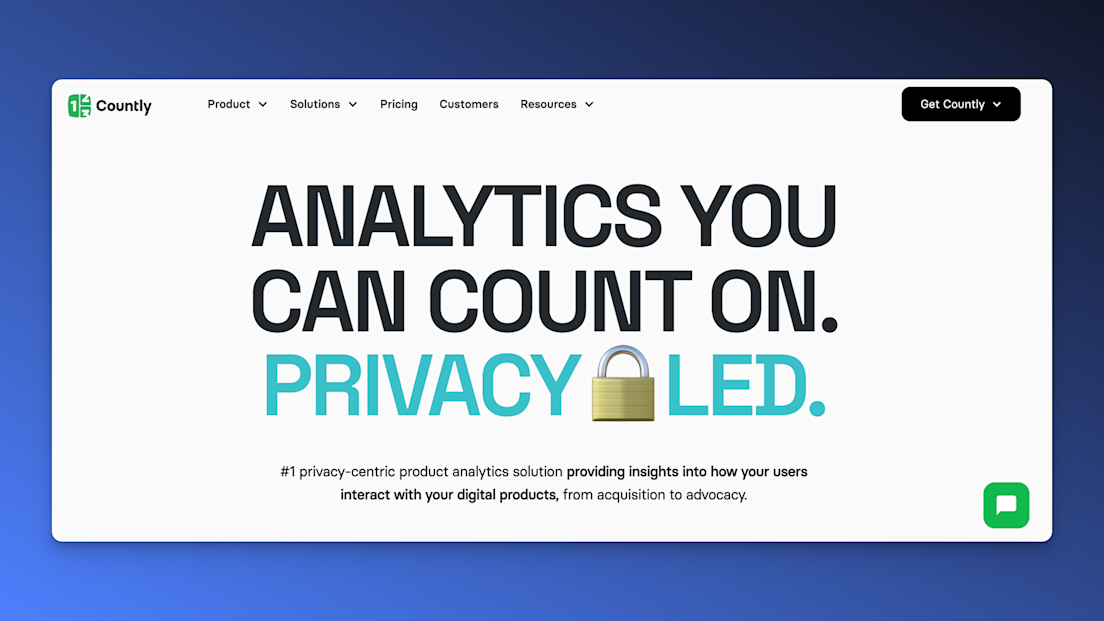
Countly provides an overall analytics picture for web and mobile. It offers a real-time, open-source mobile analytics application that can be hosted on your own servers.
One of the key features of Countly is its ability to track user behavior and provide a range of metrics and tools for understanding user actions. It offers a range of features for tracking user events, analyzing user demographics, and identifying areas for improvement.
Features
Open-source application.
Extensible via plugins.
On-premise or private cloud.
Retention analysis.
Funnel analysis.
Pros and Cons
| Pros | Cons |
|---|---|
| Allows on-premise hosting | Unintuitive UI |
| Plugin extensions are possible | Limited cohort and event tracking |
| Push notification capabilities | Time-intensive setup |
Apple App Analytics
| G2 Rating | Platform | Price |
|---|---|---|
| N/A | iOS / tvOS | Free |
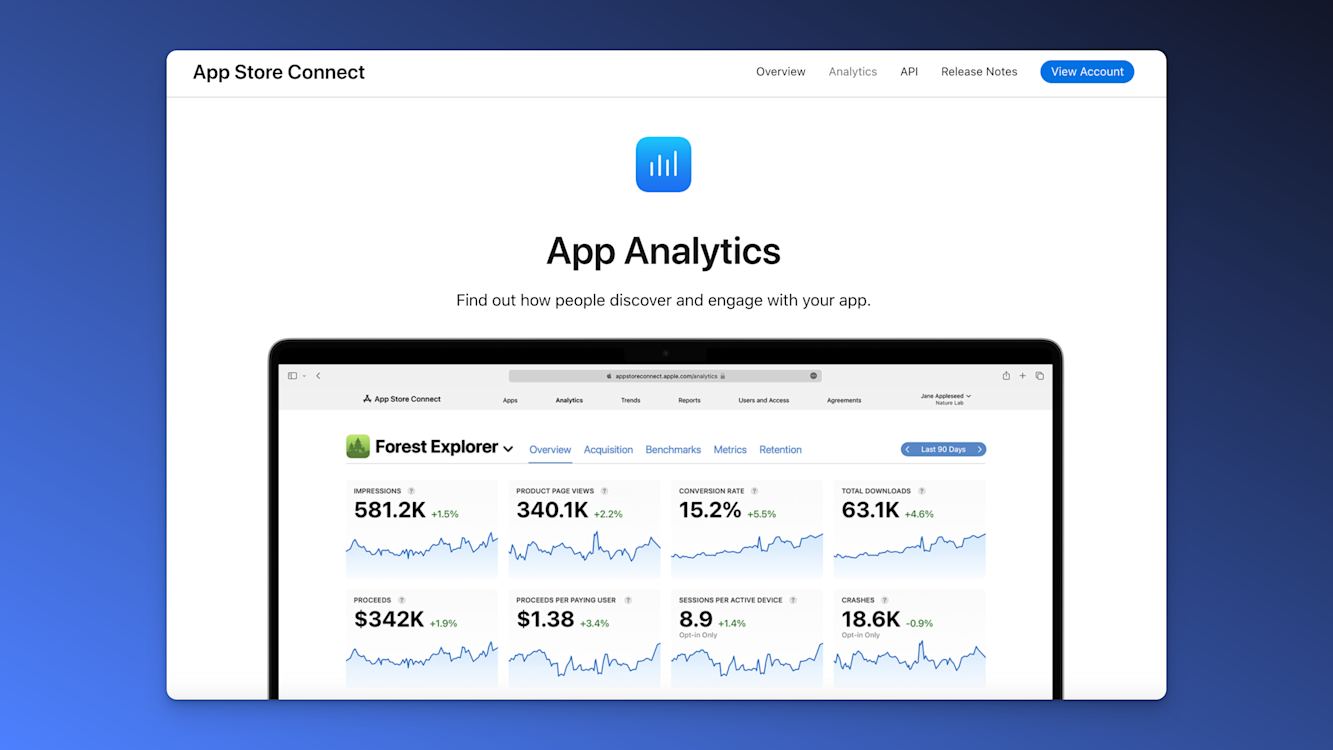
Apple App Analytics is included with the Apple Developer Program membership and doesn’t require any implementation.
Although with limited capabilities, it’s a decent mobile app analytics tool. It should be paired with another more advanced one.
Features
Usage data.
Sales data.
App Store data.
Pros and Cons
| Pros | Cons |
|---|---|
| App Store Performance | Available for only iOS |
| Basic App Engagement and Usage | No In-App Analytics |
| Marketing Campaign Tracking | Only Shows Basic KPIs |
Adobe Analytics
| G2 Rating | Platform | Price |
|---|---|---|
| 4.1/5 | iOS / Android | Pricing upon request |
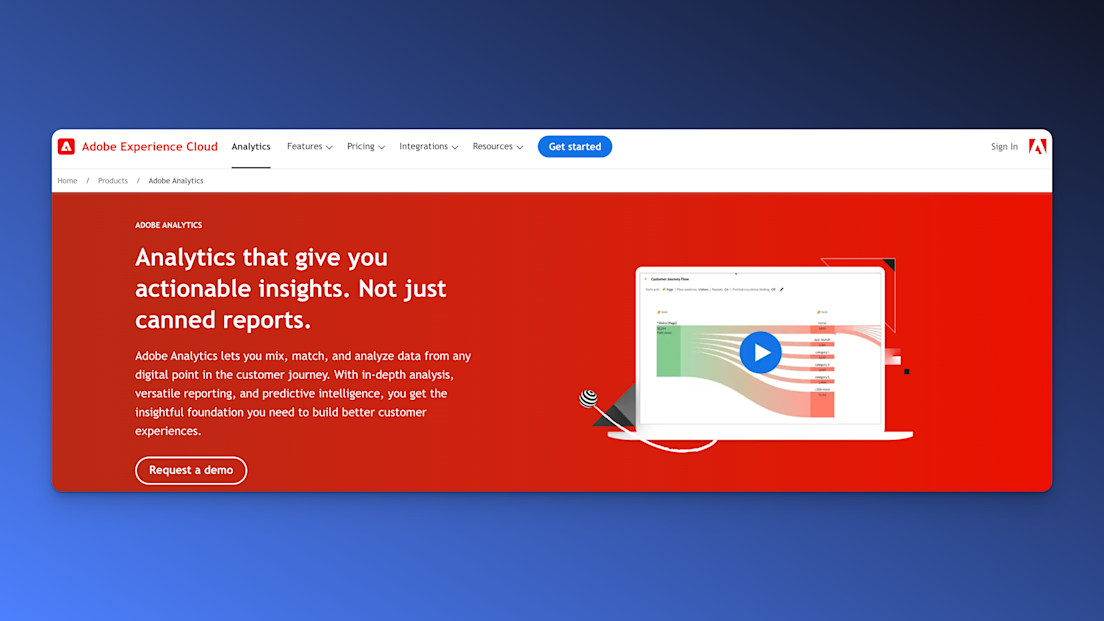
Adobe Analytics gives you the tools you need to understand your users.
This app analytics tool is priced for enterprise clients only. Adobe Analytics provides you with real-time analytics and detailed segmentation.
It provides a range of features for tracking and analyzing user behavior, including tools for understanding customer journeys, identifying trends and patterns, and measuring the effectiveness of marketing campaigns. Adobe Analytics also offers a range of integrations with other Adobe products and third-party platforms.
Features
Flow exploration.
Fallout analysis.
Custom histograms.
Cohort analysis.
Contribution analysis.
Pros and Cons
| Pros | Cons |
|---|---|
| Custom implementation | Complex implementation |
| Personalized reports | High entry price point |
| Attribution analysis | Hard to use at the beginning |
Glassbox

| G2 Rating | Platform | Price |
|---|---|---|
| 4.7/5 | iOS / Android / Web | Pricing upon request |
Glassbox provides digital experience analytics across mobile and web. They focus on journey mapping but have many more features, listed below.
However, it is not as comprehensive or feature-rich as some of the other options on the market. It may lack some of the advanced tracking and analysis tools offered by other platforms, and may not be as scalable or flexible in terms of integrations and customization. While Glassbox Digital may be suitable for some apps, those looking for a more robust and comprehensive solution may want to consider other options.
Features
Session replay.
Crash analytics.
Network and device performance.
Interaction mapping.
Engagement analytics.
Pros and Cons
| Pros | Cons |
|---|---|
| Intuitive Tool | No Free Trial |
| User Identification | Reporting Could Have More Depth |
| Session Replay | Frustration Tracking Could Be Improved |
| Conversion Funnels |
Upland Localytics
| G2 Rating | Platforms | Price |
|---|---|---|
| 3.9/5 | iOS / Android | Pricing upon request |
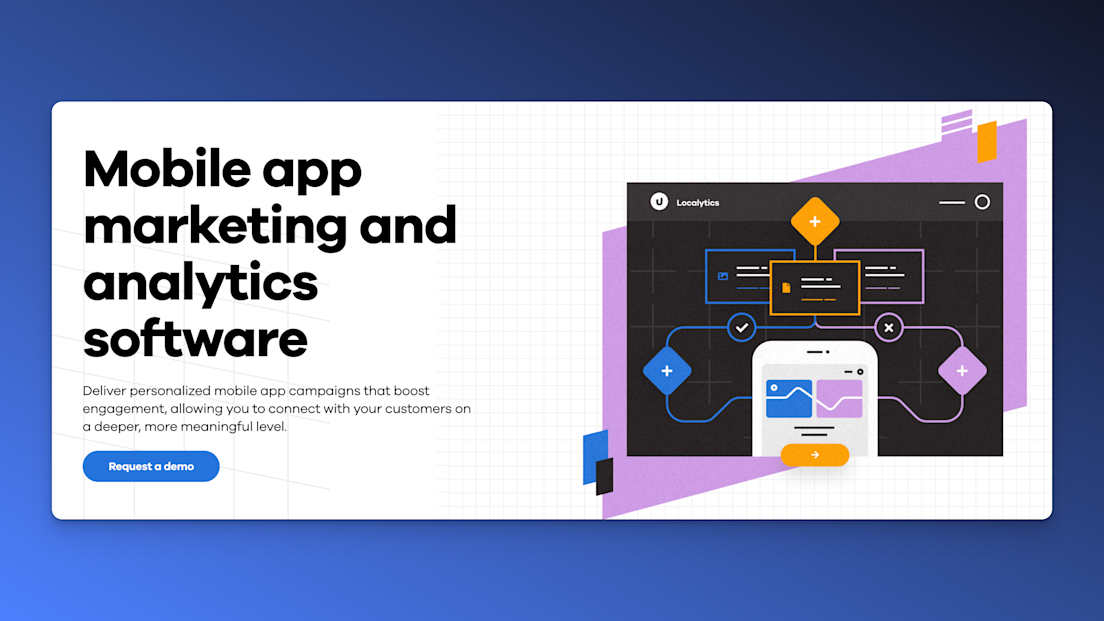
Upland Localytics is a marketing solution for mobile apps. It offers a robust push notification capability. It’s a great tool for tracking retention metrics & attribution models across your apps.
Features
Sessions and events.
Retention.
Attribution.
Uninstall tracking.
LTV.
Mobile CRM.
Cloud support.
Pros and Cons
| Pros | Cons |
|---|---|
| Focus on marketing analytics | Limited amount of correlations |
| Segmented push notifications | Limited product analytics features |
Contentsquare
| G2 Rating | Platforms | Price |
|---|---|---|
| 4.6/5 | iOS / Android / Web | Pricing upon request |
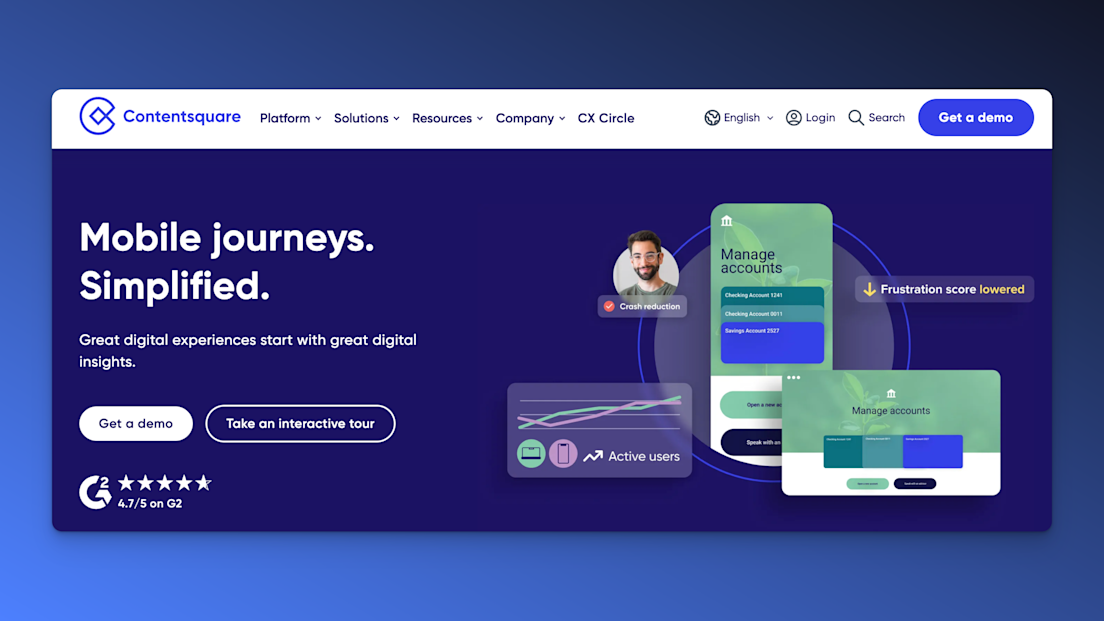
Contentsquare predominantly focuses on web analytics, but it also has a solution for mobile apps. Users can customize content and journeys as well as get a better understanding of why users uninstall.
Features
Visual journey analysis.
Zone-based heatmaps.
Session replay.
Struggle analysis.
Pros and Cons
| Pros | Cons |
|---|---|
| Good support and onboarding | Mapping feature can be improved |
| Clear and easy-to-interpret data | Steep learning curve |
| Zoning analysis and session replay | No free trial period |
| Integration with AB testing tools |
App Radar
| G2 Rating | Platform | Price |
|---|---|---|
| 4.4/5 | iOS/Android | Paid plans start at $59/month for 5 apps |
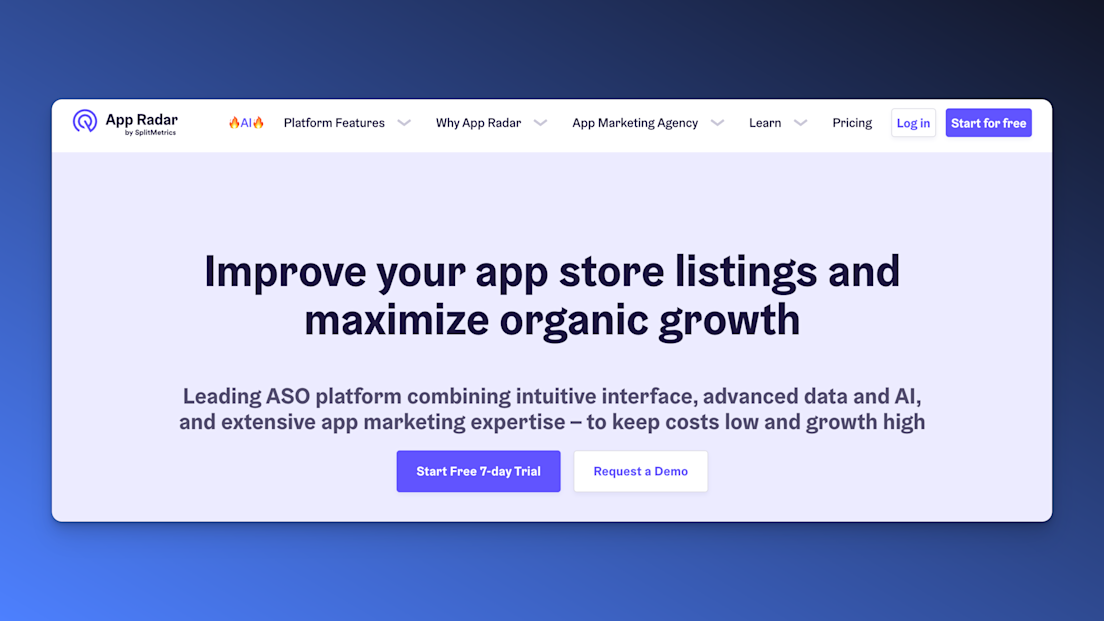
App Radar enhances app visibility, improving your user acquisition rates. The platform offers a unique combination of AI-powered tools that draw from a significant pool of data, making it easier for app developers and marketers to achieve growth and success with their apps.
Features
Unified View of Essential App Metrics
App Health Insights
Keyword Ranking
Ratings & Reviews
App Store Performance
Conversion Rate Analysis
Pros and Cons
| Pros | Cons |
|---|---|
| User-friendly interface | Lacks in-depth app analysis |
| Comprehensive functionality for higher app rankings | Inability to customize reports |
| Effective keyword tracking | Absence of readily available metrics |
| Efficient onboarding process | |
| Instant optimization score feedback for user acquisition |
AppsFlyer App Analytics
| G2 Rating | Platform | Price |
|---|---|---|
| 4.4/5 | Android / iOS / Web / PC / Console / CTV / OTT | Paid plans start from $0.07 per conversion |
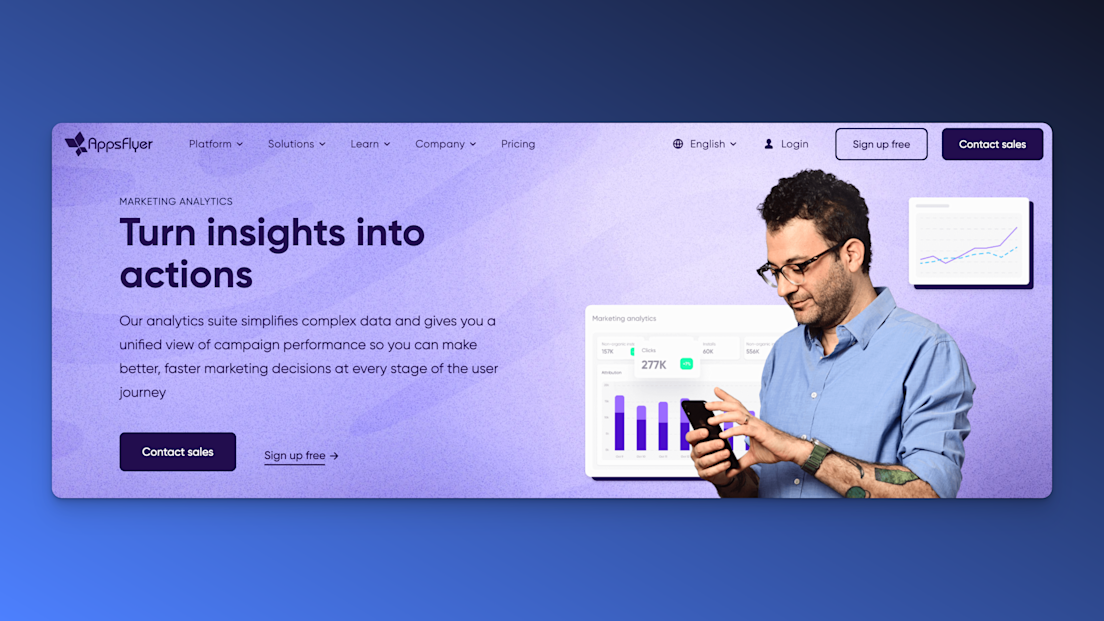
AppsFlyer provides a wide range of features across its plans, from basic analytics tools to advanced solutions like fraud protection, audience segmentation, and custom APIs. Users can choose the plan that best fits their requirements to leverage the platform's capabilities for app growth and optimization.
Features
Mobile Attribution & Marketing Analytics
Customer Journey Mapping
Attribution Modeling
Audience Segmentation
Social Media Metrics & Retention Tracking
API for Integration
Pros and Cons
| Pros | Cons |
|---|---|
| Seamless integration capabilities | Needs improvement in evaluating affiliate partners |
| Multi-channel attribution and analytics | Challenges in distinguishing between actual and cohort revenues |
| Real-time reporting & tracking | Limited dashboard customization |
| Extremely competitive pricing | Steep learning curve |
Survicate
| G2 Rating | Platform | Price |
|---|---|---|
| 4.6/5 | Android, iOS, React Native, Flutter, Unity SDK, Segment Integration | Paid plans start from $119 per month |
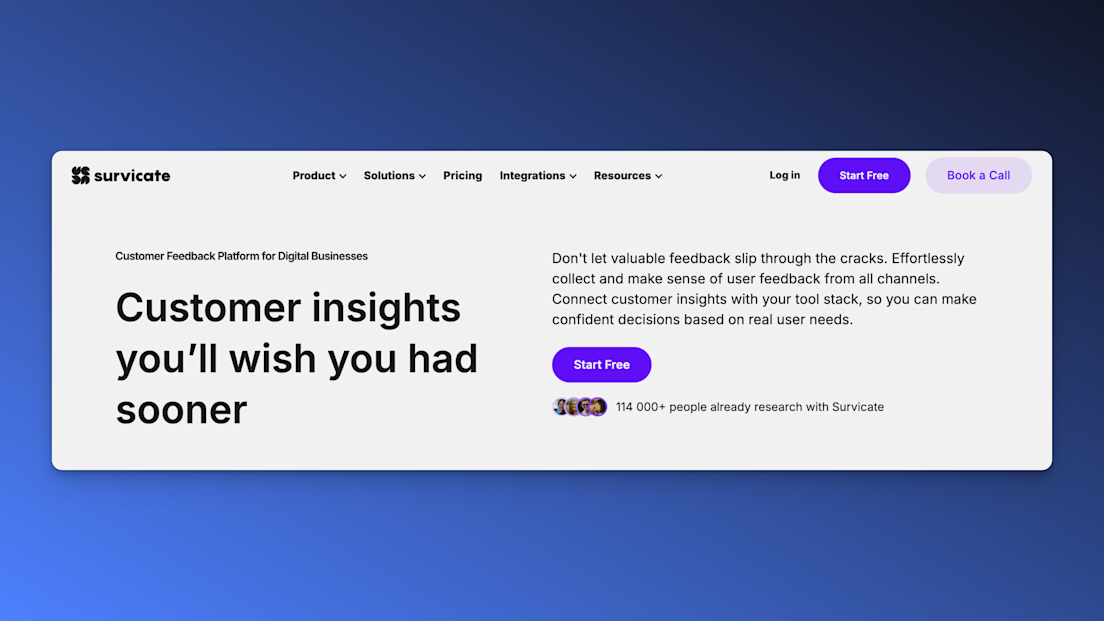
Survicate is a survey tool used to collect customer feedback across various channels, including mobile apps, email, websites, and products. It’s user-friendly, allowing you to set up and launch surveys in minutes, all thanks to its AI-powered survey creator and pre-made templates.
With Survicate, you can run surveys on specific screens and events within the mobile app and select a group of users you want to collect feedback from based on factors such as traits, the device used, or the operating system.
What’s more, you can easily design your surveys using your brand colors and style.
When it comes to concluding the feedback you receive, the analytics dashboard helps you quickly understand what your customers are telling you. With the automated AI text answer analysis, you can get an organized summary of the main feedback topics without sifting through every single response.
Features
Display in-app surveys to a chosen percentage of the audience using survey sampling
Automate recurring mobile surveys
Effortless configuration of the mobile survey SDK
Survey logic
Pros and Cons
| Pros | Cons |
|---|---|
| Clear and simple integration process | Limited answering options |
| Comprehensive reporting and analytics | Limited customization options on the free plan |
| Excellent customer support and resources | Some integrations are only available on premium plans |
Singular
| G2 Rating | Platform | Price |
|---|---|---|
| 4.5/5 | C++, iOS, Unity, Android | Paid plans start at $0.05 per conversion |
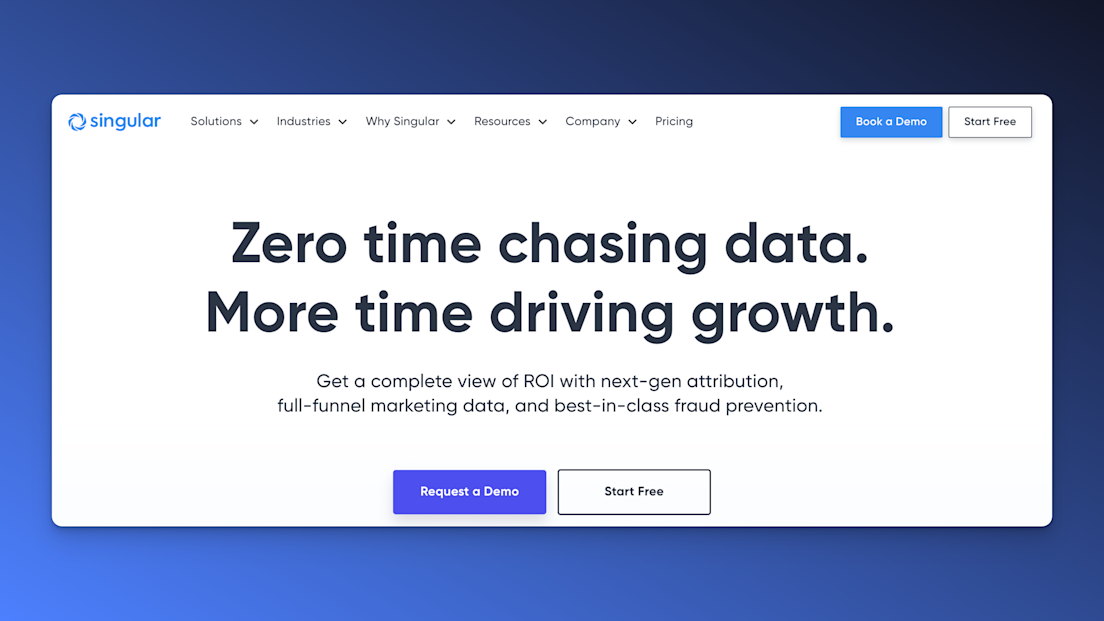
Singular focuses on empowering marketers to achieve a complete view of their marketing ROI by integrating next-gen attribution with full-funnel marketing data and robust fraud prevention mechanisms.
The platform stands out for its ability to measure and report across all marketing channels, including apps, web, SMS, referrals, email, and TV, through an open integration framework. Singular is known for working with leading marketing teams globally, such as Lyft, Twitter, Rovio, King, and LinkedIn.
Features
Market and Keyword Intelligence
ASO Workflow
Ratings & Reviews Management
App and Ad Performance Tracking
Pros and Cons
| Pros | Cons |
|---|---|
| AI-driven market and keyword intelligence | Limited customization options |
| Time-saving app store management | Basic analytical insights |
Adjust App Analytics
| G2 Rating | Platform | Price |
|---|---|---|
| 4.1/5 | iOS / SKAN / CTV / OTT | Pricing upon request |
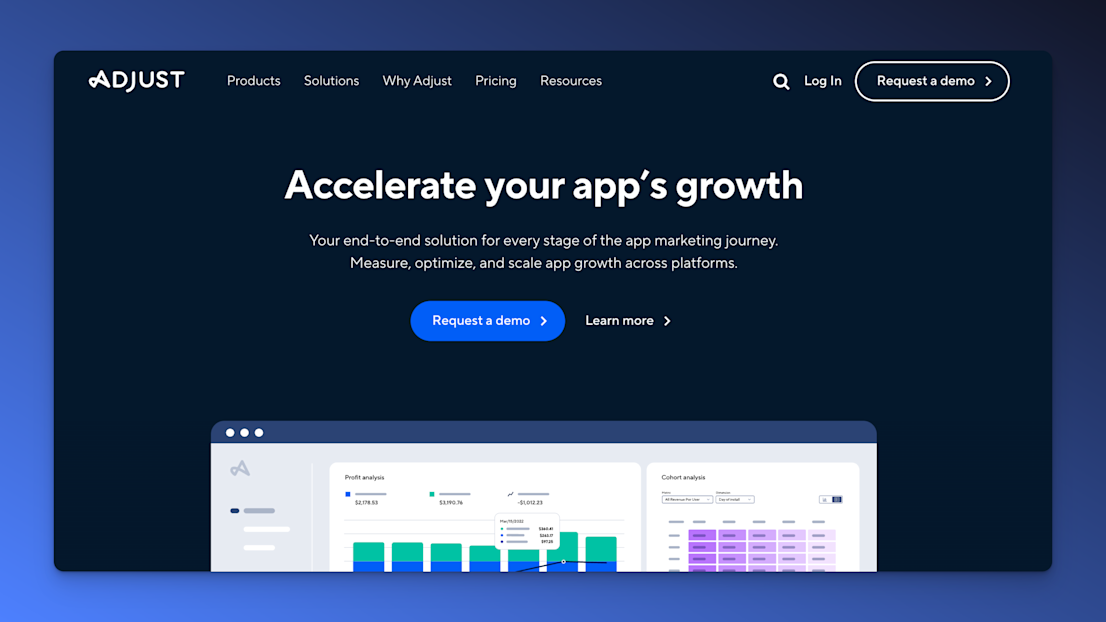
Adjust operates as a part of AppLovin, catering to a global market. It's designed to serve marketers aiming to scale their apps across multiple platforms, including mobile and CTV. The platform is suitable for a diverse range of clients, from fast-growing digital brands to traditional companies venturing into mobile apps.
Features
App Analytics and Attribution
Data Reporting and Visualization
iOS Measurement Solutions
CTV and OTT Measurement
Unlimited Raw Data Access
Marketing Automation and Segmentation
Pros and Cons
| Pros | Cons |
|---|---|
| Detailed analytics | Complex user interface |
| Reliable attribution for optimizing campaigns | Steep learning curve |
MoEngage
| G2 Rating | Platform | Price |
|---|---|---|
| 4.5/5 | iOS / Android | Pricing available upon request |
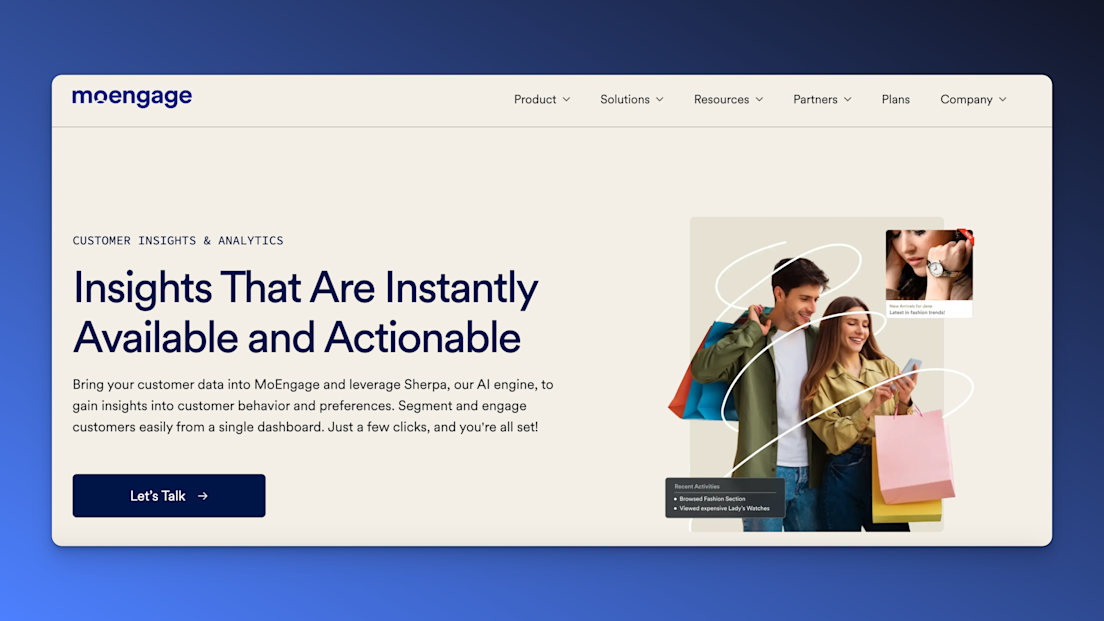
MoEngage is favored for its user-friendly interface, robust feature set, and strong customer support. However, it has room for improvement in pricing and some aspects of its performance and features.
For those seeking a comprehensive marketing automation tool with excellent analytics and reporting capabilities, MoEngage delivers.
Features
Behavioral Trends and Analytics
Funnel and Cohort Analysis
Custom Dashboards and Open Analytics
Dynamic Recommendations and Micro-segmentation
Pros and Cons
| Pros | Cons |
|---|---|
| Customer journeys unified profile | Expensive |
| Detailed personalization | Integration challenges with other tools |
| Uses AI and ML to predict actions | Overwhelming for complex cases |
| Multichannel transactional alerts | Slow service |
| Neat and intuitive | Limited personalized communication options |
Kochava
| G2 Rating | Platform | Price |
|---|---|---|
| 4.0/5 | Various | Enterprise: starting at $2,000.00 per month; Foundation: $500.00 per month |
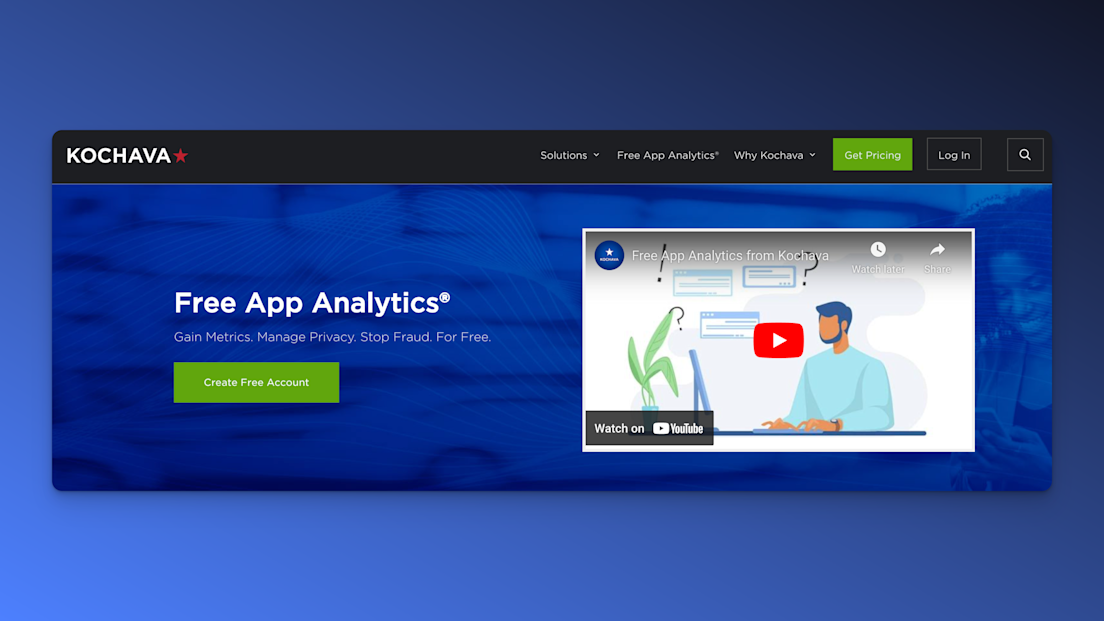
Kochava stands out as a comprehensive solution for mobile app analytics and attribution, providing valuable insights and tools for marketers to help them optimize their campaigns. Its focus on real-time data, user engagement, and fraud prevention, combined with extensive support and training options, makes it a solid choice for businesses aiming to improve their mobile app performance.
While there may be a learning curve for new users, the platform's robust features and positive user feedback indicate its effectiveness in driving app growth and enhancing marketing strategies.
Features
Real-time Mobile Attribution and Analytics
Unified Audience Platform (UAP)
Fraud Prevention
Data and Analytics
Pros and Cons
| Pros | Cons |
|---|---|
| Instant app activity | Hard to use |
| Campaign performance visualizations | Lacks a direct password reset option |
| Detects and prevents mobile ad fraud | Data extraction methods are potentially confusing |
| Automated, customizable push notifications | |
| Accessible customer support |
Woopra
| G2 Rating | Platform | Price |
|---|---|---|
| 4.4/5 | iOS / Android / Web | $0 for 500,000 actions/month and $999 for up to 5 million actions/month |
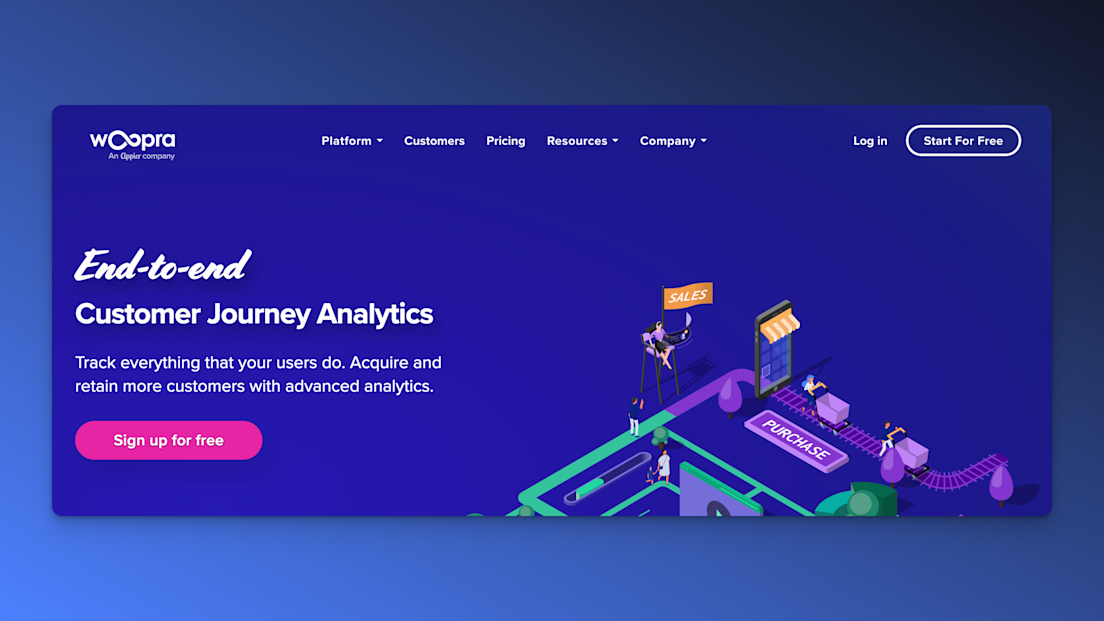
Woopra is a real-time customer analytics service used by sales, service, and marketing teams to optimize customer engagements and improve conversion rates. It tracks users' activity across multiple touchpoints, integrating web, mobile, email, help desk, and more.
While Woopra is notable for its ability to integrate with several different marketing channels, the learning curve with this tool can be a bit prohibitive.
Features
Customer Journey Analytics
Behavioral Segmentation and Customer Profiles
Retention Analytics
Real-time Triggers and Automation
Extensive Integrations
Pros and Cons
| Pros | Cons |
|---|---|
| Real-time analytics | Complex and challenging to use |
| Quick customer follow-ups | Difficulties in adapting to the new user interface |
| Broad integrations cater to diverse business needs |
What are the benefits of app analytics tools?
Mobile app analytics software can provide valuable insights into how your app is performing, helping you make informed decisions to optimize its functionality and user experience.
Enhanced user experience
Understanding how your audience uses your app is crucial for creating a seamless user experience. Mobile app analytics tools like UXCam provide valuable insights by recording user sessions, helping you identify and address issues. By analyzing this data, you can fine-tune your app's functionality and design, significantly boosting user satisfaction.
Increased user engagement
User experience is key in app development. By tracking user interactions, you can identify popular features and areas needing improvement. They, you can use these insights to focus your development on what matters most to users, resulting in a better app experience for everyone.
Improved retention rates
Tracking retention and churn rates with analytics software lets you identify issues and trends affecting user satisfaction. By addressing these areas, you can boost user satisfaction and keep users engaged longer.
Informed marketing strategies
With mobile app analytics, you can dive into user behavior and find out exactly which channels and strategies work best. This means you can target your marketing efforts where they’ll have the most impact, attracting and retaining the right users without blowing your budget. You can use these insights to craft campaigns that resonate, ensuring every dollar spent is a dollar well-invested.
Data-driven decision making
With real user data at your fingertips, you can reduce the guesswork of trial and error and confidently make informed choices for your app's development and marketing strategies. Get ahead of the game and stay on top of your app's performance by leveraging the insights provided by mobile app analytics software.
Optimized monetization strategies
Maximizing your app's earning potential requires keeping a close eye on the revenue sources. But how do you effectively analyze and understand the data? Enter mobile app analytics software. With its help, you can delve deeper into user behavior, identify the most profitable revenue sources, and optimize your monetization strategy like a pro. Make every click count and let analytics take your app to the next level.
Streamlined workflow
Did you know that UXCam and other mobile app analytics tools can connect seamlessly with various other platforms? By integrating with marketing automation tools, customer support software, and data visualization tools, you can optimize your workflow and obtain a deeper insight into your app's performance. This opens up a world of possibilities and opportunities for growth and improvement!
Competitive advantage
By leveraging mobile app analytics software, you can gain valuable insights into your app's performance and user behavior. This information can give you a competitive edge, allowing you to stay ahead of the competition and continually improve your app's performance and user experience.
From enhancing user experience to making data-driven decisions, mobile app analytics tools like UXCam can provide the insights you need to optimize your app's performance and achieve your business goals. By embracing these benefits, you can create a successful and engaging app that stands out in the competitive app market.
Who uses mobile app analytics tools?
Mobile app analytics software provides valuable insights into app performance, user behavior, and engagement. These tools can benefit a wide range of professionals, from developers and designers to marketers and product managers.
Product managers
Are you curious about what makes an app successful? Meet the unsung hero behind the scenes: the product manager. These masters of strategy oversee everything from user experience to business goals to ensure a seamless, effective app. And how do they make sure they're hitting the mark? By using mobile app analytics software, of course! With this powerful tool, product managers can track everything from user engagement to monetization, helping them make informed decisions that make a world of difference. So next time you're enjoying a favorite app, remember the hardworking product manager who made it all possible.
App developers
As the architects behind our favorite apps, developers play a critical role in keeping everything running smoothly. With mobile app analytics software in hand, these tech wizards can gain invaluable insights into how users are interacting with their creations. This data helps identify bugs and performance issues, as well as provides clues to where improvements can be made based on real user data. For instance, tools like UXCam offer session recordings and heatmaps which enable developers to visualize user interactions and pinpoint areas in the app where performance and functionality can be enhanced. In the end, mobile app analytics software empowers developers to create better experiences for their users, improving the overall quality of their apps.
App designers
Creating an engaging app interface is no small feat! Designers hold the responsibility of breathing life into an app's visual elements to capture user attention. To make informed design choices, they turn to mobile app analytics software to understand user behavior. UXCam offers an exceptional suite of features such as session recordings and heatmaps that provide designers with unique visual data to enhance user experience. By leveraging this data, designers can take their creativity to new heights and create apps that become love at first sight for users.
App marketers
For marketers, their job is to get your attention and let you know about the latest and greatest app on the market. But how do they know what works best? Enter mobile app analytics software. This handy tool helps marketers track user behavior and figure out which marketing channels are working best. Using tools like UXCam, they can tailor campaigns to target the right users and boost engagement. With the help of data, app marketing strategies can be optimized for success.
Data analysts
Data analysts are like detectives: they collect, analyze, and interpret data to shed light on important business decisions. If you're a mobile app developer, you'll want to ensure your app is performing up to par, right? That's where data analysts come in. They can sift through an ocean of data, tracking everything from user behavior to engagement. With tools like UXCam, they can quickly identify trends and patterns, and use their findings to improve your app (and your bottom line). Think of them as the Sherlock Holmes of data analysis - always on the case to ensure your app reaches peak performance.
Challenges of mobile app analytics tools
While mobile app analytics software provides valuable insights into app performance and user behavior, there are certain challenges that you may encounter when using these tools.
1. Data overload
Mobile app analytics software can generate vast amounts of data, but sifting through it all can be a challenge. With so many metrics and data points available, it's easy to feel lost in the information overload. Luckily, UXCam has come up with a solution. Their customizable dashboards and user-friendly data visualization tools enable you to identify the key metrics that matter most and translate them into actionable insights. This means you can stop trawling through irrelevant data and instead focus on the insights that will help you make informed decisions and drive your app's success.
2. Data privacy and compliance
In the world of app development, data privacy is a top priority for both developers and users. This means complying with regulations like the General Data Protection Regulation (GDPR) and the California Consumer Privacy Act (CCPA). Fortunately, UXCam has got your back! With features such as data anonymization and secure data storage, you can gain valuable insights without risking your users' privacy. When it comes to data privacy and compliance, UXCam is your go-to solution.
3. Integration with other tools
Integrating your mobile app analytics software with other tools and platforms can be challenging, particularly if they have different data formats or APIs.
4. Real-time data analysis
Keeping tabs on how your app is performing in real time can be a daunting task, let alone trying to analyze vast amounts of data in the process. Luckily, UXCam has got you covered by providing real-time data analysis and personalized dashboards that empower you to make swift and informed decisions based on your app's performance. With UXCam by your side, you'll be able to better understand your users' complexities and behaviors, as well as identify and tackle potential glitches on the spot, ensuring that their experience with your app remains smooth and uninterrupted.
5. User segmentation
Mobile app analytics software can be a bit of a headache when it comes to effectively categorizing users based on demographics, location, or behavior. But fret not, for UXCam has got your back! This powerful software provides dynamic user segmentation capabilities, allowing you to tailor your app's content and features to specific user groups. The result? Higher user satisfaction and engagement across the board. With UXCam, creating a personalized app experience has never been easier!
6. Balancing data collection with app performance
Collecting large amounts of data can impact your app's performance, leading to slower load times or even crashes. To address this challenge, UXCam uses lightweight SDKs and efficient data collection methods to minimize the impact on your app's performance. This ensures that you can gain valuable insights without compromising the user experience.
While there are challenges associated with using mobile app analytics software, tools like UXCam can help you overcome these issues and gain valuable insights into your app's performance and user behavior. By addressing data overload, ensuring data privacy and compliance, integrating with other tools, and balancing data collection with app performance, you can effectively leverage mobile app analytics software to optimize your app and achieve your business goals.
How to buy a mobile app analytics software
In today's fast-paced digital landscape, understanding user behavior is essential for the success of your mobile app. Mobile app analytics software provides invaluable insights into user engagement, retention, and other crucial metrics.
1. Identify your requirements
Before you start shopping for mobile app analytics software, it's important to determine your specific needs. Ask yourself the following questions:
What are your app's main objectives?
Which metrics are most important to you?
Do you require real-time analytics?
Are you interested in user behavior or just the raw numbers?
Do you need to integrate the analytics software with other tools?
By answering these questions, you can narrow down your search and find the ideal software for your app.
2. Research available options
To find the perfect mobile app analytics tool, you'll need to do a bit of research. Fortunately, plenty of options are available, including trusted providers like Firebase, Mixpanel, Amplitude, and UXCam. Reading reviews and asking for recommendations from fellow professionals can help you make an informed decision. Of course, when choosing a tool, it's important to compare features, pricing, and level of support to ensure you're getting the best fit for your needs.
3. Consider UX and ease of use
Are you tired of analytics tools that are difficult to use and navigate? Look no further than UXCam for your mobile app analytics needs. With its user-friendly interface and intuitive dashboard, tracking user behavior and visualizing data has never been easier. Don't let clunky software hold you back - streamline your analytics process with UXCam.
4. Request a demo or trial
Exploring different mobile app analytics tools is like test-driving cars to find your perfect match. Luckily, most providers offer free trials or demos, giving you the chance to take each one for a spin. Don't miss out on this opportunity to make sure the tool fits your needs and feels like a comfortable ride.
5. Check for integration capabilities
When it comes to mobile app analytics, picking the right tool is crucial! Imagine being able to smoothly transfer and analyze data across multiple platforms with ease. Simply put, compatibility is key. Don't forget to consider your current tech stack and make sure the software you choose is in sync with your existing tools like CRM systems, marketing automation platforms, or app development frameworks. It's the little things that make a big difference!
6. Evaluate pricing and plans
Mobile app analytics software is typically offered in various pricing tiers or plans, with each level providing different features and benefits. Carefully evaluate each pricing plan to determine which one best fits your needs and budget. Keep in mind that some providers may charge extra for certain features, such as real-time data or custom event tracking, so it's crucial to read the fine print.
7. Examine the level of support offered
Have you thought about the level of customer support you'll receive when choosing an analytics software vendor? Top-notch providers are there for you through thick and thin with responsive and helpful service across various channels. Don't forget to peek into their resources, like how-to guides and webinars, to ensure you're maximizing the tool's potential.
By following these seven steps, you'll be well on your way to selecting the perfect mobile app analytics software for your app. Take your time, research your options, and remember to consider factors like UX, integration capabilities, and customer support. Happy hunting!
Conclusion: Best Mobile App Analytics Tools
Mobile app analytics software like UXCam can help you discover invaluable insights that revolutionize the way you improve your app's performance. Instead of guessing what your users want, cut the guesswork out of the equation and use hard data to make informed decisions.
These tools enhance the user experience, boost engagement, and ultimately, increase your app's competitiveness in a crowded market. Don't let your app fall behind – utilizing mobile app analytics software is the key to unlocking its full potential.
This concludes the list. We’ll update this article regularly to catch up with the fast-moving analytics world.
FAQ
What is Mobile App Analytics?
Mobile app analytics is the process of capturing, measuring, and analyzing user behavior data gathered from mobile platforms such as mobile phones, iPads, and mobile sites. The data is generated whenever users engage and interact with the mobile applications. The information collected can then be analyzed to measure how effective mobile platforms are in getting customers to complete an action.
Why are Mobile App Analytics important?
Without app analytics, you won’t know which features of your app are performing well and which are not. You’ll miss hidden opportunities and bottlenecks.
What are Mobile App Analytics tools?
A mobile app analytics tool is a software that helps you to monitor your app’s performance. Usually, these tools require the installation of an SDK (Software Development Kit) on your app.
What are the best mobile app analytics tools?
Here's our list of the best analytics tools for mobile apps that we recommend; UXCam, Firebase, Mixpanel, Flurry, Amplitude, Countly, Apple app analytics, Adobe analytics, Glassbox, Upland Localytics and Contentsquare.
How do you use Mobile App Analytics tools?
You need to install the SDK of your analytics vendor on your app. This requires adding a short piece of code. Make sure that you install both quantitative and qualitative mobile analytics software.
You might also be interested in these articles:
Important mobile app analytics metrics to measure
Android Analytics: Top 8 Tools
Android Crash Reporting: Best Tools
iOS Crash Reporting: Best Tools
Mobile App Tracking: Best Tools
5 Best Session Replay Tools for Mobile Apps
Mobile Session Recording: The Complete Guide
4 Key Points That Matter When Comparing Mobile Analytics
Qualitative vs. Quantitative Analysis (Exclusive Infographic)
Mobile UX Design: The Complete Expert Guide
AUTHOR

Jonas Kurzweg
Growth Lead
CONTRIBUTORS

UX, marketing & product nerd. Coffee enthusiast. Working at UXCam.
What’s UXCam?
Related articles
App Analytics
The Hotjar for mobile apps: UXCam
Read on to learn about the best Hotjar alternative for native mobile apps (Android and iOS) and hybrid apps. Here's how to get heatmaps and session recordings for your mobile...

Audrey Meissner
App Analytics
Top 19 Mobile App Analytics Tools in 2025
Choosing the best mobile app analytics tools and platforms for your app can be overwhelming. We did the research, so you don't have...

Jonas Kurzweg
Growth Lead
App Analytics
Amplitude React Native Integration Review & Best Alternative
Explore how to set up Amplitude React Native, read expert reviews, and discover the best alternatives for optimizing your mobile...

Tope Longe
Growth Marketing Manager
