Conversion Funnel Analysis: A Complete Guide for 2026

Conversion funnel analysis is the practice of mapping a user's path through a multi-step flow (like signup, checkout, or onboarding), measuring the drop-off rate between each step, and diagnosing the specific friction causing the losses. It's the most reliable way I know to find high-ROI product fixes, because every funnel has one or two "leakiest" steps that, once fixed, can lift completion rates by 20-40% without requiring any new features.
The conversion funnel itself is a sequence of ordered steps users pass through to complete a goal.
In ecommerce, it might be: product view → add to cart → checkout → payment → confirmation.
In SaaS signup: landing → form → email verification → onboarding → activation.
In a fintech app: download → open → verify identity → fund account → first transaction.
The specific steps vary by business, but the analytical method is the same: measure each step's completion rate, find the biggest drop, watch session replays of users who bailed at that step, fix the specific cause.
Costa Coffee is a good example. Their loyalty registration funnel had a 30% drop-off rate that the analytics dashboard couldn't explain. A funnel analysis plus session replay revealed that 15% of users were hitting an "invalid password" error with no guidance on how to fix it. Simplifying the error message and adding inline validation increased registrations by 15%. That's the pattern: funnels reveal where to look, session replay reveals what to fix.
Key takeaways
Conversion funnel analysis is not about measuring conversion rate. It's about finding the specific step where users give up, then watching those users to understand why.
Every mature funnel has one or two "leaky" steps responsible for 60-80% of the total drop-off. Fix the leakiest, not the general "funnel" as a whole.
Pair quantitative funnel analysis (drop-off percentages) with qualitative session replay (what users were actually doing when they quit). The quantitative layer tells you where to look; the qualitative layer tells you what to fix.
Common conversion killers I see repeatedly: error messages that don't explain how to recover, form fields that reject valid input, buttons that don't respond on mid-range Android devices, unexpected page loads in the middle of flows.
UXCam Funnel Analytics combined with Tara AI automates the diagnostic step: instead of manually reviewing replays, Tara identifies the most common friction patterns at each funnel step and recommends specific fixes.
What is conversion funnel analysis?
Conversion funnel analysis is the systematic measurement and diagnosis of a multi-step user flow to identify where users drop off and why. The analysis has three parts:
Define the funnel: map the ordered steps users take to complete a goal
Measure conversion between steps: calculate the percentage of users who progress from each step to the next
Diagnose the biggest drops: use session replay, heatmaps, and user feedback to understand the specific cause of drop-off at each leaky step
The "analysis" part is the third step. Most teams stop at step 2 (a funnel chart with drop-off percentages) and skip diagnosis, which is where the actual product decisions live.
Why listen to me on this
I've run conversion funnel analyses on dozens of mobile apps and websites across ecommerce, fintech, SaaS, and consumer apps. The pattern I see most often: teams have the funnel data but don't know what to do with it. A typical engagement starts with "our checkout conversion dropped 5% last month" and ends with a specific, fixable UX bug that session replays revealed and the dashboard couldn't.
Why conversion funnel tracking matters
Identifying bottlenecks
Every funnel has a step where disproportionate drop-off happens. Without funnel analysis, you're guessing about where to invest. With it, you know exactly which screen or action is costing you the most conversions.
Enhancing user experience
The biggest drop-offs almost always point at UX friction: confusing UI, unresponsive buttons, unclear error messages, forms that don't fit on mobile screens. Fixing these lifts conversion without adding new features.
Facilitating segmentation and targeting
Funnels look different for different user segments. Paid users may complete a flow at one rate while organic users complete at another. iOS users may behave differently from Android. Segmented funnel analysis reveals which segments need the most attention.
Measuring performance
Before-and-after funnel measurement is how you prove a change worked. Ship a fix, measure the relevant step's conversion rate over the following weeks, confirm the lift. This closed-loop measurement is what separates improvement from hope.
Informed decision-making
Without funnel data, product decisions default to opinion. With it, you can point at specific numbers and say "this step loses us 14% of users; fixing it is worth X% of revenue." That framing wins engineering time and leadership support.
Conversion Funnel Analysis: 10 Steps
Define the goal conversion event
Outline the user journey as ordered steps
Instrument each step as a tracked event
Measure the conversion rate between each pair of steps
Identify the step with the largest drop-off
Segment the drop-off by device, source, and cohort
Watch session replays of users who dropped off at that step
Form a specific hypothesis about the cause
Ship a targeted fix
Re-measure and iterate
Step 1: Define the goal conversion event
Start with the business outcome. Is it a signup, a purchase, a subscription, an activation event? Pick one. Funnels analyze a single goal, not a menu of them.
Step 2: Outline the user journey
Map the ordered steps users take to complete the goal. Keep it to 4-7 steps for a standard funnel. More steps and the drop-off between each gets too small to act on.
Step 3: Instrument each step as a tracked event
Each step needs to be a measurable event in your analytics tool. Most modern tools (UXCam, Mixpanel, Amplitude) auto-capture interactions so you don't need manual instrumentation for each step. For custom business logic events, define them in a shared tracking plan.
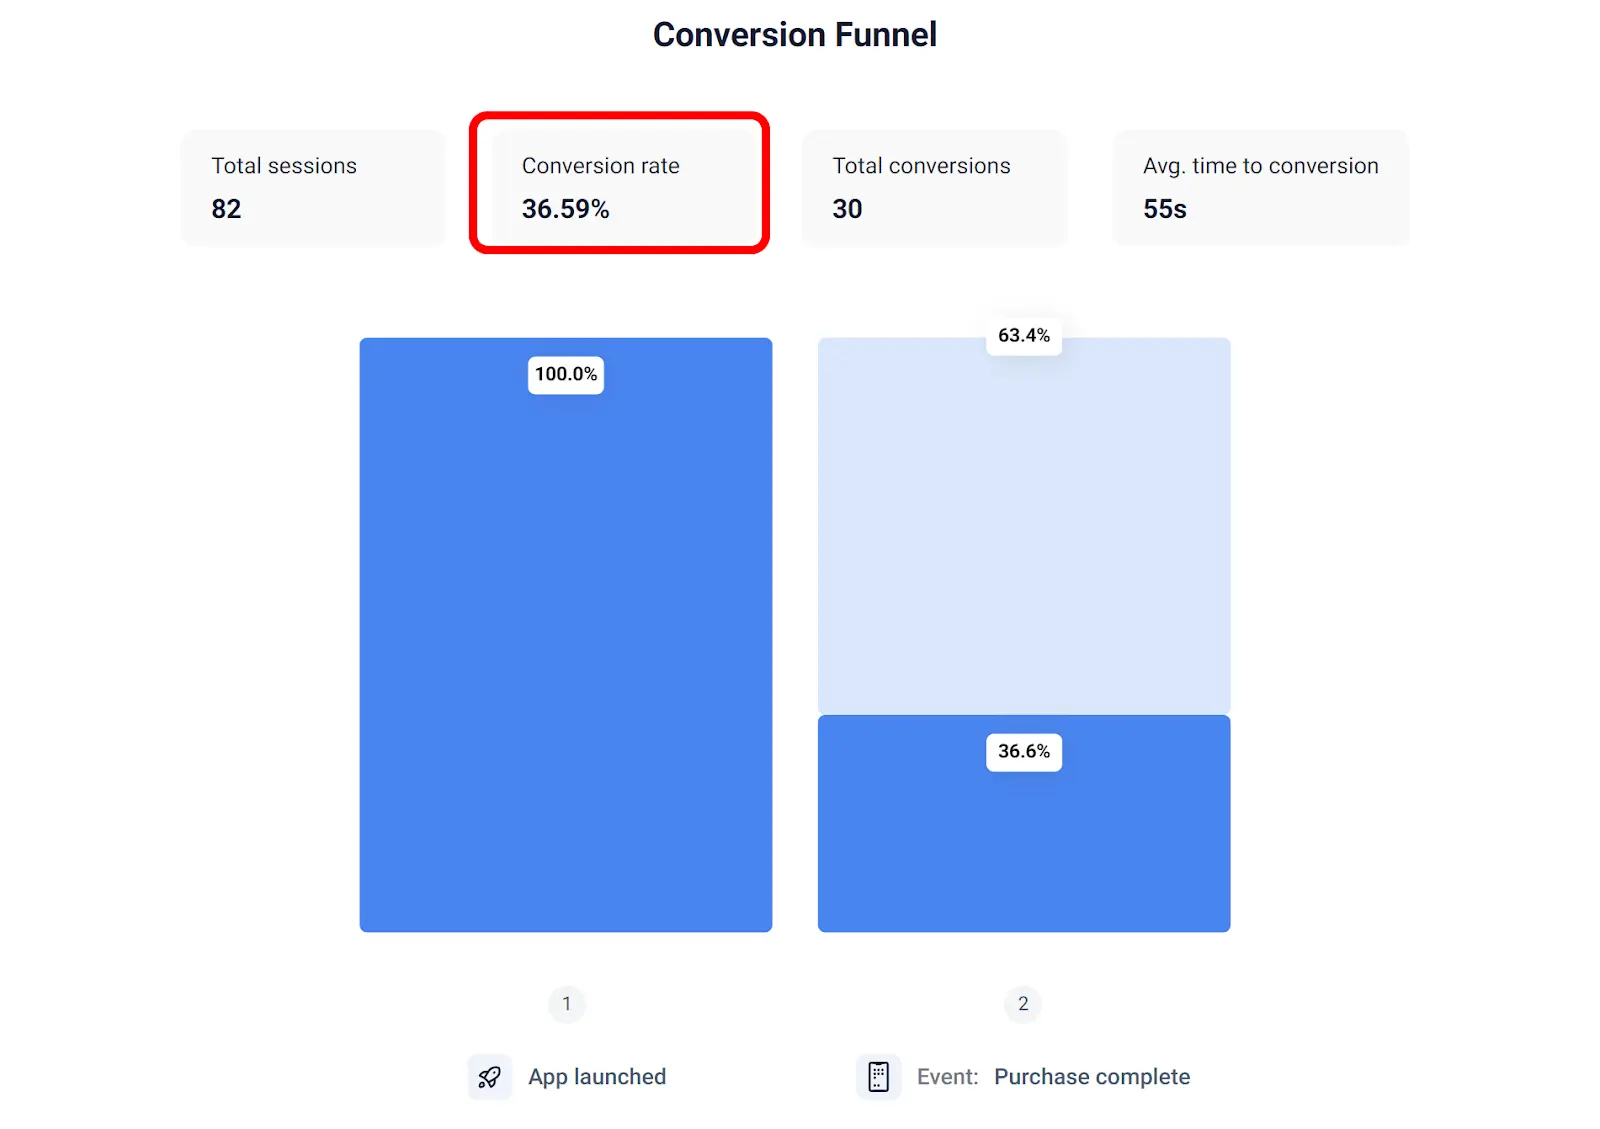
Step 4: Measure the conversion rate between each pair of steps


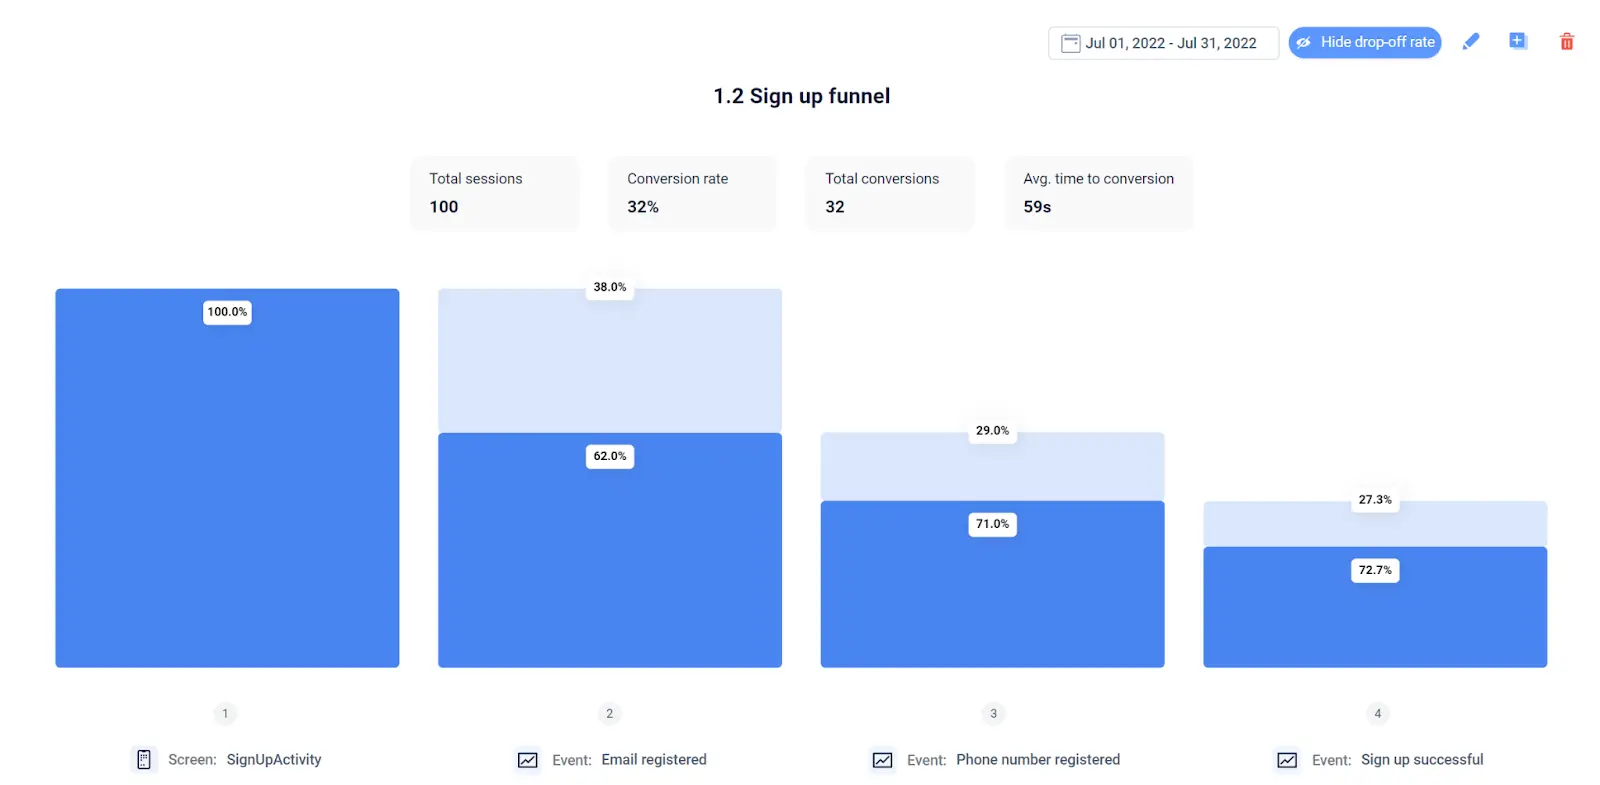
Build a funnel chart showing the percentage of users who progress from step N to step N+1. This is the baseline quantitative view. A 50% conversion from step 2 to step 3 means half the users who reached step 2 never got to step 3.
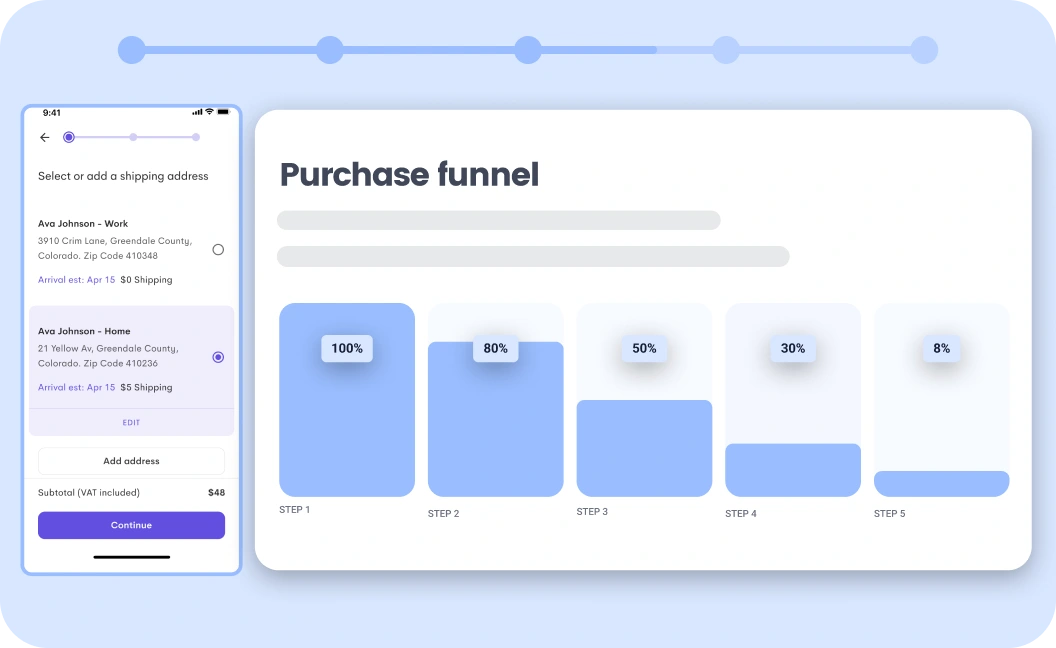
Step 5: Identify the step with the largest drop-off
Look at absolute drop-off, not relative. A step that loses 30% of users out of 10,000 is a bigger problem than a step losing 50% of users out of 500. Prioritize by total users lost.
Step 6: Segment by device, source, and cohort
Before diagnosing, segment. The drop-off might be much worse for mobile users, or for users coming from a specific campaign, or for a specific geography. Aggregate data often hides the pattern.
Step 7: Watch session replays of users who dropped off


This is the step most teams skip and where the biggest insight lives. Filter session replays to users who hit the leaky step and didn't progress. Watch 10-20 of them. Patterns emerge fast: a specific button that doesn't respond, a form field with unclear validation, a modal that steals focus.
UXCam Funnel Analytics makes this one click: from a funnel drop-off, click to the list of sessions where users bailed. Tara AI can also summarize the common patterns across hundreds of sessions automatically, which is the workflow I use now instead of manual review.
Step 8: Form a specific hypothesis about the cause
Vague hypotheses produce vague fixes. Specific hypotheses produce testable changes. Instead of "users are confused at step 3," your hypothesis should be "users on mid-range Android phones cannot see the 'Submit' button because the virtual keyboard covers it."
Step 9: Ship a targeted fix
Fix the specific thing your hypothesis named. Resist the urge to redesign the whole step; the smallest change that plausibly resolves the friction is usually enough.
Step 10: Re-measure and iterate
Track the step's conversion rate over the following 2-4 weeks. Confirm the lift. If it didn't move, revise the hypothesis and try again. Funnel optimization is an ongoing loop, not a one-time project.
10 Best Conversion Funnel Tools (2026)
UXCam (funnels + session replay + Tara AI)
Mixpanel (product-style funnels)
Amplitude (product analytics funnels)
GA4 (basic funnel reports)
Heap (auto-capture funnels)
FullStory (enterprise funnel + replay)
Hotjar (qualitative layer to pair with funnels)
Microsoft Clarity (free session replay + basic funnels)
Pendo (in-app guidance + funnel analytics)
Kissmetrics (customer-journey-focused funnels)
The combination that matters most for funnel analysis is quantitative funnel measurement plus session replay. Tools that have both in one place (UXCam, FullStory) are materially better than stacks where you have to pivot from one tool to another mid-investigation.
What a good conversion rate looks like


Reference ranges by funnel type:
Ecommerce checkout (add-to-cart → purchase): 65-75% is healthy, below 50% suggests friction
SaaS signup (landing → completed signup): 15-25% for self-serve tools, 2-5% for enterprise sales-led
Mobile app onboarding (install → activation event): 30-50% is healthy
Free trial conversion (trial start → paid): 3-7% for freemium, 10-20% for strong products
Paywall conversion (paywall view → subscription): 1-3% is typical
These are rough ranges. Your category, acquisition source, and product maturity shift them materially.
Common conversion funnel bottlenecks
Recurring patterns I diagnose in session replays:
Unresponsive buttons on mid-range Android (the devices your team doesn't test on)
Error messages that don't tell users how to recover (especially on passwords, payment, verification)
Forms that lose data on error (users abandon rather than re-enter everything)
Modal dialogs that steal focus mid-flow (consent banners, upsell popups)
Unclear visual hierarchy on pricing pages (users can't tell which option to pick)
Slow page loads at critical steps (every 100ms of latency at checkout costs ~1% of conversions)
ATT permission prompts firing too early on iOS (kills cross-session attribution)
Confusing progress indicators (users don't know how many steps remain)
Optimize your conversion funnels with UXCam
UXCam is a product intelligence and product analytics platform that automatically captures every user interaction on mobile apps and websites, no manual event tagging. Funnel Analytics tracks multi-step conversions and shows exact drop-off points. Session replay is one click away from any funnel step, so you can watch the users who bailed. Tara, UXCam's AI analyst, processes sessions to surface the specific friction causing drop-off and recommends actions, giving product teams the answers they need without waiting on analysts and the evidence to convince stakeholders.
Costa Coffee increased registrations by 15% after UXCam's funnel + session replay revealed a password-error issue. Housing.com grew feature adoption from 20% to 40% by watching 50-100 sessions daily. These are the kinds of fixes that show up once you pair funnel metrics with behavioral observation.
Installed in 37,000+ products, mobile-first, web-ready. Request a demo to see it for your app.
Frequently asked questions
What is conversion funnel analysis?
Conversion funnel analysis is the practice of measuring how users progress through a multi-step flow (like signup, checkout, or onboarding), identifying the steps with the highest drop-off, and diagnosing what specifically causes users to leave. The goal is to find and fix the one or two "leaky" steps that are costing the most conversions, rather than trying to optimize the whole funnel uniformly.
What is a conversion funnel?
A conversion funnel is a sequence of ordered steps users follow to complete a business goal. Typical examples: ecommerce checkout (browse → cart → checkout → payment → confirmation), SaaS signup (landing → form → verification → activation), mobile onboarding (install → register → complete tutorial → first action). The "funnel" shape comes from most users dropping off at each step, so fewer make it to the end than started.
How do you analyze a conversion funnel?
Five steps. Define the goal. Map the user journey as ordered steps. Measure drop-off between each step. Watch session replays of users who drop off at the biggest leak. Form a specific hypothesis, ship a fix, re-measure. Tools like UXCam, Mixpanel, and Amplitude build the quantitative layer; session replay and Tara AI provide the qualitative diagnosis.
What's a good conversion funnel rate?
Depends on the funnel type. Ecommerce checkout at 65-75% is healthy. SaaS self-serve signup at 15-25%. Mobile onboarding at 30-50%. Free trial to paid at 3-7% for freemium products. These ranges vary by category and acquisition source, so benchmark against your historical performance first and industry benchmarks second.
What are common conversion funnel bottlenecks?
Unresponsive buttons on specific devices, error messages that don't explain how to recover, forms that lose data on error, modal dialogs that interrupt flows, slow page loads, and confusing progress indicators. Most bottlenecks are specific UX issues that session replay reveals, not abstract "users are confused" patterns.
What tools are best for conversion funnel analysis?
For product teams: UXCam (funnels + session replay + Tara AI in one platform), Mixpanel, or Amplitude for quantitative funnel measurement. Pair with session replay (UXCam, FullStory, Hotjar) for qualitative diagnosis. GA4 has basic funnel reports but is weaker for detailed product-side analysis. The best setup combines quantitative and qualitative in the same workflow.
How is conversion funnel analysis different from cohort analysis?
Funnel analysis measures progression through a specific flow (ordered steps). Cohort analysis measures behavior of grouped users over time (day-1 retention, day-30 retention, etc.). Both are useful. Funnels answer "where do users drop off in this flow?" Cohorts answer "how does this group of users behave over time?" Mature analytics practices use both.
AUTHOR
Silvanus Alt, PhD
Founder & CEO | UXCam
Silvanus Alt, PhD, is the Co-Founder & CEO of UXCam and a expert in AI-powered product intelligence. Trained at the Max Planck Institute for the Physics of Complex Systems, he built Tara, the AI Product Analyst that not only analyzes user behavior but recommends clear next steps for better products.


Related articles


Conversion Analysis
React Native Crash Reporting + Best Tools and Techniques
Learn how to improve your mobile app's stability with effective React Native crash reporting. Explore the top techniques and tools for monitoring and managing...


Tope Longe
Product Analytics Expert


Conversion Analysis
Flutter Performance Monitoring - Best Tools and Techniques
In this article, we'll introduce you to the top Flutter performance monitoring tools and demonstrate how UXCam can help you monitor your app's performance with...
Tope Longe
Product Analytics Expert


Conversion Analysis
How to measure, analyze, and reduce app churn
All the user acquisition in the world won't matter if you've got a high churn rate on your app. If you want to know why users are uninstalling or unsubscribing, tools like screen flow, heatmaps, and screen recordings can get users loving — instead of leaving your...
Tope Longe
Product Analytics Expert