Funnel Analysis Examples: How to Improve App Conversions


Running a successful application relies greatly on understanding user behavior and the different ways to improve their experience. Raising and/or maintaining your customer retention can be difficult, especially when we look at mobile applications. Their average retention rate drops from 25.3% to 5.7% after just 30 days.
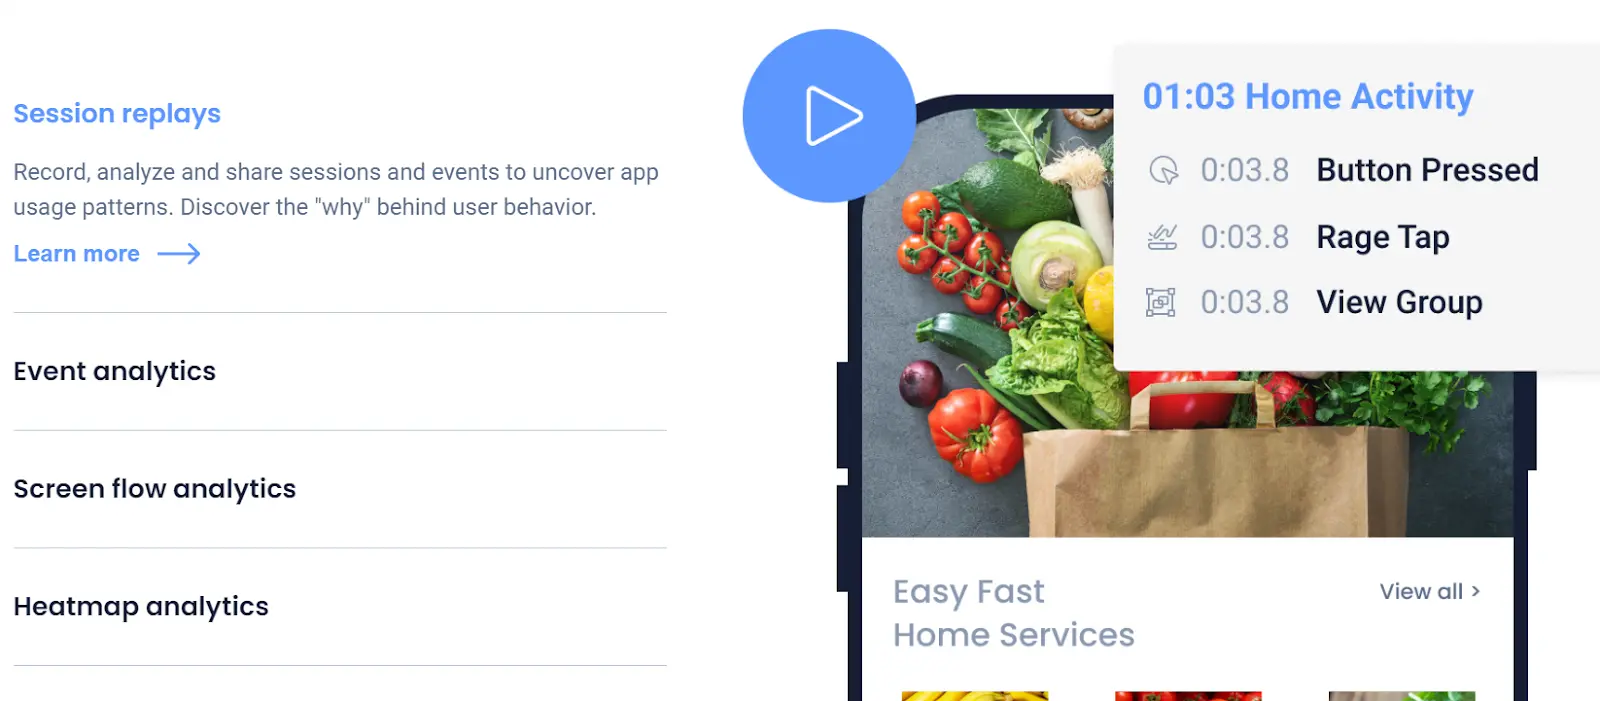
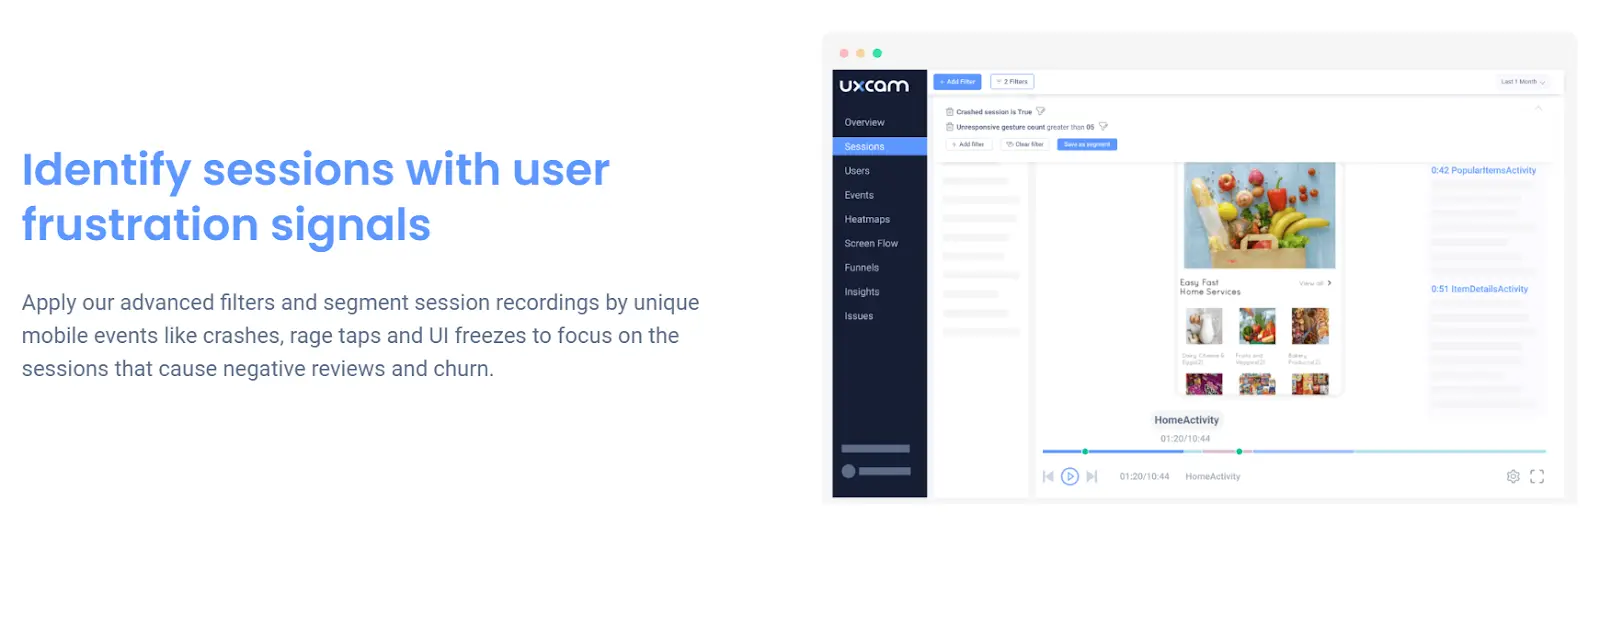
To learn why your customers stay or drop out, you can conduct a funnel analysis using UXCam. We provide various tools, such as Heatmap Analytics and Session Replays, to give you an insight into user activity on your app. But before you start, let’s first go through what exactly a funnel analysis is.
What is funnel analysis?
Funnel analysis is a method of visually displaying user behavior and the steps customers take to reach a certain goal. These goals are usually actions you want customers to take on your application, such as making a purchase or filling out their information.
Funnel analysis looks at the individual steps involved with making a purchase — for example:
Downloading your application
Starting the application
Making an account
Selecting a product
Completing the purchase
Funnel analysis shows you how many users achieved each step and how many drop out (aka churn) along the way. Most of all, this will help you determine the reasons behind their actions.
After you get used to the process, you can repeat it for any goal and turn the data into visual charts, which will be separate for the different user groups. For example, you can conduct a funnel analysis for new users and long-term users and then compare the two.
Different funnel analysis tools
Each company and mobile app have different requirements for the perfect funnel analysis tool. This is why it’s essential for teams to try out various options and choose the best one for them.
For your convenience, we have compiled a short list of the best funnel analysis tools.
UXCam


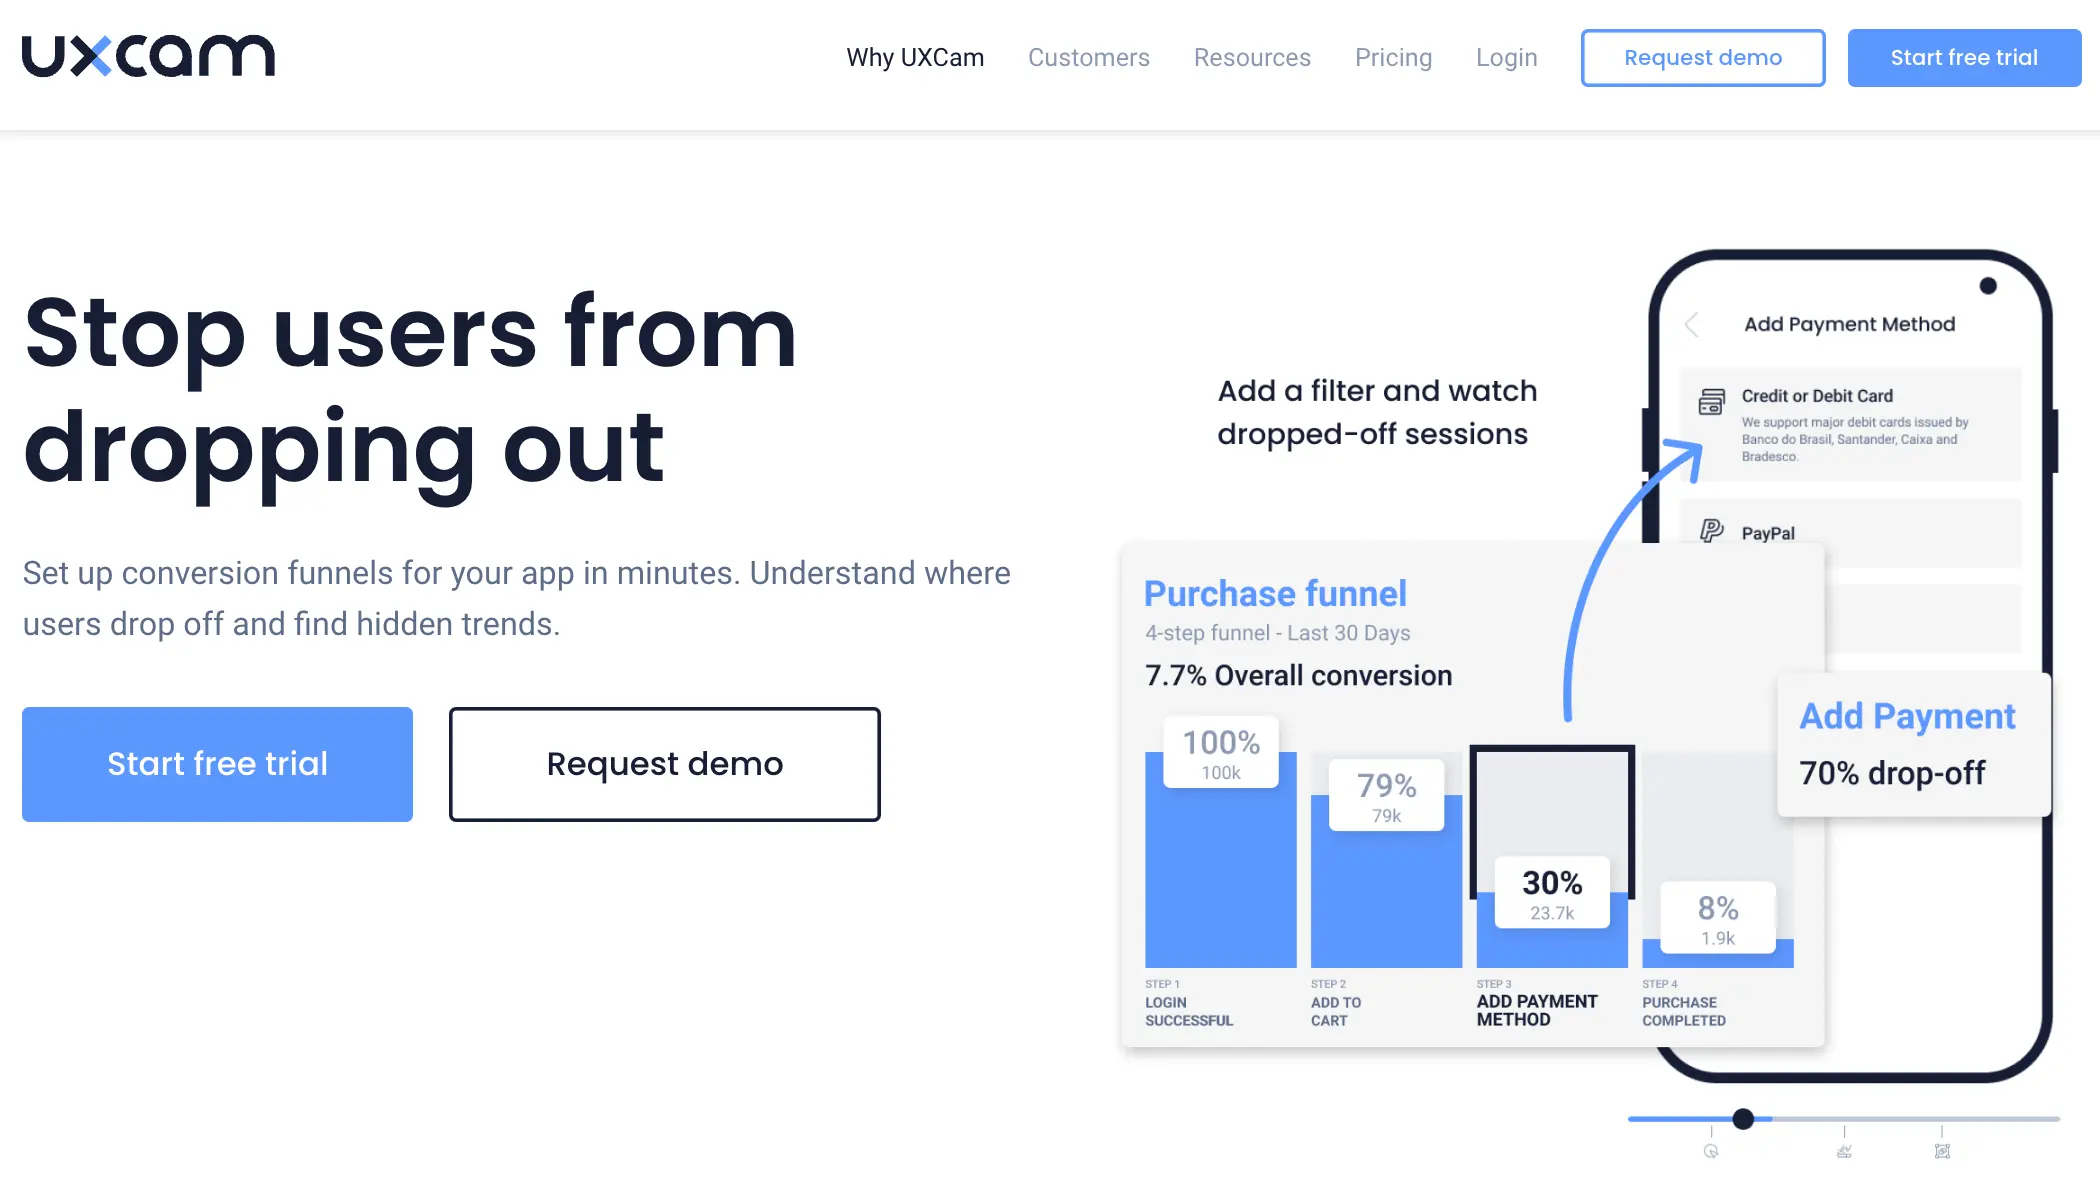
UXCam is an experience analytics tool designed for mobile applications. They offer a variety of tools, such as Heatmaps and Screen Flows, that give you an insight into user behavior. You can easily create multi-step funnel analysis charts and filter your results by device type or other factors.
Google Analytics


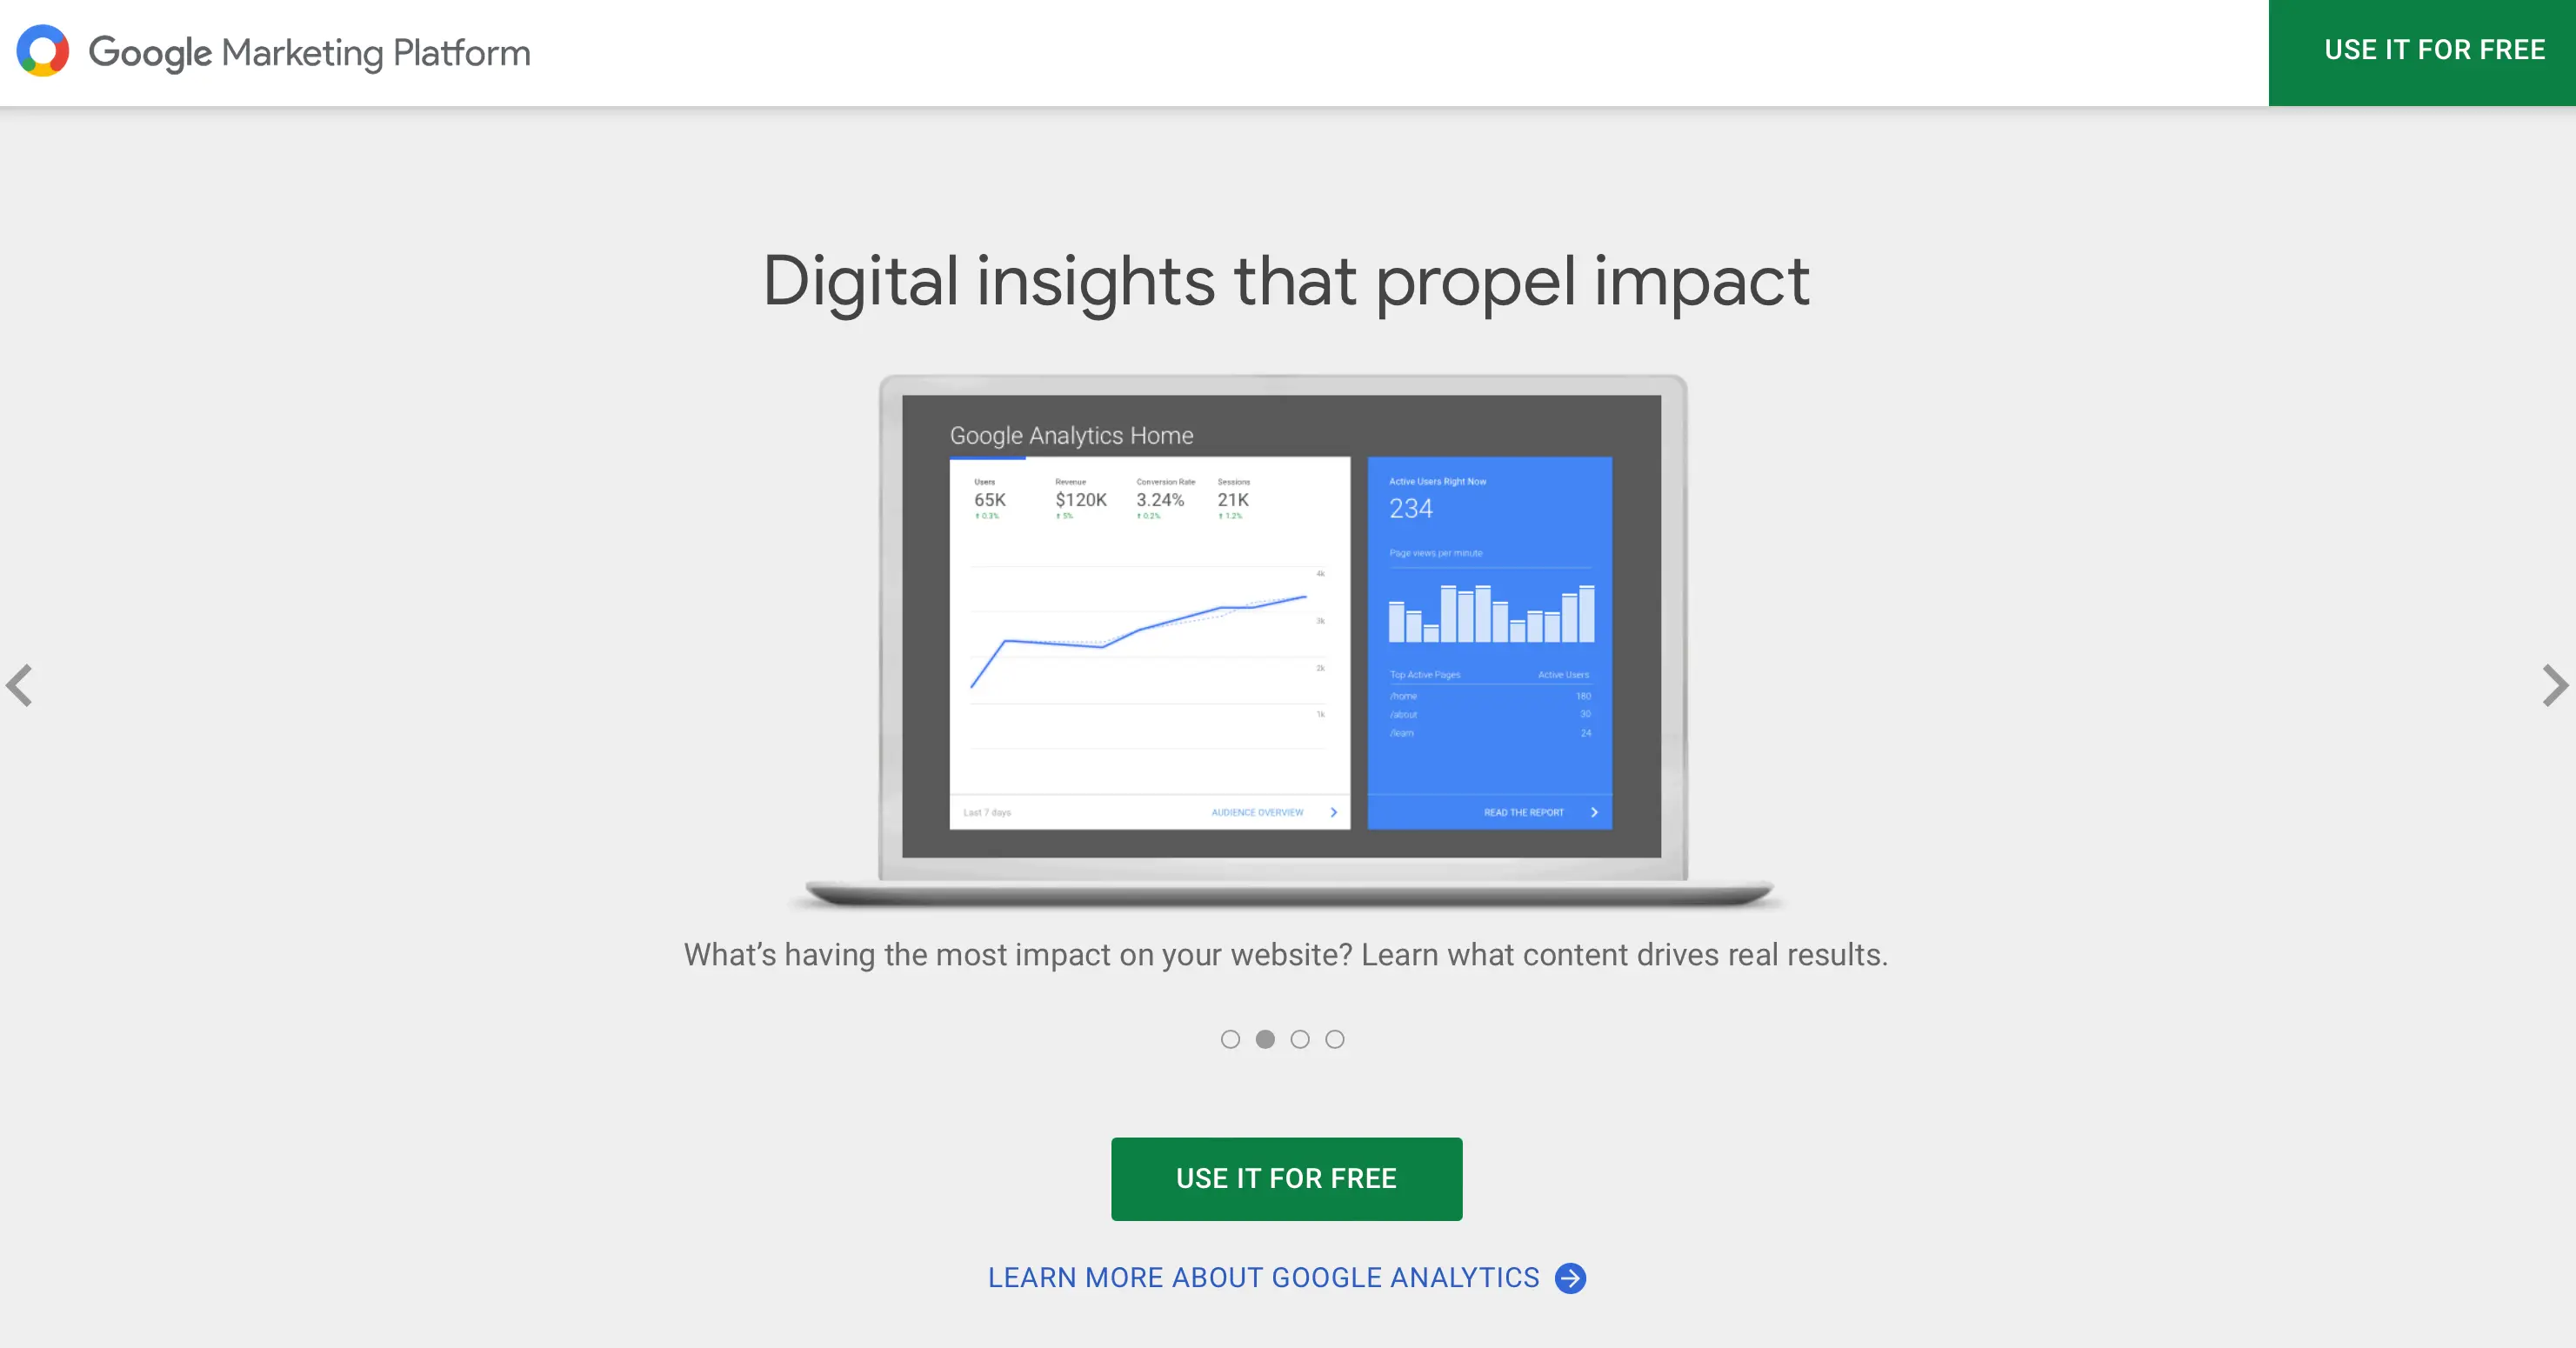
Google Analytics is a free analytics tool that gives you insights into app or website performance. You can create funnel analysis reports and view detailed analytics about your user churn rate.
Amplitude


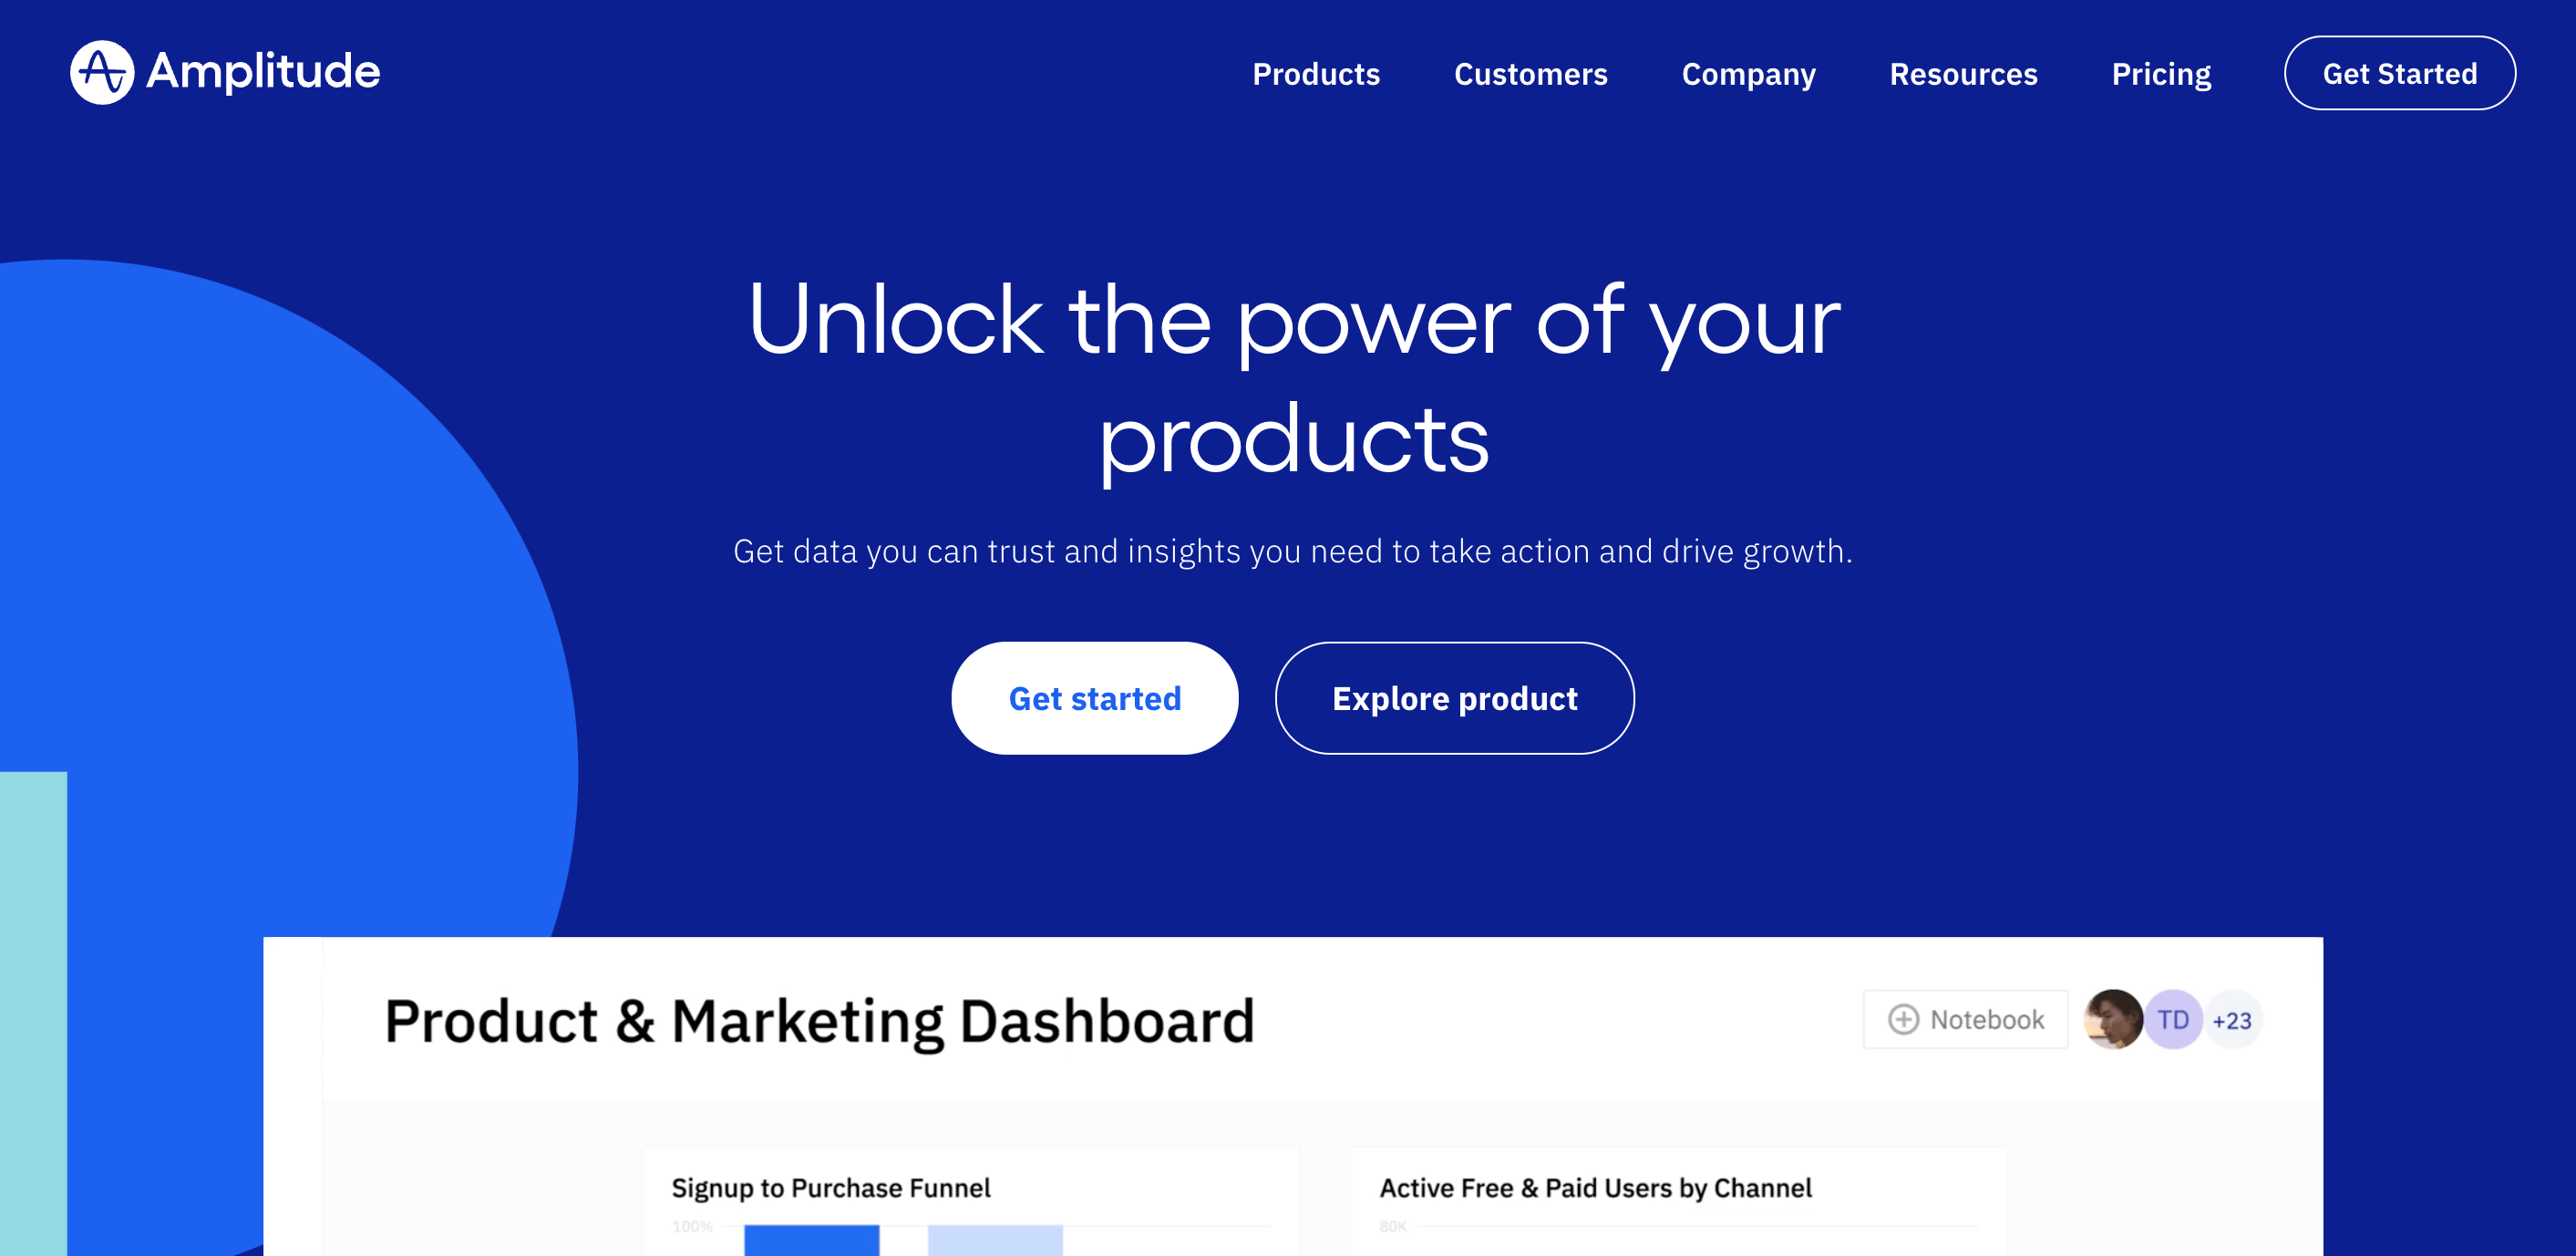
Amplitude is a product analytics tool for both websites and applications. You can create funnel analysis charts and set parameters, such as conversion windows, to filter your results. You can also compare your charts to the previous ones you made.
Benefits of funnel analysis for your mobile app product
Improve conversion


Funnel analysis charts let you see where customers usually leave or drop your app. Knowing the problem is the first step towards fixing it, which can ultimately improve your app conversion rate. You can also learn how to encourage users to achieve certain actions and increase overall conversions within the app.
Determine where you can improve
You can use behavioral analytics to gain insight into why users fail to reach a specific goal. For example, let’s say one of your goals is to get users to make an account. Your funnel analysis chart shows that many customers leave at the ‘username input’ stage.
This implies that there are issues with the username mechanic, which gives you a specific area to focus on.
Find the high-traffic, high-exit pages where people are leaving
You can view which specific pages receive the most traffic yet also have the highest churn rate. Analyze the reasons behind so many users dropping out, and work to fix those issues to reduce their churn. Customer analytics helps you discover the most glaring issues so you can quickly solve them before they become detrimental.
Funnel analysis examples for mobile app products
In this section, well explore examples of how to use funnel analytics to convert mobile app users
Define metrics
Identify the key touch points that lead to conversions
Perform in-depth analysis by segmenting users
Analyze the data
Step 1 - Define your metrics
First of all, you have to decide what app engagement metrics you want to use in your funnel analysis. This will help you narrow down which conversions or goals to focus on when creating your chart. The metrics you decide on ultimately come down to your marketing goals.
For example, if you want to increase sales, you should be looking at customer purchases or store page visits. You can use UXCam to track user engagement through various means, including watching recorded sessions or viewing rage tap counts.


Step 2: Identify the key touch points that lead to conversions
Next, you must break down your chosen conversions into steps. Look at the main steps a customer needs to take in order to reach that goal. For example, if the goal is to link a social account, these would be the steps:
Start application
Go on settings
Select ‘link an account’
Choose a social platform
Sign into social account
If you have key areas you’re looking into, such as your user interface, try to include steps related to that area. For example, if you’re testing how intuitive your UI is, include steps that involve users navigating between different options.
User journeys
If multiple ways exist to achieve one conversion, create separate funnel analysis charts for the most popular methods. UXCam can help here. You can use our Heatmaps or Screen Flows to see which buttons or pages users interact with the most.


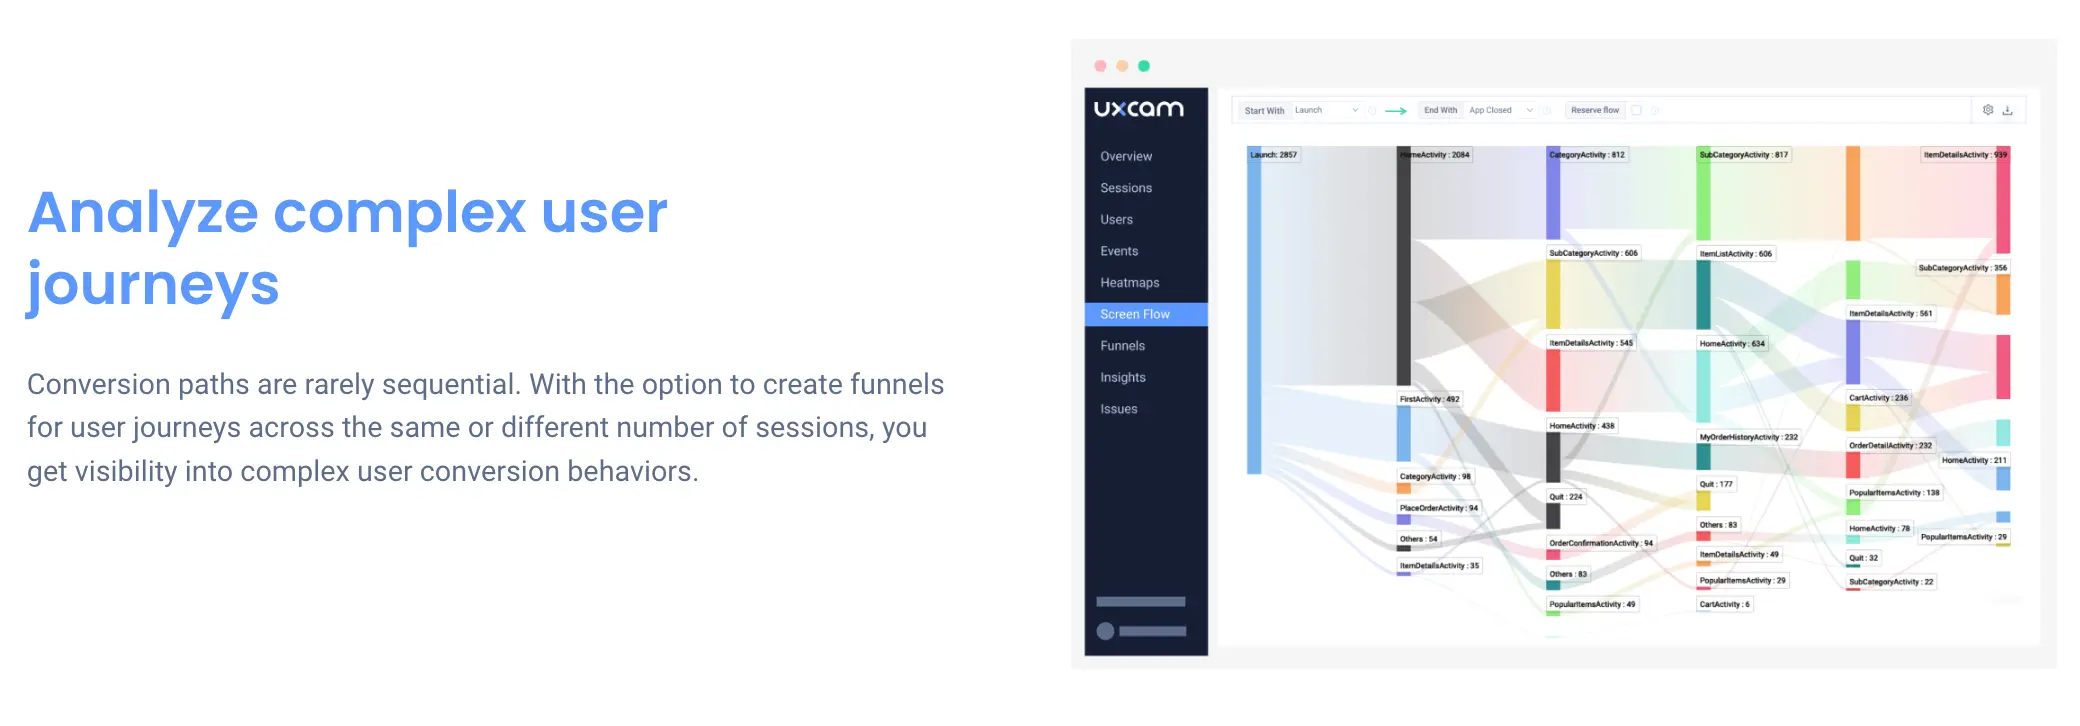
User journeys don’t always follow a straightforward pattern, so you should consider more than just the simplest method. You can also try using the AARRR model created by Dave McClure to estimate your average user journey. This model lays out the five steps a user typically goes through:
Acquisition
Activation
Retention
Referral
Revenue
You can expand on these steps to create a user’s journey:
Acquisition: They find your app in the app store and download it.
Activation: They open your app and start using it.
Retention: They return to your app.
Referral: They recommend the app to their friends.
Revenue: Profits from the app increase.
You can rework these steps to better suit your own application and its conversions. This method won’t work for all situations, but it’s a good starting point.
Funnel conversions
Once you’ve decided on a set of steps, use UXCam to turn them into conversion funnels. This will create a funnel analysis chart, where each step has its own percentage of users.


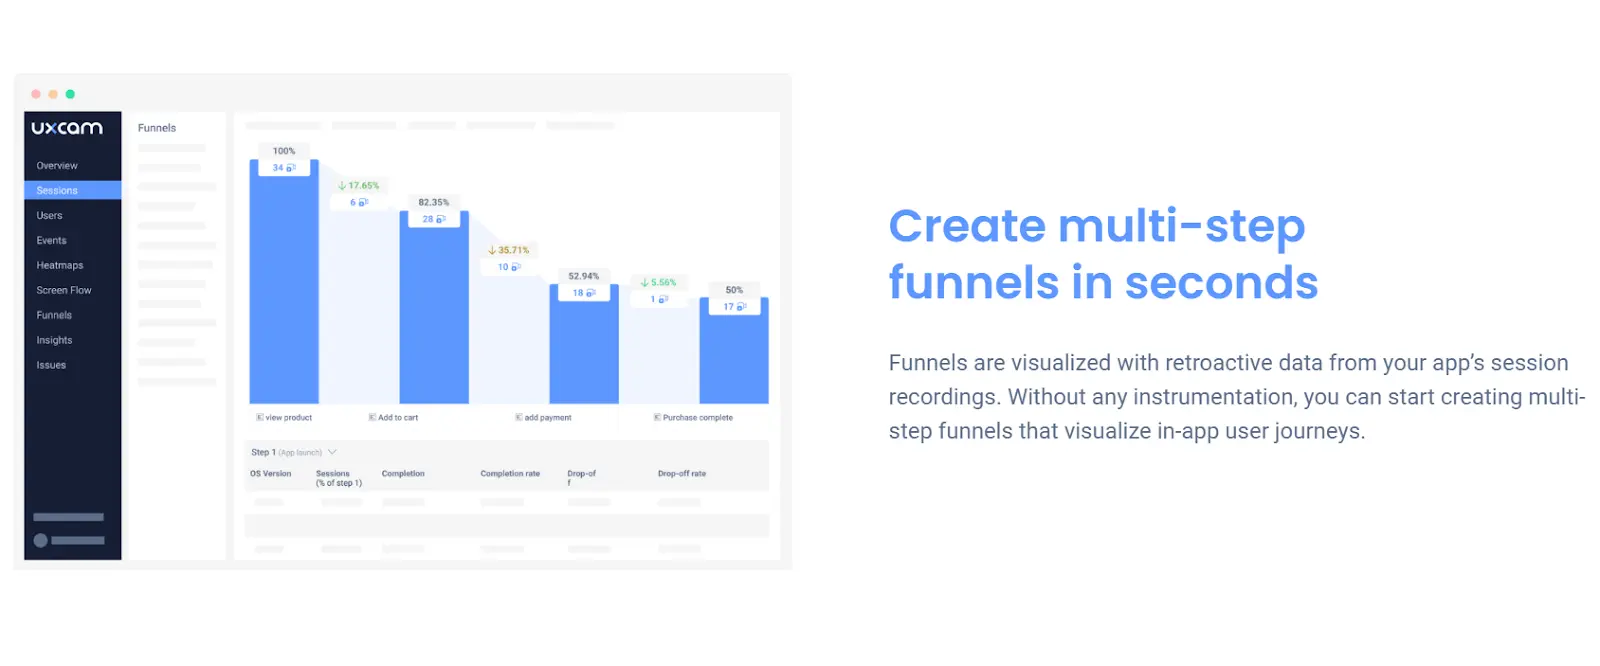
You can view the drop-off rate between steps to understand your overall churn. The highest drop-off rate will be highlighted in orange to make it easier for you to find.
Step 3: Perform in-depth analysis by segmenting users
Now that you’ve got the framework for your funnel analysis chart, it’s time to filter results by different user groups. Segment your users based on factors such as:
Age demographic
Location
Device type
Conversion window
Gender
Account age
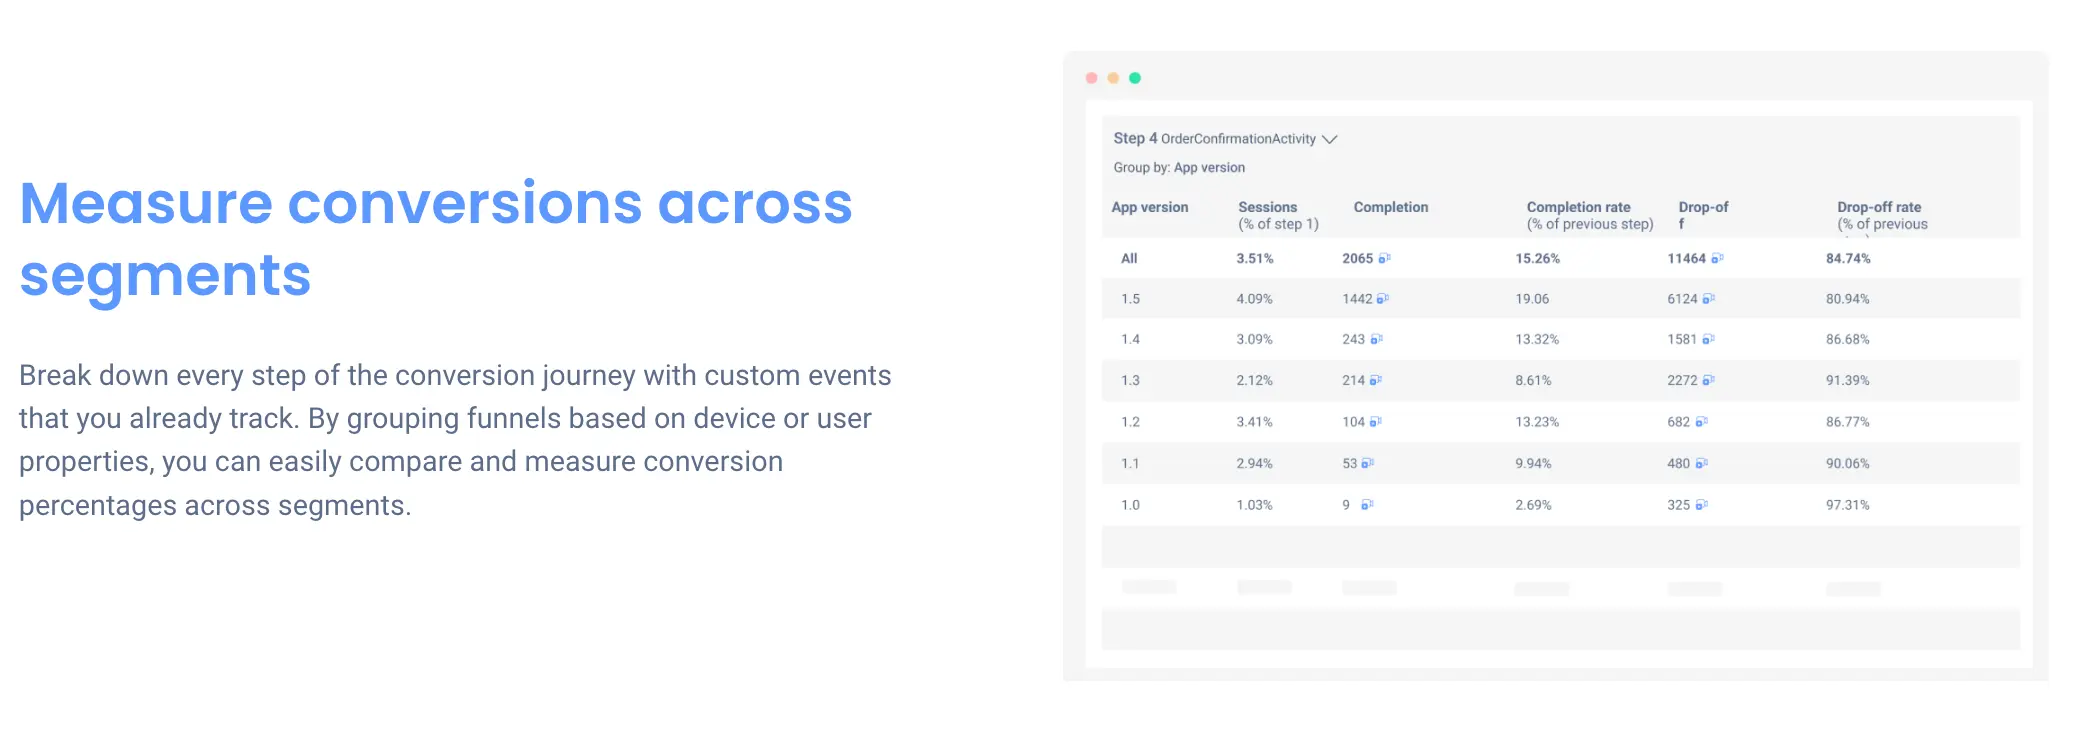
Segmenting users allows you to get a deeper understanding of your customers and how different people interact with your app. You can compare your funnel analysis data across various groups using UXCam.
Look at the different completion and drop-off rates and see which groups have the lowest conversion rates. This data should help you devise effective strategies for improving app conversion and retention in the future.
Step 4: Analyze the data
Churn rates
Finally, it’s time to analyze all your funnel analysis data. There are a few things to look out for depending on your situation, but generally, churn rate is one of the most important metrics to focus on. You need to know where you’re losing the most customers and start analyzing why that might be.
View recorded sessions of users on UXCam that dropped off to investigate reasons behind their behavior.


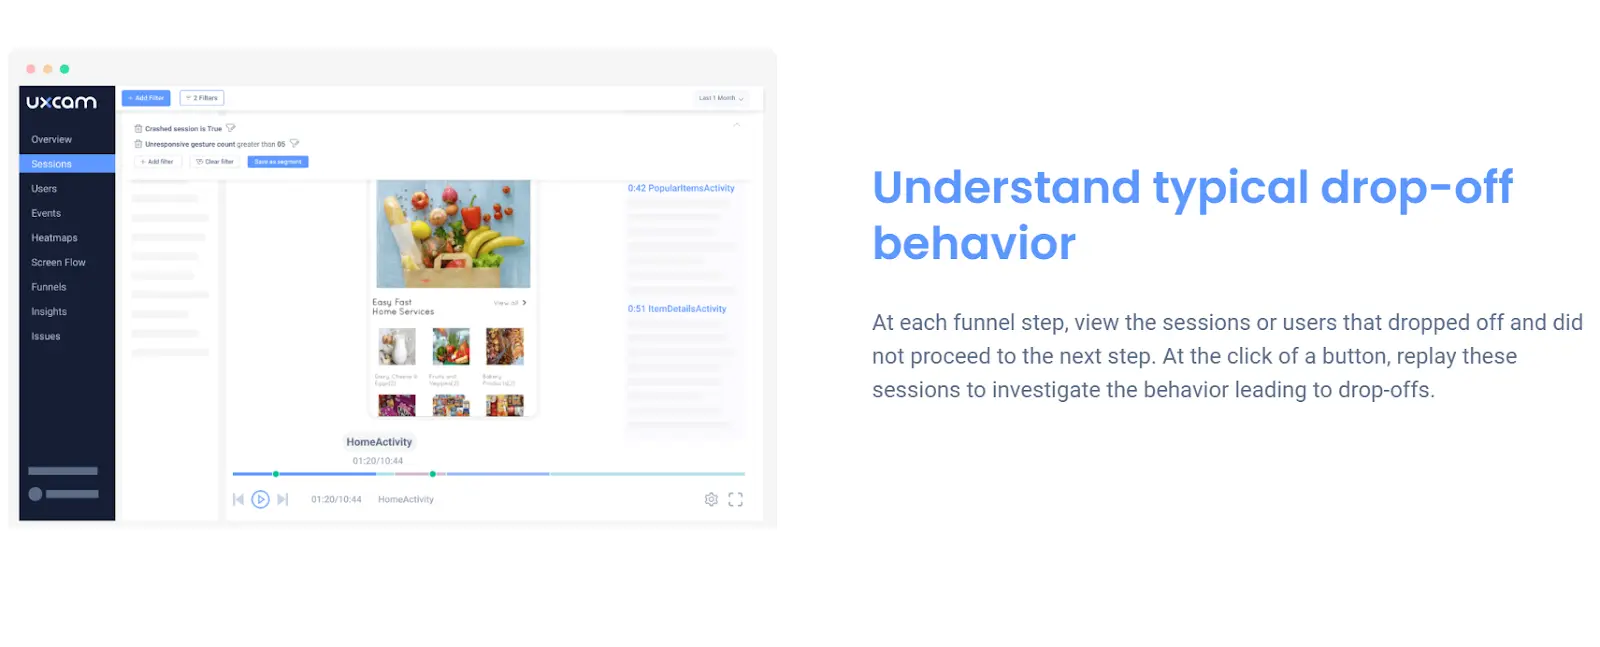
Look at your funnel analysis chart and locate any large drop-off rates. Inspect the areas where these large drop-offs occur for any issues, and note them down for later. You should come up with ways to improve the UI and overall user experience (UX) to reduce churn.
After implementing changes to your app, conduct another funnel analysis to see if drop-off rates have improved. You can compare the data against past analysis charts to spot the differences.
Completion rates
You should also look at completion rates to see how many users actually achieved conversions. If there are any particularly high completion rates, analyze areas where they occurred. Determine why particular areas retain customers better than others by comparing them.
Time-delay between steps
You should also pay attention to time delays between each step in your funnel analysis. You can filter recorded sessions on UXCam by issue, such as crashes or rage taps, to discover possible time delays.


Delays between steps could be due to struggles with the interface causing users to bounce off. So, it’s important to quickly locate such issues and fix them as soon as possible. The more efficient the conversion process is, the less likely users are to drop off.
Segmented groups
You should analyze the different churn rates between segmented groups and see if user demographics have a big impact. For example, if certain age groups drop off early in the conversion, you can analyze their behavior in particular. You can identify why they dropped off, which will help you when developing solutions to keep them onboard.
Conclusion
Funnel analysis is a useful method for visualizing user behavior and churn rate. You can narrow down what causes users to leave your app and save yourself a lot of time when developing solutions to those issues. And remember, you can create detailed funnel analysis charts using UXCam, and easily locate your biggest churn rates.
Request a free demo or start your free trial today to start gaining insights into customer behavior.
You might also be interested in these;
How to Build an Effective Product Funnel
Beginner's guide to conversion funnels
How to Use Mobile App Funnel Analysis to Convert More Users
Conversion Funnels for Product Managers and Marketers
Funnel Drop-Off Rates - Benchmarks & Strategies to Improve
AUTHOR
Tope Longe
Product Analytics Expert
Ardent technophile exploring the world of mobile app product management at UXCam.


Related articles

Mobile app analytics
12 Mobile App Analytics Metrics That Actually Matter in 2026
Mobile app analytics metrics are the quantitative signals product teams use to measure performance, engagement, and...


Silvanus Alt, PhD
Founder & CEO | UXCam


Mobile app analytics
Mobile App Retention Benchmarks by Industry (2026)
Mobile app retention benchmarks for 2026, broken down by industry. Day-1, day-7, day-30 retention rates for fintech, ecommerce, social, gaming, and more,...
Silvanus Alt, PhD
Founder & CEO | UXCam


Mobile app analytics
Sentry vs Datadog: Features, Pricing, and Which One Fits Your Production Stack
Sentry vs Datadog compared head-to-head on features, pricing, and the production stacks each one...
Silvanus Alt, PhD
Founder & CEO | UXCam