12 Best Customer Analytics Tools and Platforms 2026

The need for improved customer experience has given rise to the innovation of various customer analytics tools.
To give your customers the best experience possible requires that you keep track of how they interact with your product or service. This means using the right software to determine who your customers are, their wants and needs, what makes them tick, their struggles, and common traits. In this article, we've compiled a list of the best customer analytics software and tools to help you deliver the best user experience and maximize ROI.
What are the best customer analytics tools?
The top customer analytics software reviewed in this article are UXCam, Amplitude, Google Analytics, Mixpanel, Woopra, Hotjar, Crazy Egg, Zoho Pagesense, Brandwatch, Zendesk, GainSight, and ChurnZero. Below, you’ll learn why these tools are trusted by thousands of businesses worldwide and gain insights to select the one that best suits your requirements.
Summary - Customer Analytics Tools
| Tool | Best For |
|---|---|
| UXCam | Mobile app analytics with quick setup and comprehensive analysis. |
| Amplitude | Understanding customer behavior across web and mobile platforms. |
| Google Analytics | Monitoring cross-device customer behavior; free website analytics. |
| Mixpanel | Insights into user demographics and behavior for optimization. |
| Woopra | Real-time customer journey analytics with segmentation. |
| Hotjar | Visualizing website user behavior through heatmaps and recordings. |
| Crazy Egg | Website optimization using heatmaps and A/B testing. |
| Zoho PageSense | Conversion rate optimization with A/B testing and funnel analysis. |
| Brandwatch | Social media monitoring to understand brand perception. |
| Zendesk | Customer support analytics to improve service quality. |
| Gainsight | Customer success management with health scores and automation. |
| ChurnZero | Reducing customer churn by analyzing engagement and satisfaction. |
UXCam
User Rating(G2): 4.7 / 5
Category: Mobile app analytics
Pricing:
Free Plan: Free Plan + Free Trial (14 days)
Paid Plan: Price is available on request


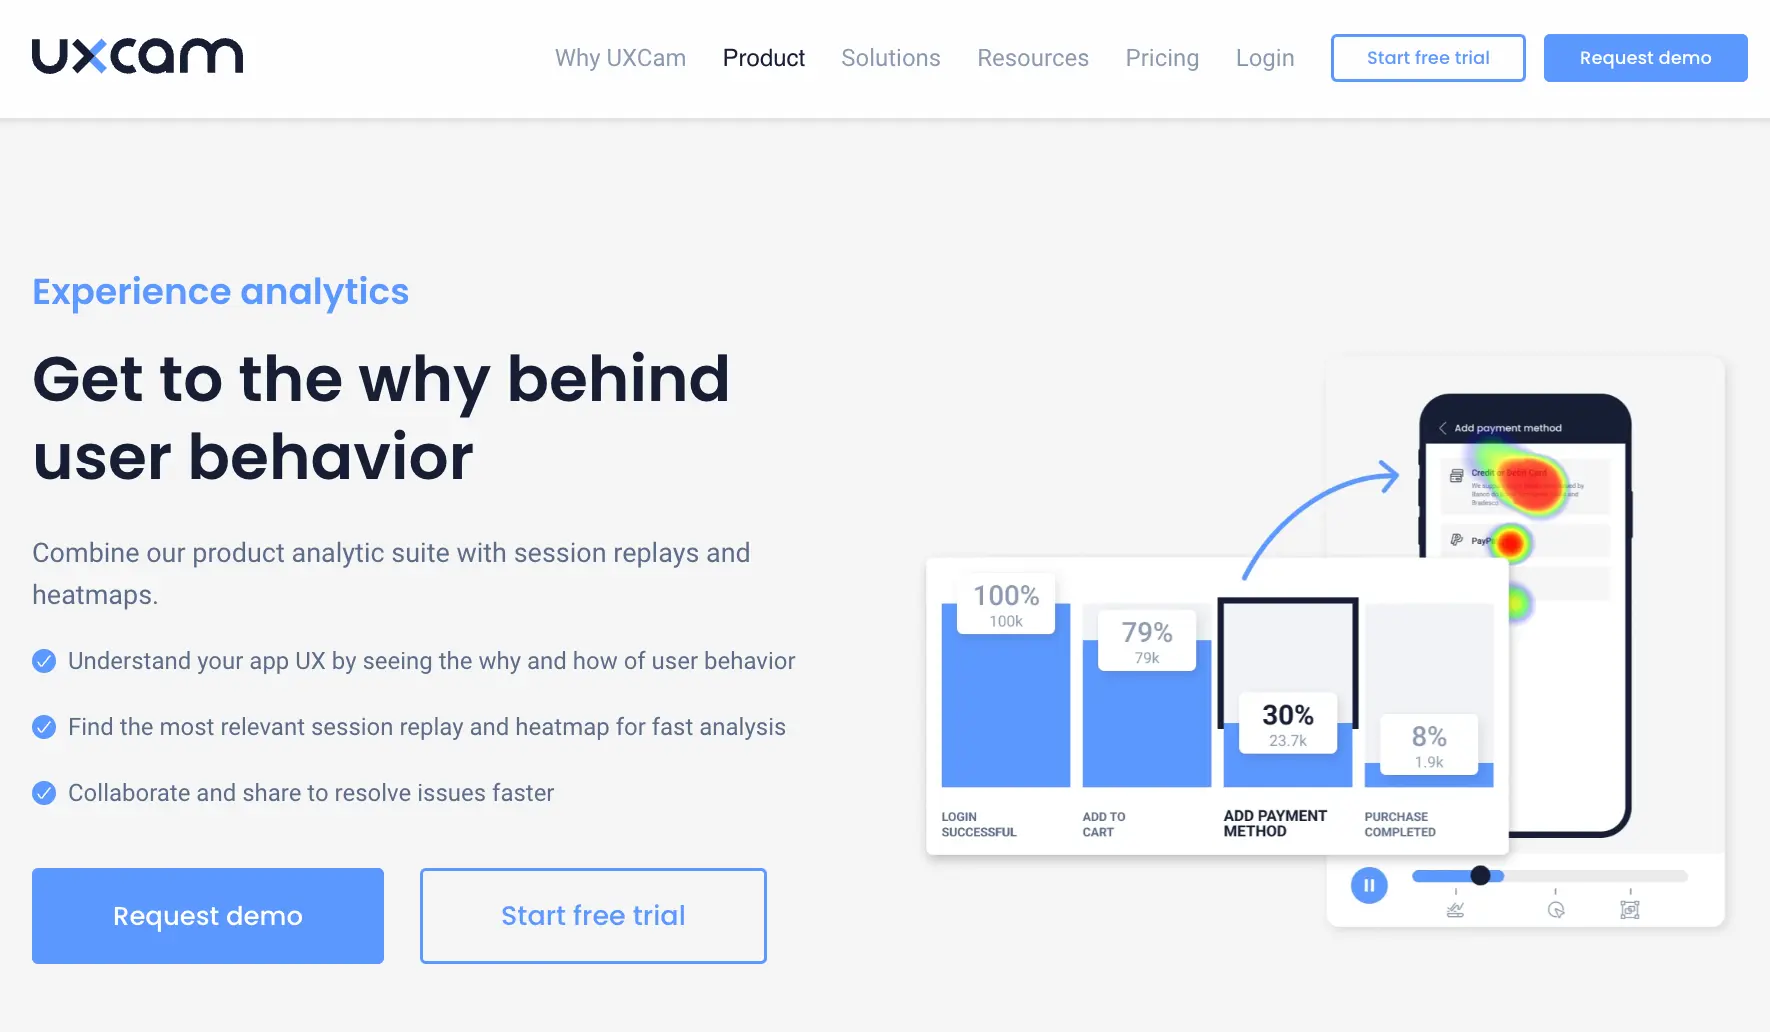
UXCam is a mobile app analytics tool that stands out for its record setup speed. In as little as 5 minutes, you’ll be on track to uncover actionable insights to deploy the perfect mobile app experience.
Below are a few other reasons why UXCam outshines other mobile analytics tools:
Auto-Capture: Save engineering costs and time for manual event setups without sacrificing data quality. UXCam collects user, device, behavioral, and performance data by observing all user gestures within your application and presenting them to you as retroactive data points.
Comprehensive Analysis: By combining quantitative and qualitative analytics with UXCam, you have the statistical and descriptive representation of user data. Do not stop at traffic numbers; collect data for every session, every screen, and every user - understand what they love about your app and what they don’t.
Compatibility: UXCam is compatible with native mobile apps (Android and iOS) and leading cross-platform mobile development tools (PhoneGap, React Native, Flutter, and Xamarin).
UX Improvement: Deep dive into your report to find the why behind metrics presented by clicking on the specific area of your report. Quickly figure out the root cause of the problem (could be screen flow, a bug, or crash) and work on a stable fix immediately.
Custom Dashboards: UXCam allows you to customize reports with filters like user properties, events, and screens. In your report library, you can observe what percentage of users are experiencing bugs or freezes and which devices, screens, and users are affected.
Features
Session Replay Analysis: Record all user sessions and replay at will to analyze the reason for certain user actions. Identify when and where users get stuck, spot usability issues, and proffer actionable solutions.
Heatmaps: Study how users engage with your app screens and check for possible signs of frustration. Filter by rage to find out which screens frustrate users and filter by unresponsive gestures to identify bugs.
Funnel & Segmentation: Group funnels based on preferred properties and compare conversion percentages across segments easily. Identify conversion blockers and reasons for user drop-offs and uninstalls and optimize accordingly.
Team Collaboration: Create labels and needful notes for your team; share ideas and explore solutions to improve your product experience.
User Analysis: UXCam provides a visual representation of user journeys that can help you understand the big picture and gradually drill down to individual user engagement, frustration, and navigation problems.
Pros & Cons
| Pros | Cons |
|---|---|
| Captures all user interactions in real-time | Limited free plan |
| Lightweight SDK | No A/B tests |
| Full security compliance | |
| Intuitive layout | |
| No technical knowledge required | |
| Integrates with multiple platforms |
Try UXCam for free — with 10,000 free monthly sessions and unlimited features.


Amplitude
User Rating(G2): 4.5 / 5
Category: Cross-platform product analytics (web and mobile apps)
Pricing:
Free Plan: Free (for up to 10M Monthly Event Volume)
Paid Plan: Contact sales for paid pricing


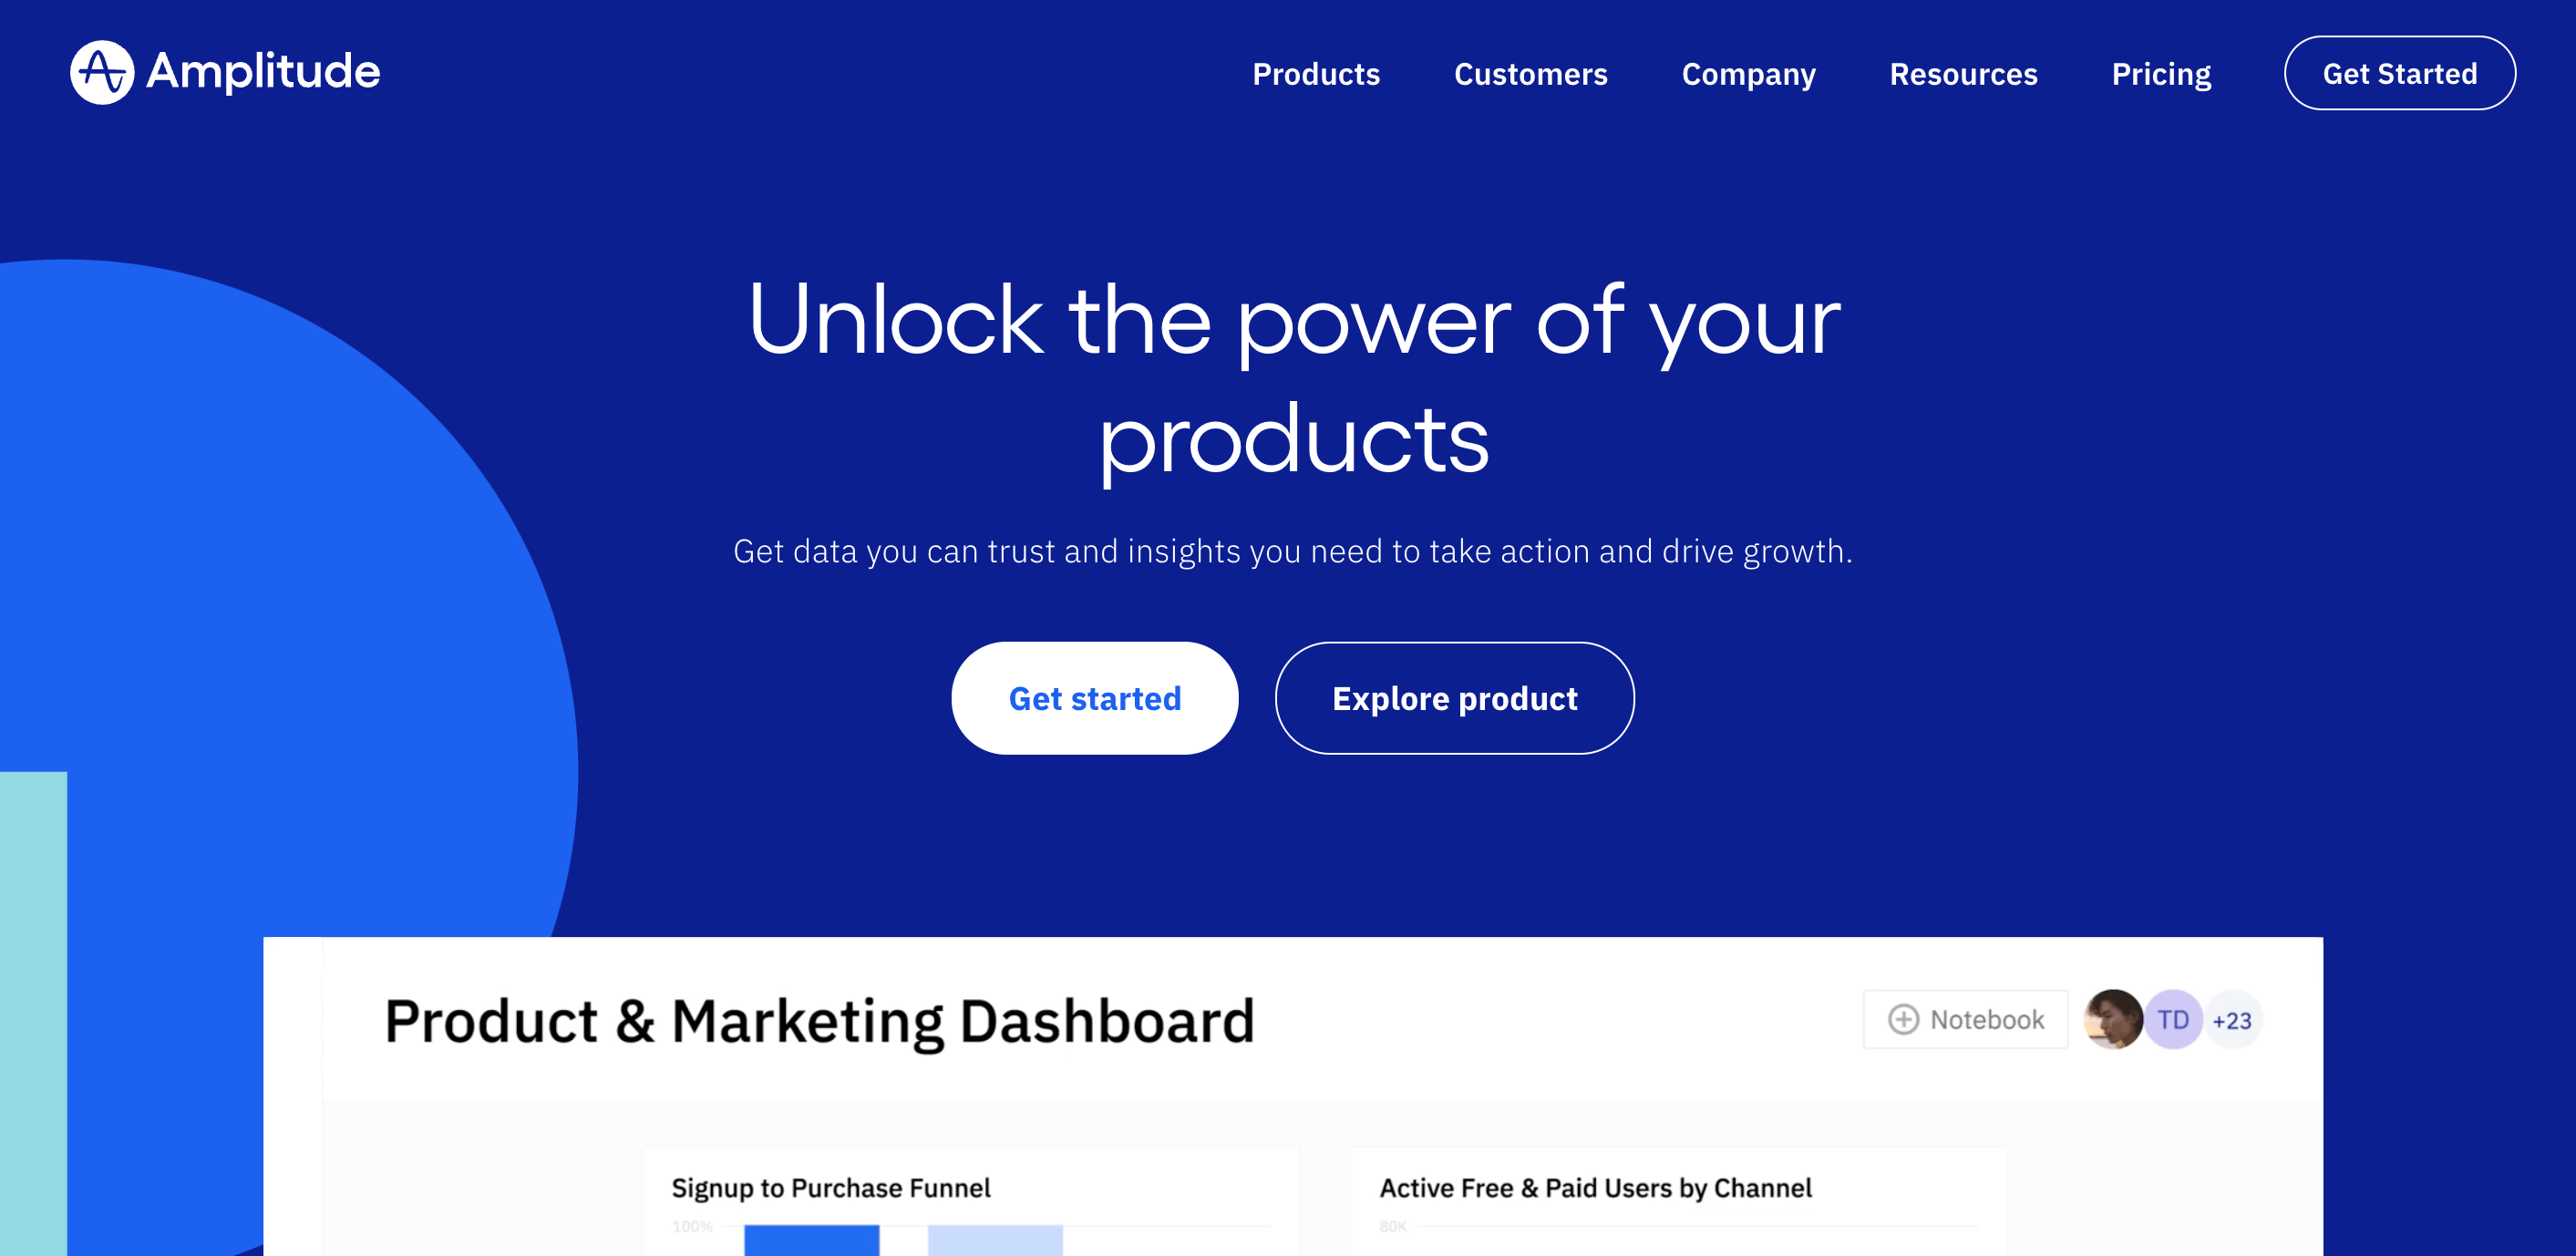
Amplitude is a product designed to help you understand customer behavior and product data. Customer behavioral graphs are derived by sorting through a series of random events across their digital journey to enable you to craft a narrative that improves retention and revenue.
Amplitude equips you with actionable insights to connect customer behavioral patterns and observe which ones lead them to convert or drop off along the way. Within this tool, you can collaborate, tag team members, make recommendations, and tie them to outcomes that really matter.
Features
Automated reports
Scalable analytics
User segmentation
Real-time analytics
User journey
Attribution modeling
Pros & Cons
| Pros | Cons |
|---|---|
| Visual query building | Complex deployment and integration |
| App uninstall information | Difficulty manipulating data |
| Error tracking | Split testing problems (only available through a third-party integration) |
| Data visualization |
Google Analytics
User Rating (G2): 4.5/5
Category: Cross-platform product analytics (web and mobile apps)
Pricing:
Free Plan: Completely free
Paid Plan: If you are a large enterprise in need of advanced customization and direct support, you can pay for Analytics 360 by contacting the sales team. The speculated amount for this is $12,500/month.


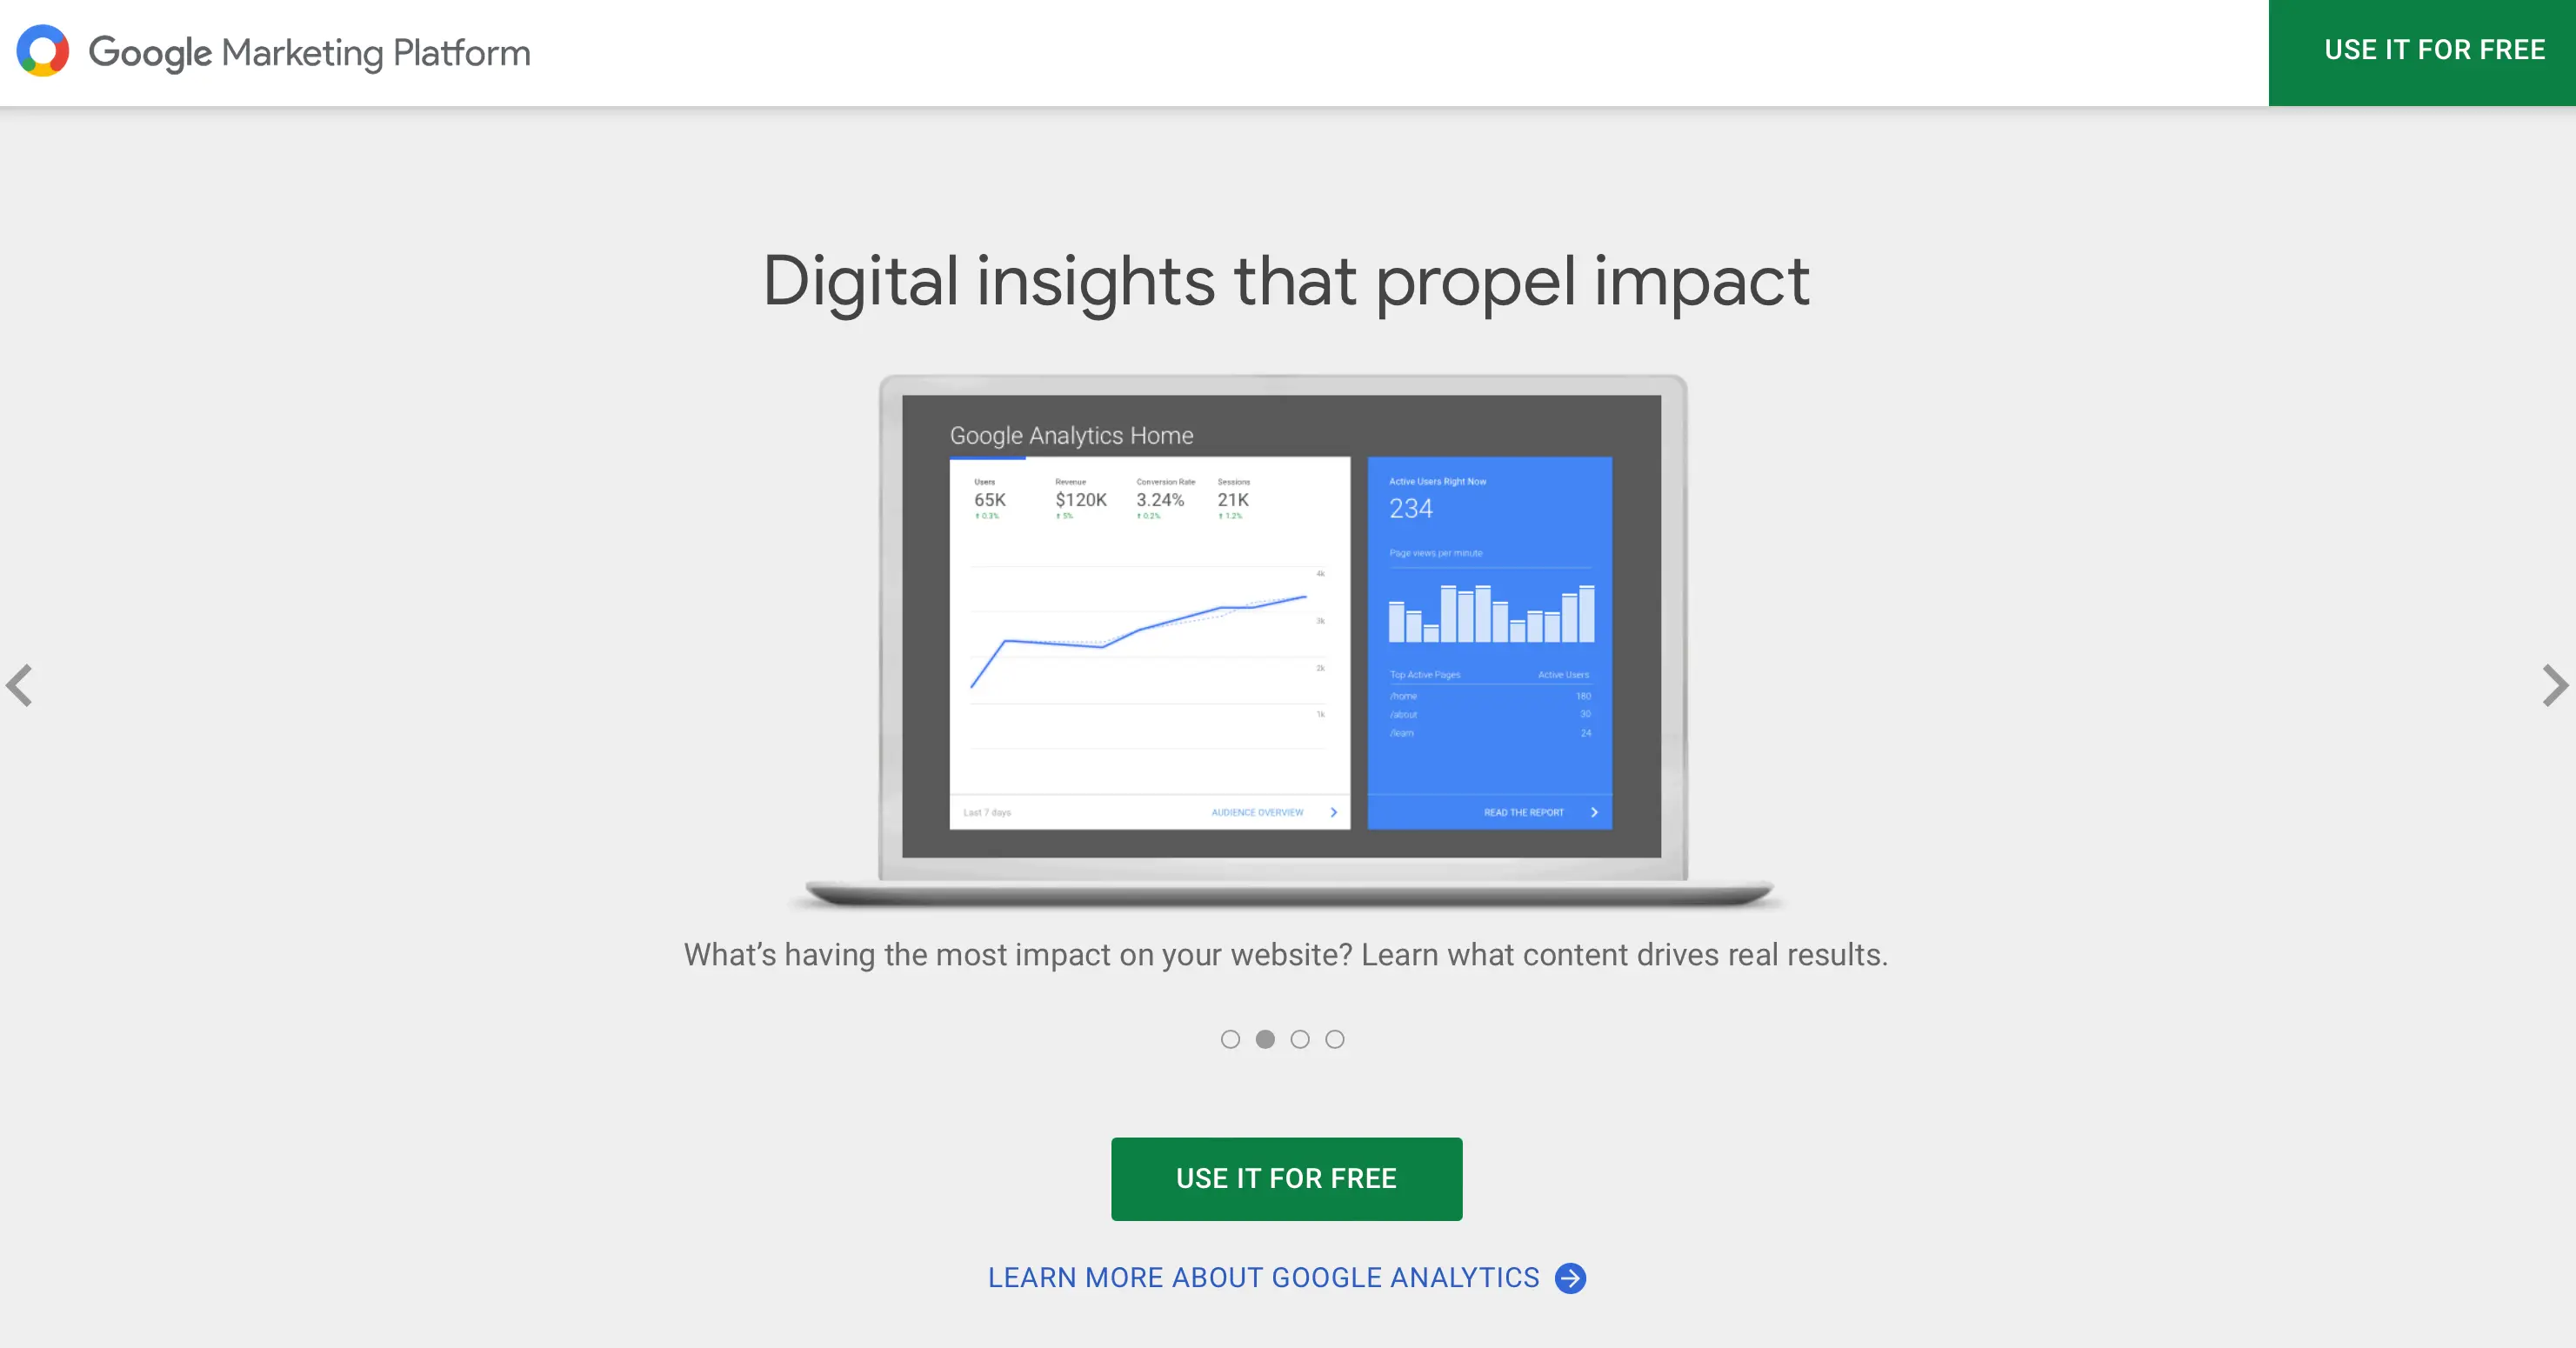
Google Analytics is the most popular website analytics tool, with over 28 million active users worldwide. This tool helps you monitor your customer behavior across different devices and platforms.
It provides needful customer insights to understand your audience better and predictively improve your marketing ROI – all for free.
You can customize your reports to capture only relevant metrics for your business goals at the time.
You can also use google analytics to track your mobile application and gain insight into user acquisition and engagement. Their SDKs are easy to add to Android and IOS applications to start logging events.
Features
Daily traffic reporting to help you understand the number of people that consume your content or respond to your campaigns. You can monitor trends over time to have a broad picture of the effects of your marketing decisions.
Understand customer journeys before and after they land on your page. Gain insights from third-party referrals to draw a pattern around where your users hang.
With Google Analytics, you can see keywords used to look up your website or content. This can improve SEO massively as it exposes the keywords to double down on and ones to improve.
Measure in-app payments and revenue(for mobile app tracking)
Pros & Cons
| Pros | Cons |
|---|---|
| Google Analytics is free, which makes it invaluable for small businesses with a minimal budget. | Google Analytics lacks features suitable for enterprises. They have a new solution for enterprises called Analytics 360 – the price for this is $12,500/month and $150,000/year. |
| Installation is beginner friendly. | It provides users with only quantitative data, which is insufficient for business decisions. |
| Due to the fact that this has been widely adopted, various other tools have a provision to integrate seamlessly with Google Analytics. | Limited customization possibilities. |
| For large traffic websites, google analytics uses sampling to report data – this gives rise to discrepancies in results. | |
| Weak customer support. |
Mixpanel
User Rating (G2): 4.5/5
Category: Cross-platform product analytics (web and mobile apps)
Pricing:
Free Plan: Free plan with limited features
Paid Plan: Starts at $25/month at 1K Monthly Tracked Users


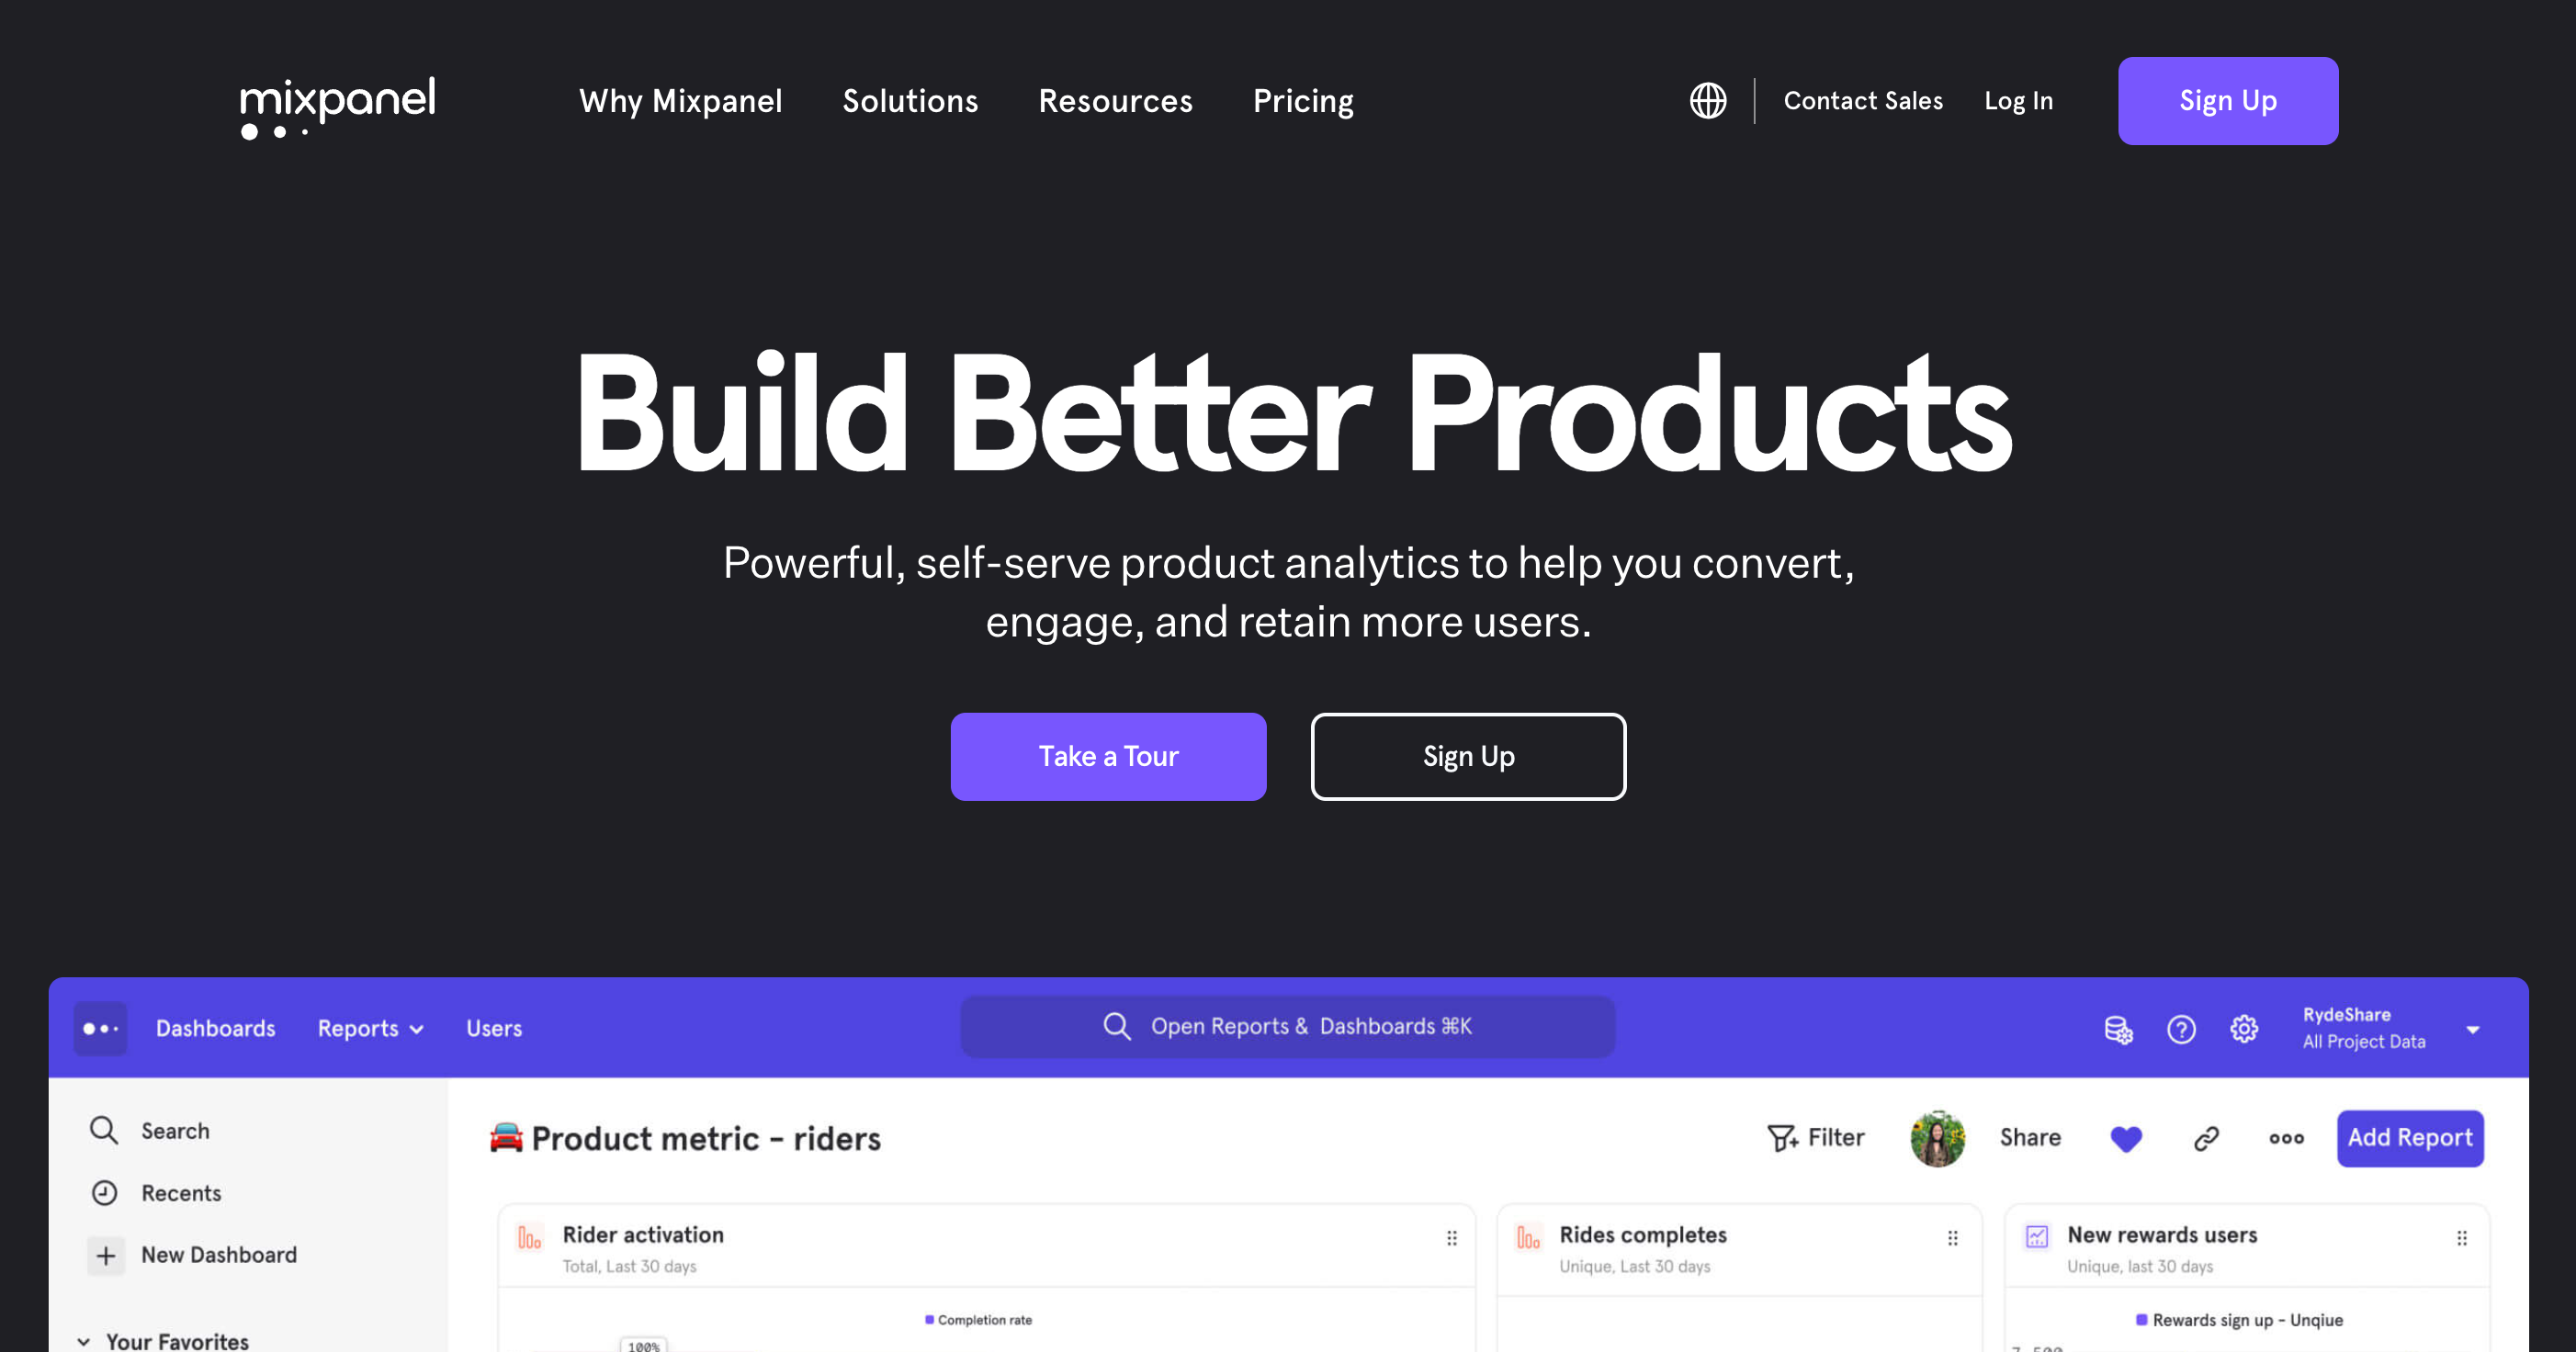
Mixpanel is an excellent tool for gathering insight into user demographic and behavior on your website and mobile application optimization.
It possesses many features, including tracking user interaction, generating custom reports, and analyzing your product for conversion, usage, and retention rates.
Another fantastic feature of Mixpanel is the ability to break down user actions into segments and create funnels to understand user interaction on your application.
When you have this much information on your users, it’s pretty easy to make optimization decisions that help improve user experience and increase your ROI.
Features
User retention report
User drop-off information
Feature popularity report
Power Users Recognition
Pros & Cons
| Pros | Cons |
|---|---|
| Importing data from other tools is pretty easy across 50+ platforms. | Mixpanel can be complex to set up, especially for those unfamiliar with data analysis. |
| Monitor all your product’s KPIs in one place. | When tracking enormous data, Mixpanel’s performance tends to fluctuate. |
| Get your stakeholders/team involved in metric changes through their slack integration or share the results with them. | Complex configuration compared to similar tools. |
| Set alerts for changes in metric trends. | High-cost subscription fees. |
| Dive deep into retention data and optimize accordingly to reduce churn. |
Woopra
User Rating (G2): 4.4/5
Category: Cross-platform product analytics (web and mobile apps)
Pricing:
Free Plan: Free plan with limited features
Paid Plan: Starts at $999/month


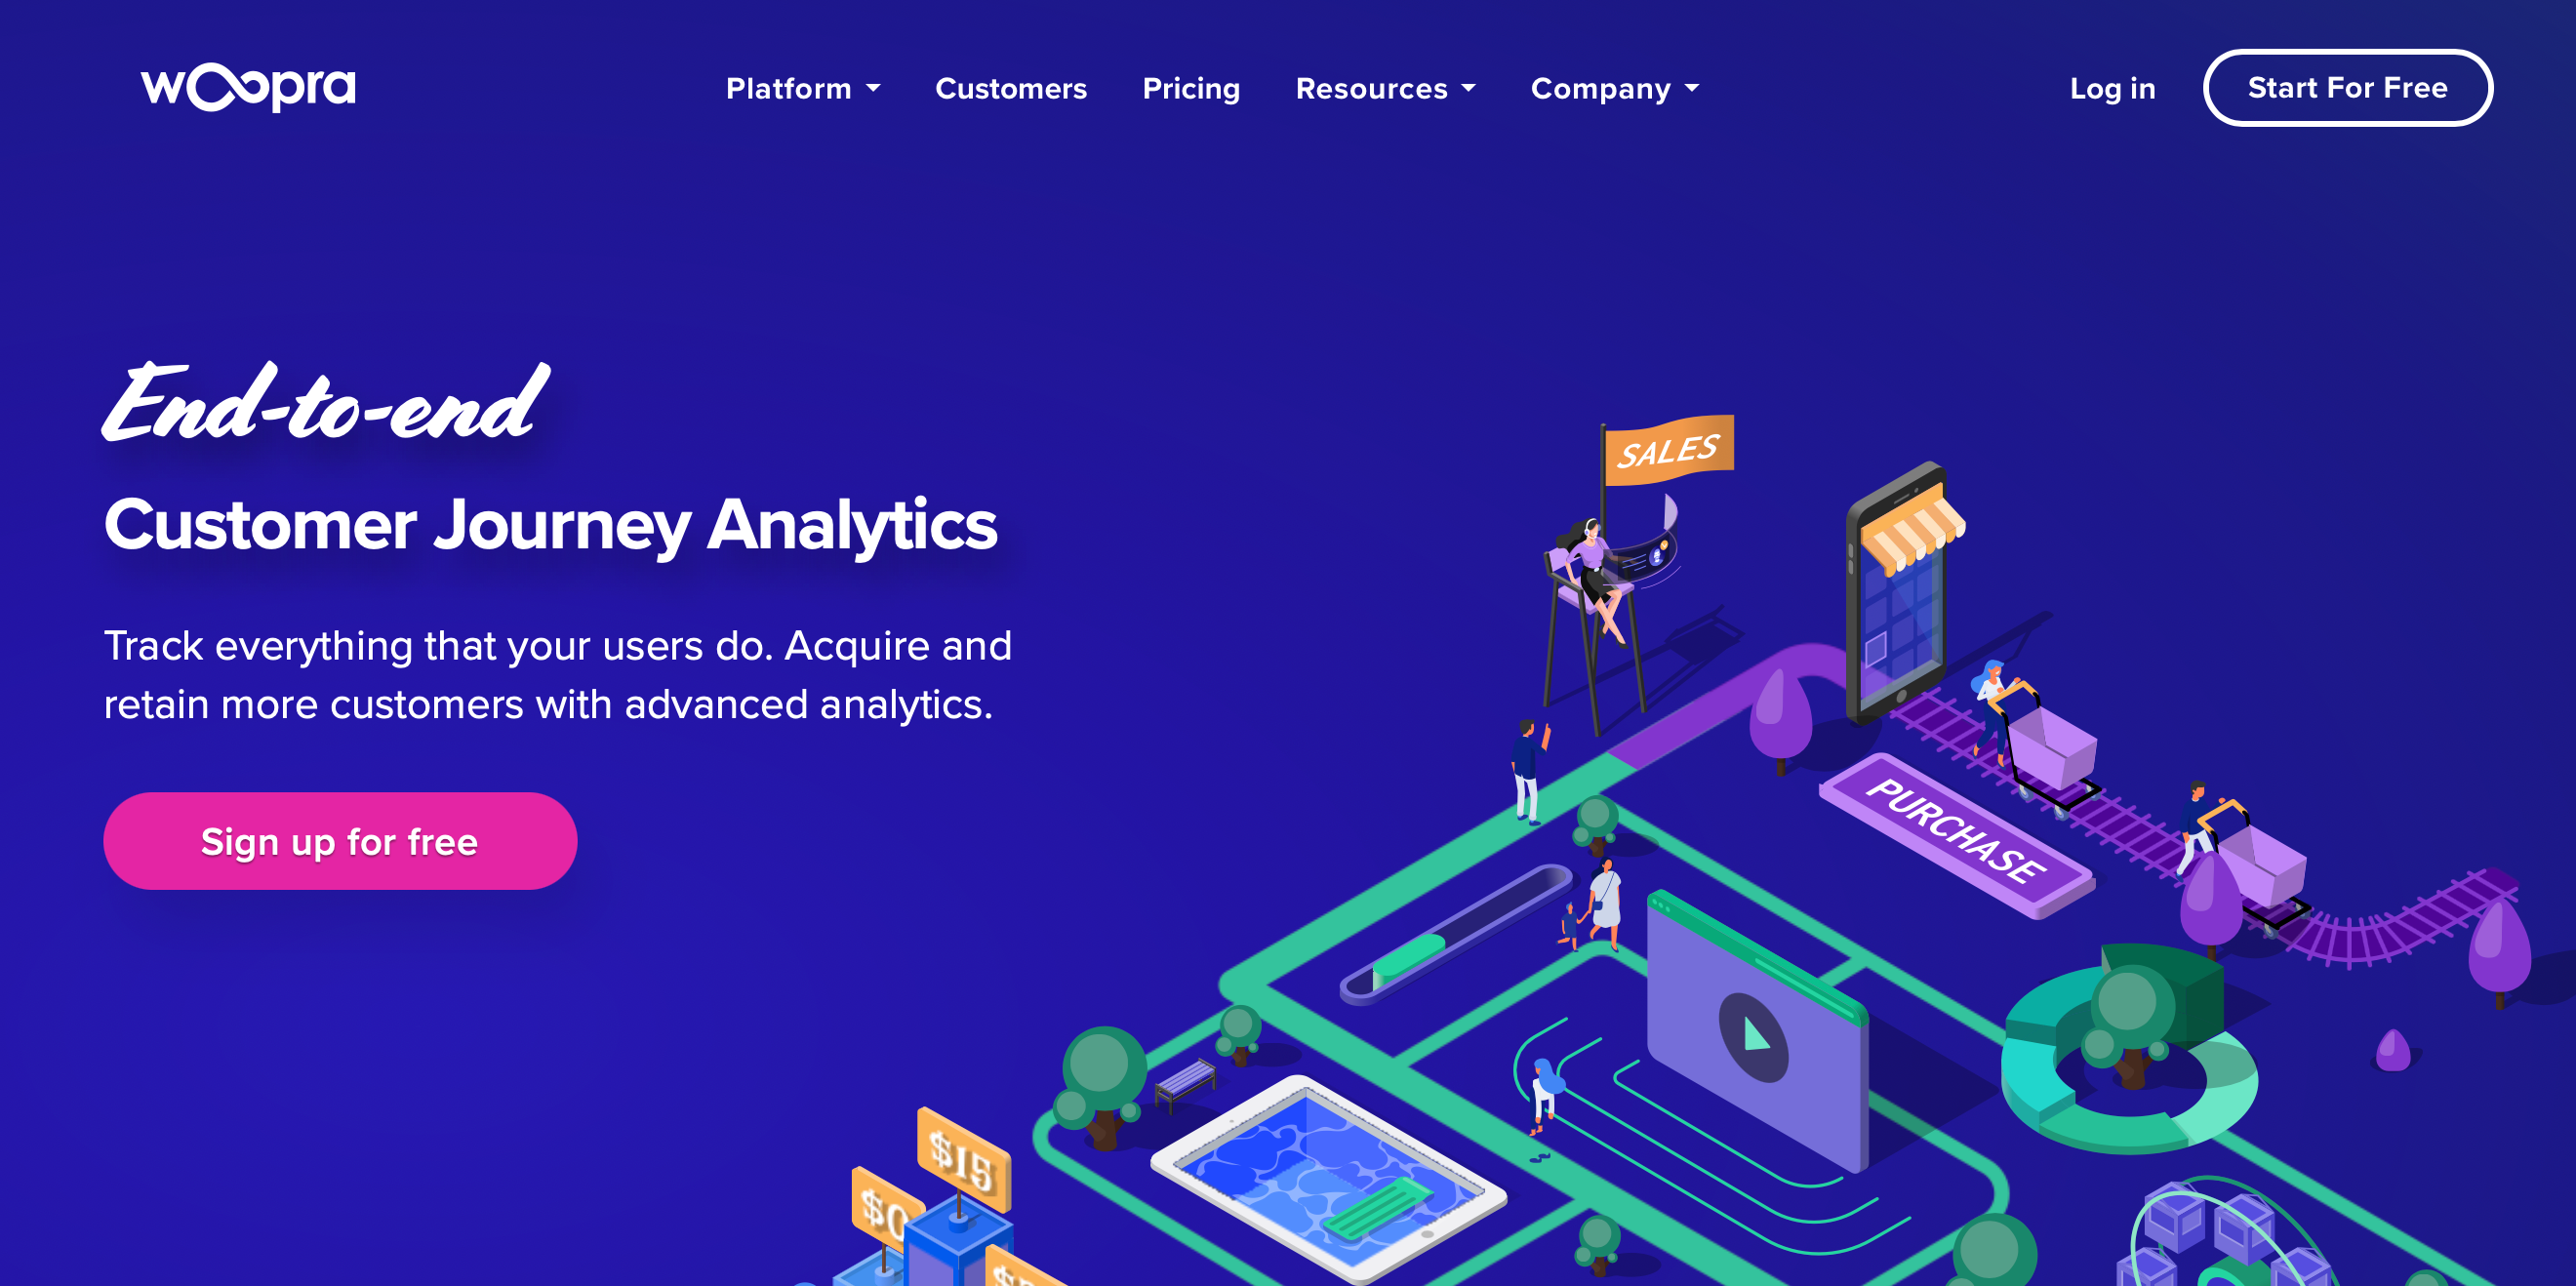
Woopra provides growth-led businesses with real-time customer analytics to enable them to acquire and retain more customers.
Woopra builds a profile for every individual and tracks them across digital touchpoints such as websites, helpdesk, socials, mobile applications, etc.
Such a robust data process, plus its geographical information on users, can significantly improve targeting in marketing campaigns.
This tool stands out from other tools in customer engagement – you can personalize user experience in real time using built-in triggers based on specific customer actions.
Features
Track and unify data across different departments including sales, support, marketing, and product.
Customer profiles
Behavioral segmentation
Retention analytics
Send custom messages to any user in real-time
Customer journey analytics tools
Triggers and real-time automation
Pros & Cons
| Pros | Cons |
|---|---|
| Straight forward configuration | No proper documentation and definition of terms. |
| Automation and triggers | Price is high for small startups. |
| Reports user-specific actions and information | |
| Export data in CSV | |
| Easy to setup reports | |
| Intuitive interface | |
| A host of integration options |
Hotjar
User Rating(G2): 4.3/5
Category: Web analytics
Pricing:
Free Plan: Available for websites that have less than 35 daily sessions
Paid Plan: Starts at $39/month with scaling and custom plan options


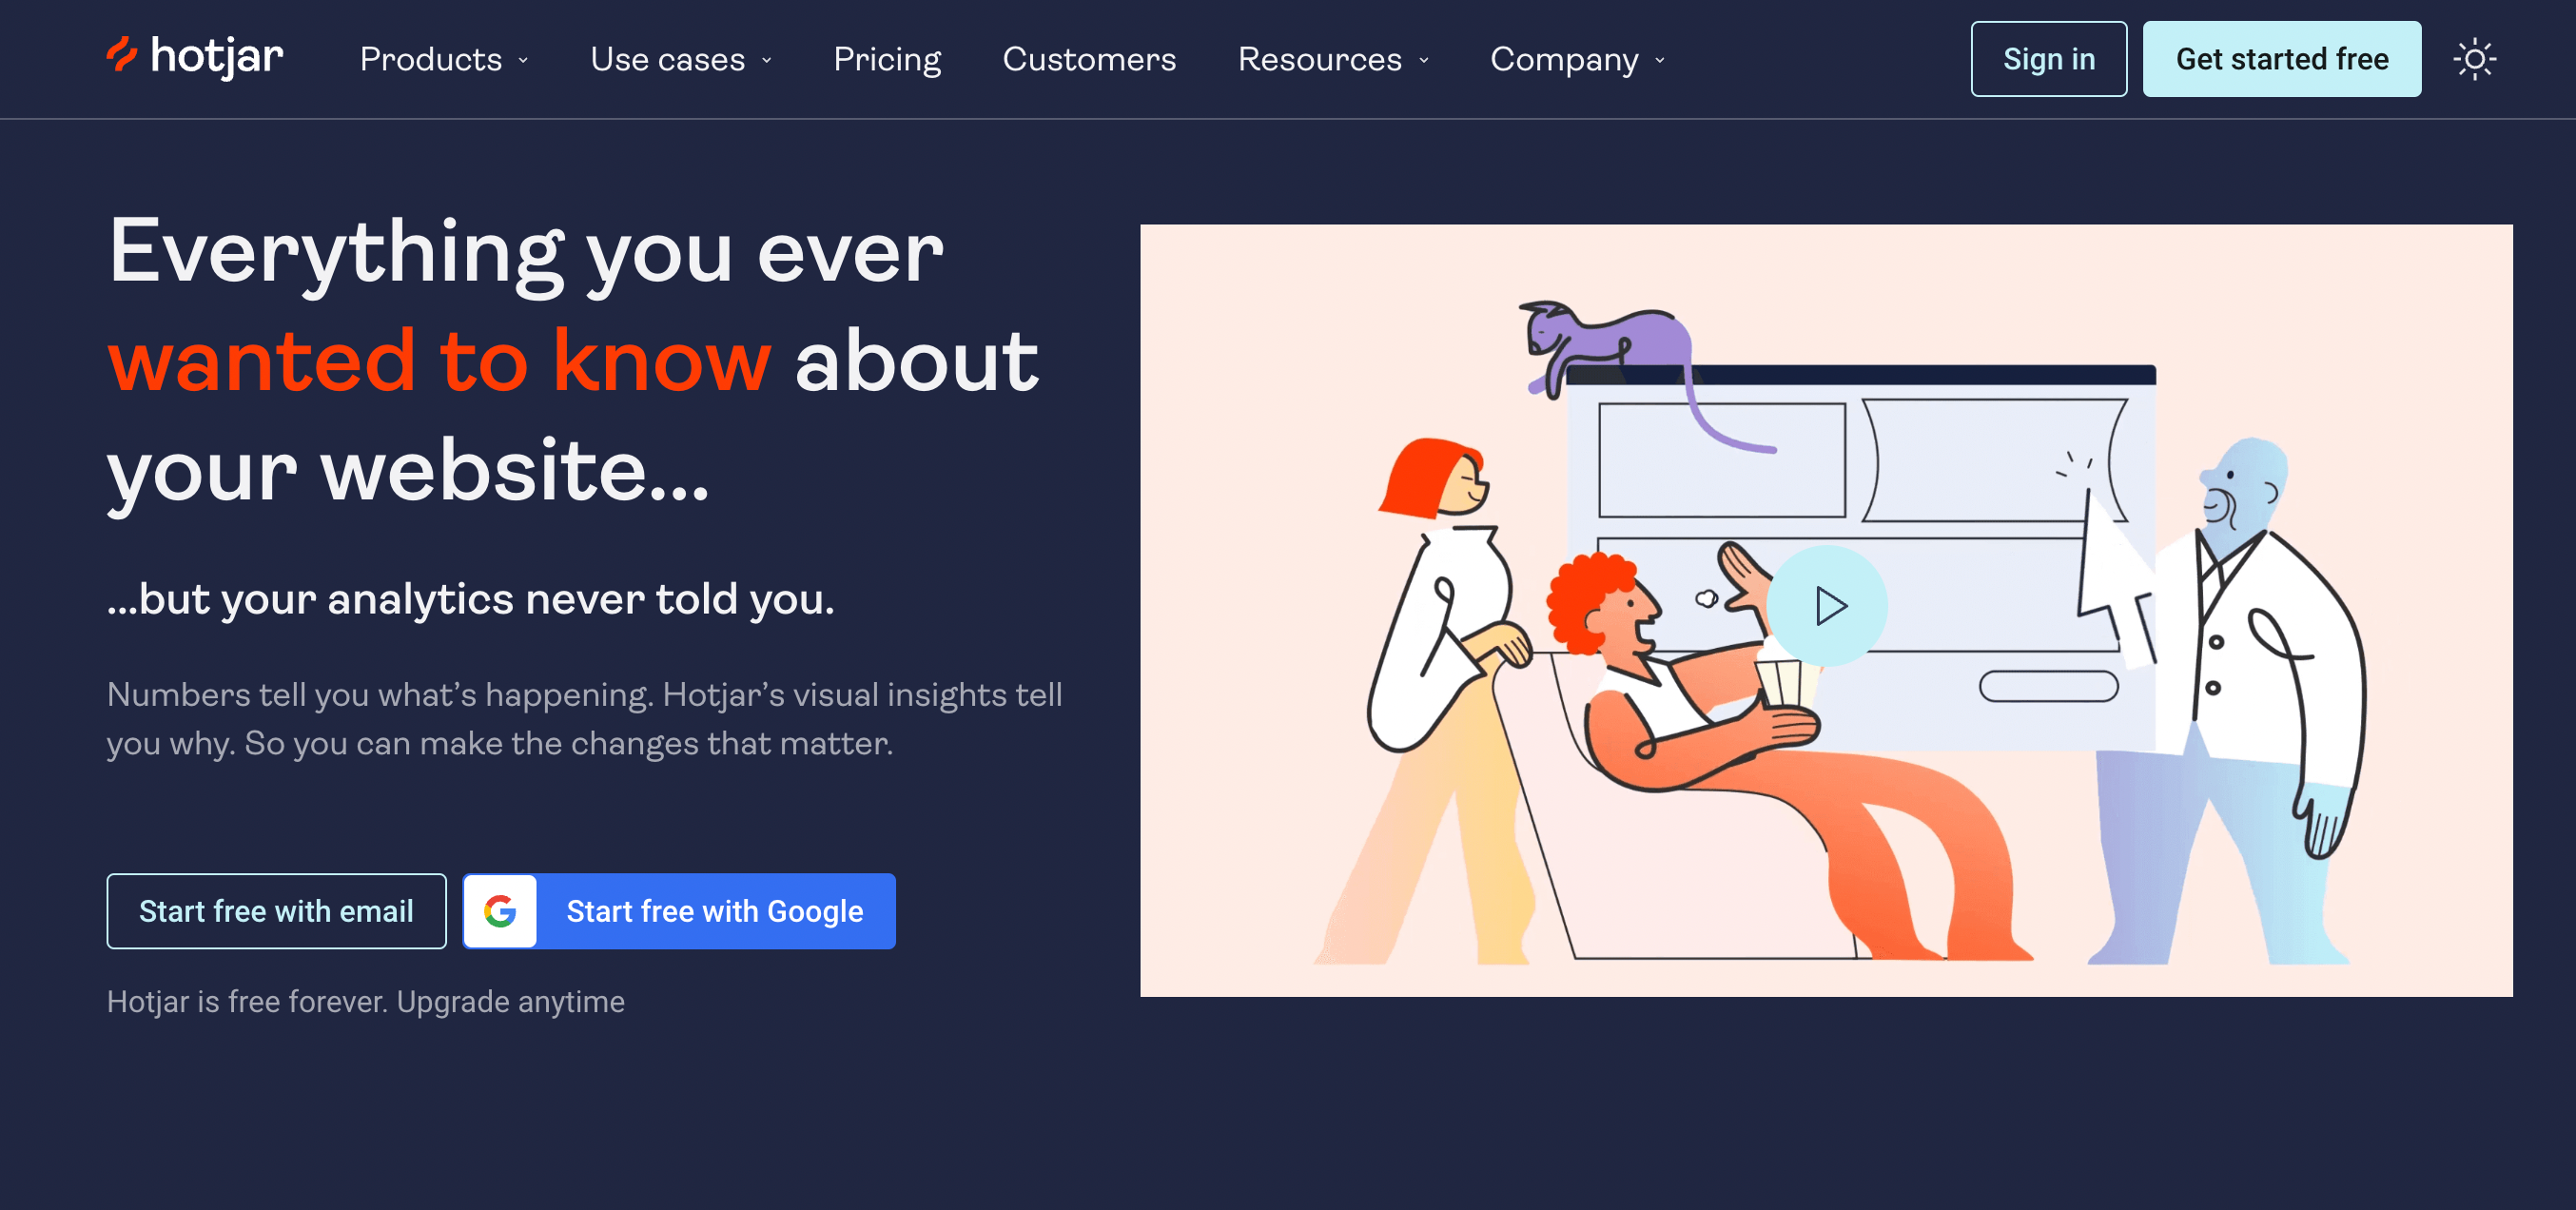
Hotjar is a product experience insights tool that provides data on customer behavior and feedback to help you understand your customer through a host of features like Heatmaps, surveys, session recordings, and a feedback widget.
Hotjar boast of being trusted by over 1M websites across 180 countries - We consider this a well-deserved statistic considering how helpful they are in helping business track their web activities and improve their conversion rate.
Features
Heatmaps – Learn about essential sections of your website by collecting data on user clicks, scroll, navigation, and hover information.
Recording: View individual user sessions across your website page by page. Use this to filter for bugs, improve navigations, optimize desktop or mobile view, and reduce friction.
Feedback Polls: Fix usability issues by speaking to your users themselves using rating scales, text boxes, radio buttons and more.
Pros & Cons
| Pros | Cons |
|---|---|
| Ease of use | Quite expensive for businesses getting thousands of users a day, considering it records all sessions. Custom business plans can go up as high as $1000/month, which is quite pricy when compared to alternatives. |
| Easy to integrate with 1000s of tools such as WordPress, Slack, HubSpot, Google Analytics, Zapier, and Segment. | Their free tools are sparse and have quite limited |
| Provides clear and visual data points on user behavior on your website | Heatmap data only last for 30 days |
| You can save any filter combination as a segment and reuse anytime needed | Difficult to troubleshoot issues since there is no line to call. |
P.S. if you need all the features of Hotjar in a mobile only analytics tool - Read this
Crazy Egg
User Rating (G2): 4.2/5
Category: Web analytics
Pricing:
Free Plan: 30 days free trial available across all plans except ‘enterprise’
Paid Plan: Basic plan starts at $29/month with a host of scaling options


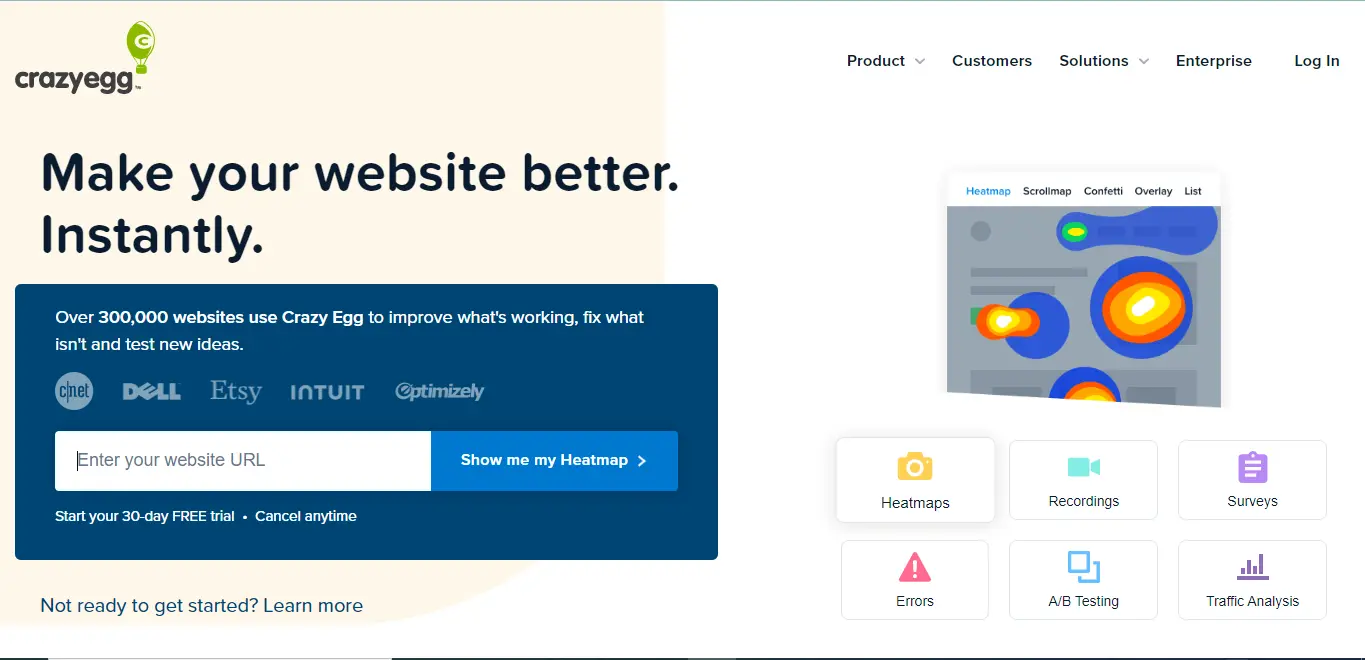
Crazy Egg is a popular analytic platform for businesses that desire to optimize their website for conversion. The data provided can help you figure out conversion pillars, user interaction with your content as well as what attracts and engages user attention.
Features
Heatmap tool
Traffic analysis
Session recording
Split testing
Pros & Cons
| Pros | Cons |
|---|---|
| Competitive pricing | Too broad – makes it hard to target for specific features when using their recording option |
| Fairly easy setup including suggestions to improve performance | Too simple – less advanced for enterprises and simplistic for technical users. |
| Outstanding visual representation of collected user data | Lack of integration with other analytics applications. |
| It uncovers dead spaces on your website | You must manually delete snapshots once max capacity is reached. |
Zoho PageSense
User Rating (G2): 4.2/5
Category: Web analytics
Pricing:
Free Plan: 15 days free trial available on sign up
Paid Plan: Pricing starts at $20/month with limited features and a scaling plan tied to traffic volume


PageSense is one of the numerous zoho products. Their primary focus with this tool is to help you optimize your website and personalize web pages to suit the needs of your target audience – hence, improve conversion.
PageSense is a suite of great data collection features that help you make sense of user activities on your web property in real time.
Features
Heatmap
Session Recording
Split Testing
Form Analytics
Pros & Cons
| Pros | Cons |
|---|---|
| The Funnel analysis feature tracks user activities and monitors for drop-offs to help you optimize your funnel for conversion. | Setup can be fairly difficult for inexperienced users. |
| Easy integration with various Zoho applications and other third-party applications to view all your data in one place. Honorable mentions include Google Universal Analytics, Google Ads, and Kissmetrics. | Slow Customer Support. |
| Chrome extension is available to all users to monitor visitor data instantly without a login to their PageSense dashboard. | Pricey budget for small teams with good traffic. |
| The form analytics tool can help you find out what areas on the forms users spend more time on or drop off at. | |
| Users can personalize content based on parameters, such as demographic, paid campaign visitors, and new visitors. |
BrandWatch
User Rating (G2): 4.4/5
Category: Customer experience analytics
Pricing:
Free Plan: 14 days free trial
Paid Plan: $108/month for small businesses. Contact sales to get the full product suite.


Brandwatch is an AI-powered social intelligence platform that enables brands to collect and analyze conversations from online sources to inform their business decisions.
Thousands of businesses worldwide analyze social conversations surrounding their brand, product, service, industry, and specific topics using Brandwatch.
This enables brands to make better data-based decisions in line with the needs and trends of their customer – in speed too. In addition to their brand listening feature, you can gauge and improve your social presence by analyzing your performance against competitors over time.
Features
Find micro-influencers in your niche that your audience resonates with to build trust.
Crisis management and competitor analysis.
Stay on top of social chatter that mentions your brands, products, keywords, or competitors.
Have a holistic overview of how you are perceived in the market and find unique opportunities for improvement.
Respond quickly to negative comments or reviews to preserve your brand name and presence.
Competitive analysis
Pros & Cons
| Pros | Cons |
|---|---|
| Simple Setup even for beginners | Limited access to Meta (Facebook and Instagram) data. |
| Ease to create and customize reporting dashboards | Some customers have complained about the discrepancy in the numbers reported |
| Insightful data representation | Translation (e.g., Japanese and Korean) is not very accurate |
| Alerts for listening projects | Can't reply to comments within the tool |
| Widgets are available to showcase KPIs on the dashboard | |
| Manage creatives and messaging at scale |
Zendesk
User Rating (G2): 4.3/5
Category: Customer experience analytics
Pricing:
Free Plan: 14 days free trial
Paid Plan: $49 per user/month for small businesses and goes as high as $150 per user/month for large enterprises.


Zendesk is a customer support platform for companies of all sizes. It helps businesses understand their customers and improve their customer experience.
Zendesk Explore is a reporting and analytics tool that makes it easy to understand customer data. It has built-in reports and the ability to create your own reports. You can share reports with others in your organization and even with people outside your team.
Zendesk covers all the support channels like email, social media, live chat, phone calls, and chatbots. It also has tools for creating a help center, building a knowledge base, and managing a user community forum.
In short, Zendesk is like a one-stop shop for all your customer support needs. It’s easy to use and helps you understand your customers and make your business better.
Features
Self-service portal
Ticket routing
Agent workspace
Live chat
Automation
Native integrations
Knowledge base
API
Customer Tracking and reporting
Cross-channel support
Community forums
Pros & Cons
| Pros | Cons |
|---|---|
| More than help desk software, it's also a CRM solution | Data upload and export challenges |
| Robust FAQ tool | Steep learning curve |
| Multi-brand support | Tedious and unintuitive navigation |
| Easy to set up and use | |
| Scalable pricing for growth | |
| Customizable customer interface | |
| Mobile support available | |
| Integration with third-party apps | |
| Comprehensive reporting and analytics | |
| Large knowledge base and community |
GainSight
User Rating (G2): 4.4 out of 5
Category: Deep customer analytics
Pricing: Quote available on request


Gainsight's customer cloud contains solutions that enable businesses to build deeply rooted and lasting relationships with their customers. In addition, Gainsight centralizes data across your entire organization.
You can align your customer experience (CX), customer success, product, and community management teams to have a holistic view of customers' relationships with your product – to increase adoption, foster better relationships, and eliminate churn.
The scorecard feature helps you monitor customer health and detect risks and opportunities from cross-functional teams and tools such as CRM and support tickets.
All teams can work on common goals, review summary reports, track expansion opportunities from a centralized timeline, and share results with stakeholders.
Features
Bulk Marketing Emails
Customer Profiles
Customer Health Scoring
Customer Health trends
Team Collaboration
Customer Segmentation
360 Customer View
Customer LTV
Timeline for Client Success team
Pros & Cons
| Pros | Cons |
|---|---|
| API Access | Tedious configuration and optimization – not the best learning curve for beginners |
| Accurate metrics | Slow reporting load time when pulling large data |
| Detailed documentation | Outdated layout |
| Supportive online community | |
| Helpful case studies |
ChurnZero
User Rating (G2): 4.7 / 5
Category: Customer experience analytics
Pricing: Available on demo request


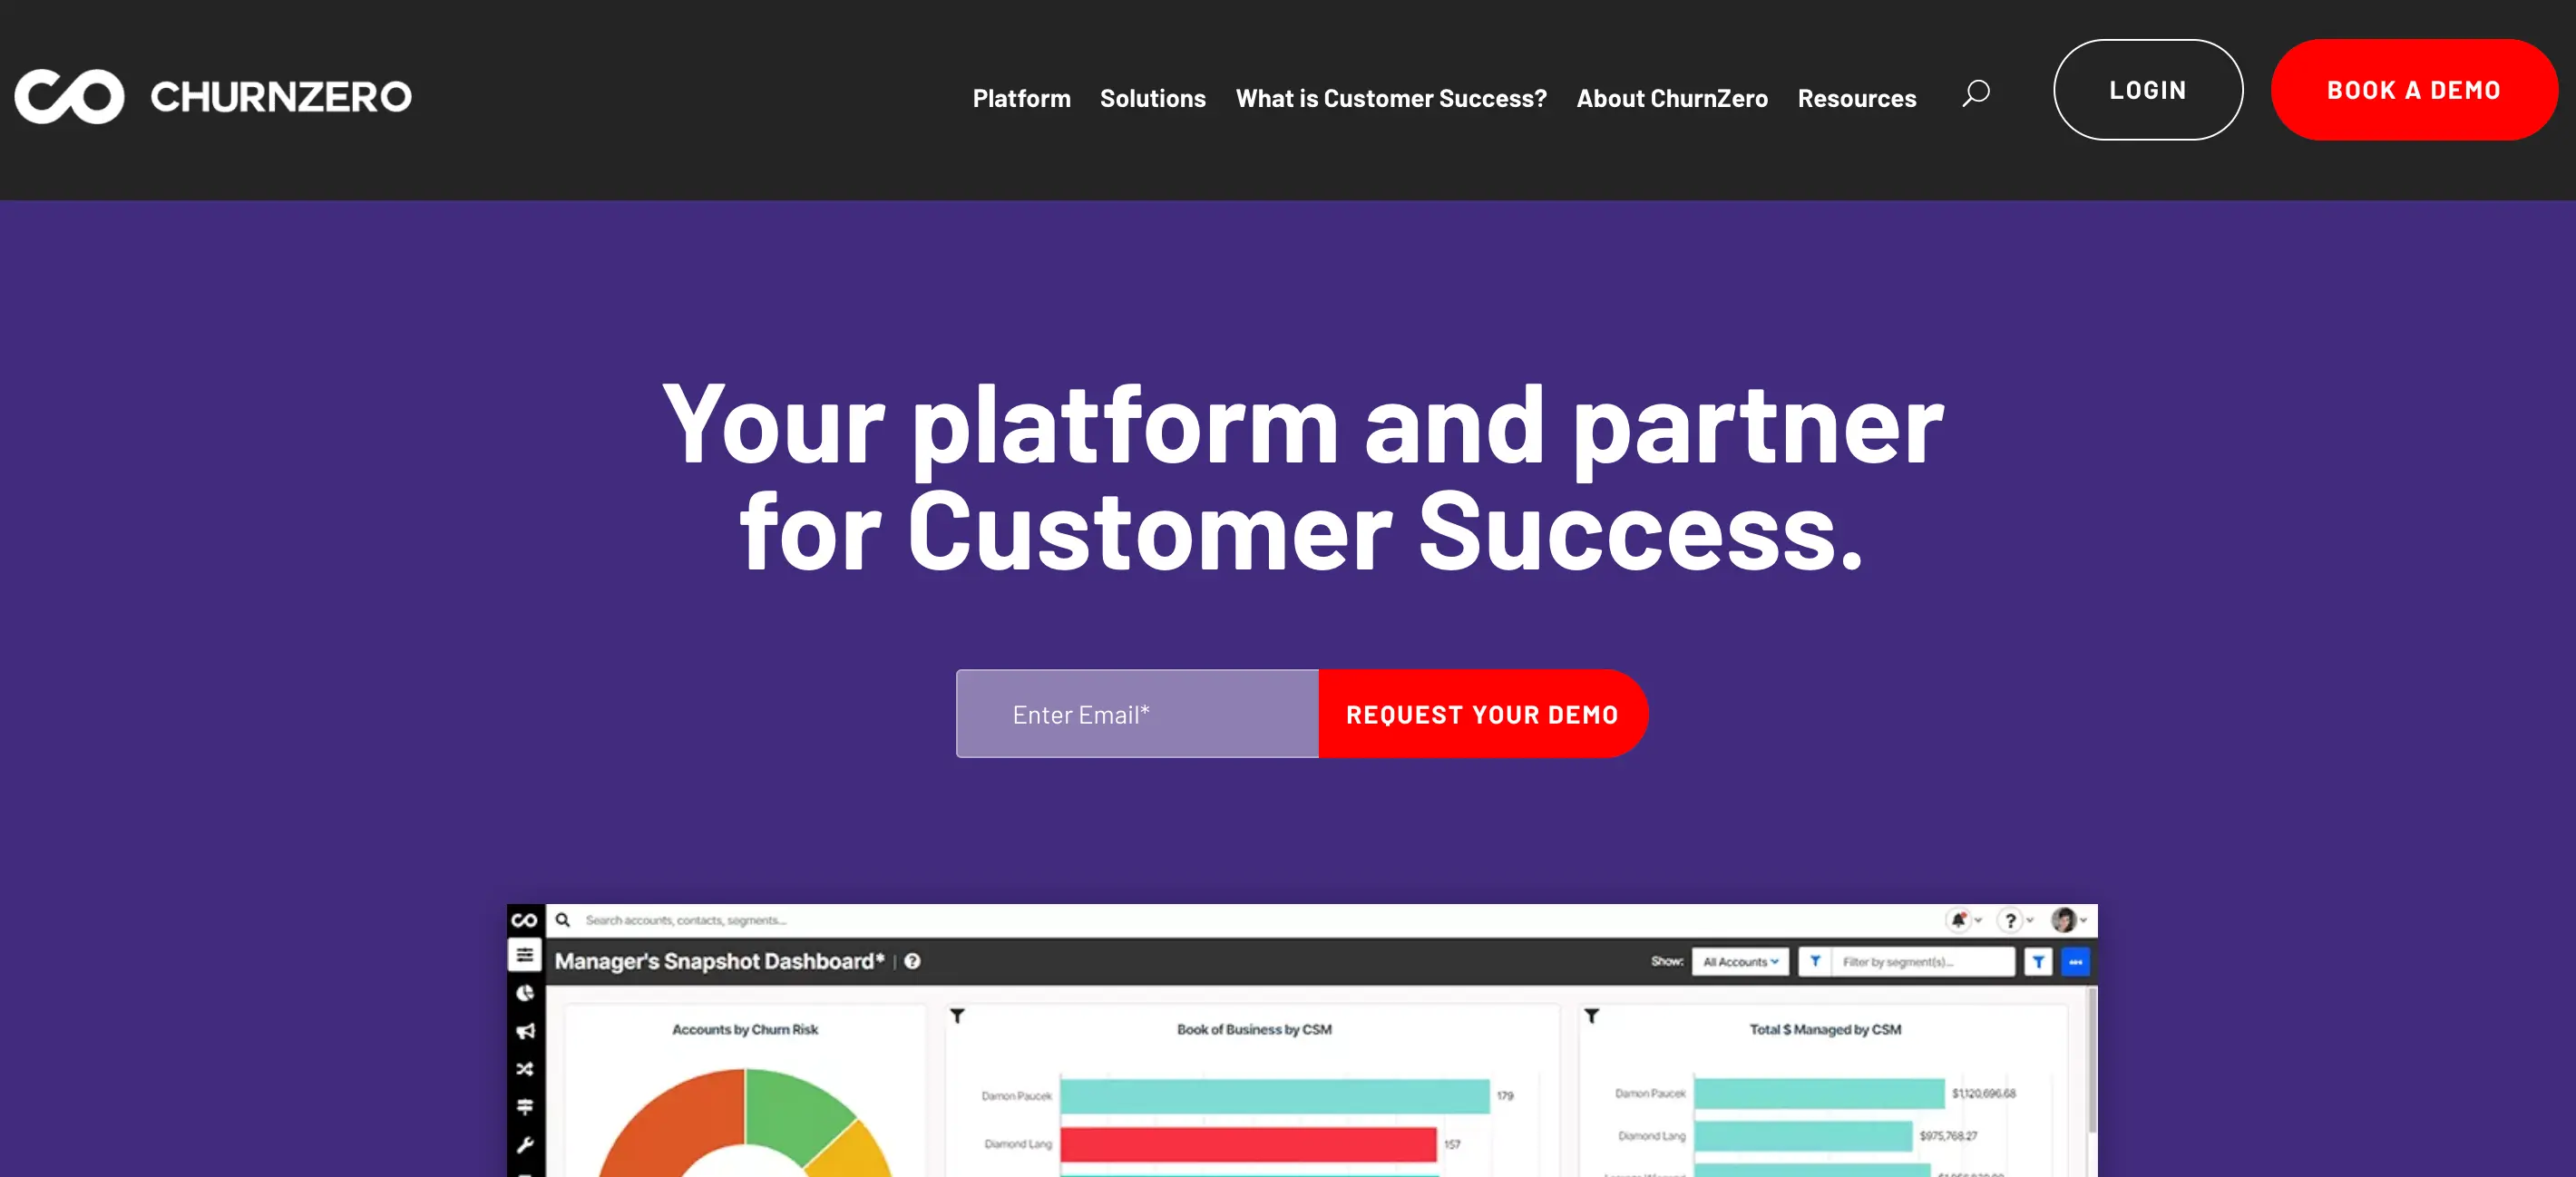
ChurnZero is designed to help customer success teams drive adoption and fight churn. Start by integrating your data across various customer touch points from support, product, and finance down to sales.
This information gets translated into real-time health scores for all customers to help teams identify friction points and mitigate adoption risk. Your team can collaborate in the Todos tab – this area collects renewal triggers and customer behavior and prioritizes tasks.
Each customer's profile contains relevant data such as start date, subscription amount, support and invoicing history, churn score, product usage data, and activity. ChurnZero is quite helpful to personalize customer experience regardless of how disparate they are.
Features
API
Salesforce integration
Role-based user permission
Revenue forecast
Customer health score
Customer health trends
NPS survey
Help desk/support ticket
Billing
Marketing emails
Pros & Cons
| Pros | Cons |
|---|---|
| Ability to filter data in segments | No option to duplicate segments |
| Tracks upcoming renewals | Technical Setup |
| In-app messaging | Poor Documentation |
| Integration with multiple platforms | Lack Of Case Studies |
| Automated tasks based on events | Poor Customer Support |
| Alerts for significant events like lead conversion. |
Customer analytics - FAQ
Here are the answers to some commonly asked questions about CX analytics tools.
What is customer analytics?
Customer analytics is the science of collecting customer data to improve your product, service, and marketing effort. This process aims to determine who your customers are, their needs, and how they interact with your product or service.
What are the types of customer analytics?
Below are the most relevant types of customer analytics:
Customer journey analytics: This kind of customer analytics solution focuses on understanding customers’ interactions with your product or service–from their first touch point (research) to initial purchase and beyond.
Customer experience analytics: Customer experience analytics analyzes customers’ emotions when interacting with your product or service. This includes their perception of your product at the onboarding phase, customer care experience, and much more.
Customer engagement analytics: This studies the navigational path of your customers and builds a picture of how they engage with your content, CTAs, ads, email, social media, etc. Insights such as click-through, open, and bounce rates are the metrics considered in this stage.
Customer loyalty and retention analytics: This directly measures consumer loyalty – what’s the churn rate? What’s the percentage of repeat customers? These are the kinds of questions that the data collected tends to answer; how long do our customers hang with us?
Benefits of customer analytics platforms
Customer analytics solutions help you:
Understand user behavior and improve their digital experience
Identify risks and opportunities in your customer base
Focus your effort and resources on features users really want
Lowers customer acquisition cost
Incorporate feedback in research and development
Increase conversion and build long-term customer loyalty
Discover emerging trends among users and propose new solutions
Take data-backed decisions
Test and measure results
How to choose the right customer analytics tool
Navigating the world of customer analytics tools can be quite daunting, but don't worry, we're here to help you make an informed decision. When selecting the right customer analysis tool that can serve your business needs, here are some of the key criteria to keep in mind:
Evaluate your business needs
First and foremost, figure out what you need from a customer analytics tool. Are you looking for deep insights into user behavior or are simple metrics sufficient? The goal is to identify what kind of information is vital to support your business decisions. This will make your shortlisting process more efficient and accurate.
Scalability
If your company is growing rapidly or plans to expand, you need to ensure that the platform you choose can keep up. That’s why you should pick a tool that can scale according to your needs. Check whether the tools offer features such as data volume adjustability, customizable reporting and analysis options that can support your growth, and if they can handle the increased complexity it brings along.
User-friendliness
The platform should be user-friendly and require minimal IT assistance to operate. An intuitive user interface, easy-to-understand reports and dashboard, and good user experience generally save time, reduce the need for extensive training, and increase productivity.
Integration
Does the tool integrate well with your existing tech stack? This is especially important if you need to combine data from numerous sources. Remember, the easier the tool is to integrate, the quicker you can start generating insights and taking action.
Price consideration
Last but not least, take into account the tool's cost against your budget. While you should aim for a tool offering the best value for your money, make sure you also consider what features they offer in their pricing plan and if it meets your business requirements.
Customization and support
Another major point to consider is if the tool allows flexibility and customization. Can you tweak the platform to suit your business model? Additionally, assess the kind of support provided by the tool’s company - do they have a responsive team that can deal with your queries and concerns ?
Remember, the tool is supposed to serve you, not the other way round. So, take your time, evaluate these criteria, and take advantage of the free trials before you commit to one platform. You'll thank yourself later!
How can I use customer data?
To make the best possible use of customer data, you should:
Focus on qualitative data: Customer analysis software has made it possible to observe in real-time what problems users face while using your product; try to connect and build a story around the common traits and trends in customer actions.
Test solutions: After diagnosing the problems, evaluate your options and test different solutions until you find your answers.
Compare data: Always compare your current data with previous ones to see how much improvement has been made and observe for possible deterioration in a specific Metric. You can also share this data with your team to align and strengthen vision and communication.
How do you analyze customer data to improve UX?
To improve user experience, you need to:
Perform adequate user research
Analyze user behavior on your mobile application or website
Prioritize customer feedback
A/B test different versions of your design to see which performs better
Utilize heatmaps and session recordings to see exactly how and why users interact on your product
Rinse and repeat.
Tools like UXCam can help you automate user research and provide rich insights to improve the user experience of your mobile app.
Try UXCam for FREE now — with 3,000 free monthly sessions and unlimited features.
Conclusion
We have provided you with several options with a range of unique features – now you’re probably overwhelmed with choosing the ideal tool for your business needs.
Depending on your goals, a single tool may not deliver all the customer insights you need. Therefore, we categorized these different tools to help you make the best choice for your immediate business needs.
Related Articles:
Customer experience dashboard examples
SaaS Customer Journey Mapping - A Comprehensive Guide
Customer Behavior Analysis: Ultimate Guide
What is Customer Journey Optimization? A Step-by-Step Guide
How to use customer engagement analytics to improve CX
Understanding Mobile App session replay
Mobile App tracking: Practical guide and best tools
AUTHOR
Tope Longe
Product Analytics Expert
Ardent technophile exploring the world of mobile app product management at UXCam.


Related articles


Curated List
The 15 Best Web Analytics Tools in 2026
Discover the best web analytics tools. Want to enhance your site's user experience? Learn what's a must-have for insightful web...


Jonas Kurzweg
Product Analytics Expert


Curated List
Customer Behavior Analysis: The Framework, Methods, and What's Actionable in 2026
Customer behavior analysis is the systematic study of what customers actually do in your...


Silvanus Alt, PhD
Founder & CEO | UXCam


Curated List
10 Best A/B Testing Tools for Mobile Apps in 2026
The 10 best A/B testing tools for mobile apps in 2026, evaluated on mobile SDK quality, statistical rigor, pricing, and ecosystem...
Silvanus Alt, PhD
Founder & CEO | UXCam