10 Mobile App Engagement Metrics to Track and Measure

TABLE OF CONTENTS
- Summary - Top 10 app engagement metrics
- What are mobile app engagement metrics?
- Mobile app user engagement metrics to measure
- Benefits of mobile app engagement analytics
- How to measure app engagement metrics efficiently
- Factors to consider to increase mobile app engagement
- Use UXCam for an app that converts
Once a user downloads your mobile app, holding their engagement is tricky. The best apps are easy to use, provide value, and keep users hooked. So how can product teams develop apps that users engage with consistently? App engagement metrics are the most effective way to find the secret sauce.
In-app engagement data is crucial to gauging how well an app is received and uncovering behavioral trends to understand users better. These insights can help you turn first-time downloaders into long-term active users while keeping existing users locked in.
Cutting-edge mobile app analytic tools like UXCam are ideal for gathering KPI and contextual data in real time without disturbing the user experience.
This article will take you through core mobile app engagement KPIs for increased app engagement.
Summary - Top 10 app engagement metrics
| Metrics | Summary |
|---|---|
| Gestures | Tracks user interactions (taps, swipes) to find friction points and improve user experience. |
| Active Users | Counts daily (DAU) or monthly (MAU) active users to measure engagement and app growth. |
| Session Interval | Measures time between sessions; shorter intervals mean higher engagement. |
| Lifetime Value | Calculates total revenue from a user, showing app monetization success. |
| Avg. Session Length | Tracks session duration; longer sessions indicate higher engagement. |
| Conversion Rate | Percentage of users becoming paying customers, reflecting engagement and value perception. |
| Churn Rate | Measures users leaving the app; high rates signal issues needing resolution. |
| Stickiness Ratio | Combines DAU and MAU to show user retention; higher ratios mean users find value in the app. |
| App Crashes | Counts crashes, which disrupt engagement; resolving improves performance. |
| Session Depth | Tracks screens/pages visited per session; higher depth indicates deeper engagement. |
What are mobile app engagement metrics?
Mobile app engagement metrics are user analytics offering quantitative insights into how users interact with an app. Metrics such as sessions conducted, average session length, quality of interactions, and other KPIs help to measure app engagement. This gives you an idea of the kind of value your app provides users.
Depending on the context, the definition of high app engagement will vary. For example, a workplace app will likely be used frequently by users, as they’re necessary for daily business operations. Whereas someone looking for a place to rent may use an apartment-finding app infrequently as their need arises.
Mobile app user engagement metrics to measure
To get started on measuring your key metrics for performance-tracking purposes, here are some essential engagement metrics that you should pay attention to when assessing user activity within your mobile application.
1. Gestures


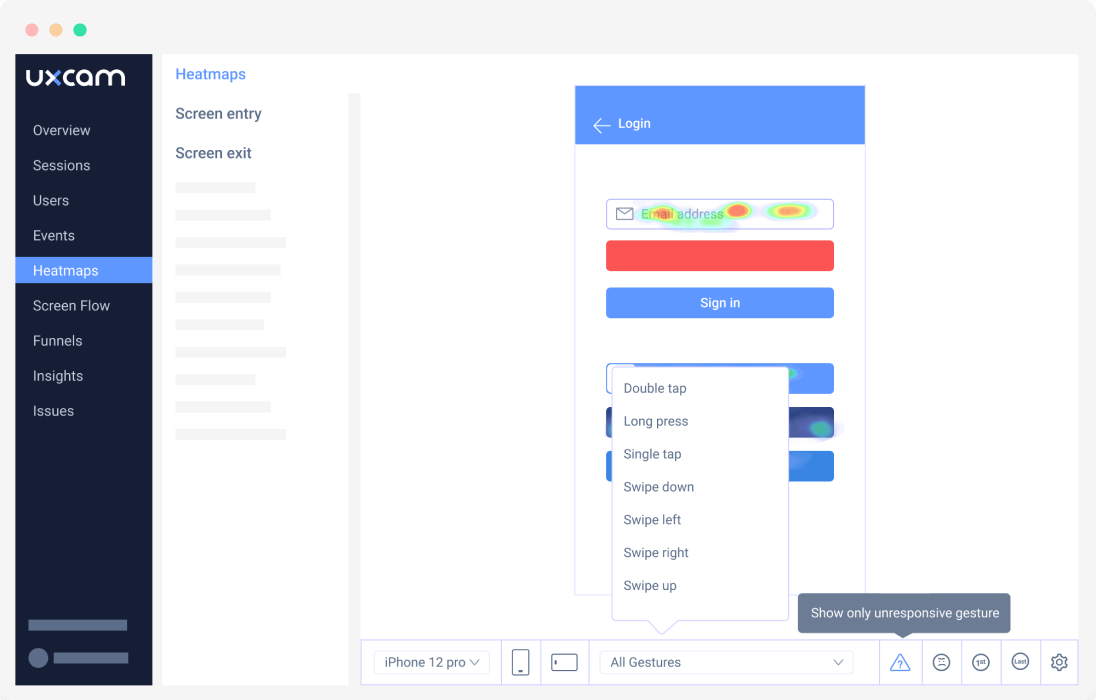
Gesture data measures how users interact with an app. It helps product teams understand users' behaviors and shows friction in the app. Tracking gestures can uncover pain points, which cause friction in the user journey. With this data, you can identify problem areas in your app, so product teams can create solutions that will help to reduce drop-offs and churn.
UXCam offers all the insights you need for a 360-degree view of gesture behavior on your app. This powerful mobile app UX analytics tool captures every micro-interaction during an app session and turns them into data points for meticulous reporting.
2. Active users
Daily active users (DAU) or monthly active users (MAU) give you a general idea of how many users regularly interact with your app. For an idea of high engagement, DAU counts a daily user as one app session, subsequent access throughout the same day isn’t counted.
Similarly, MAUs are calculated once, when they log into an app during a particular month or 30-day period, depending on your specifications. Over time this measurement can give you an idea of app growth and overall user engagement.
3. Session interval
The session interval is the time elapsed between two successive app sessions. This metric helps you understand engagement from a different angle by measuring the length of time between app re-engagement. Short pauses indicate high engagement and could mean that these users are "hooked," while longer intervals show lower interest.
4. Lifetime value
The lifetime app value is an essential measurement that directly affects business success. It realizes how much money a user spends while using the app. These numbers can be used to decipher how effective the app is at making money.
In short, it’s the total income earned from a user while interacting with your app and gives you an idea of how well you’re monetizing your app.
5. Average session length
The average session length measures the time an average user spends on your app during one session. The length is determined by calculating the time between accessing and exiting the app or between the first and last app actions. The latter provides a better understanding of whether the user is engaged instead of idle. This KPI can be used as an indicator of engagement and retention.
With UXCam's mobile session recording feature “session replays,” you won’t just be presented numbers, but have the exact recording of a user’s session, so you can watch how they use your app. The session commenting feature lets your teams add notes, highlight moments in the replay, and tag team members for collaboration.
6. Conversion rate


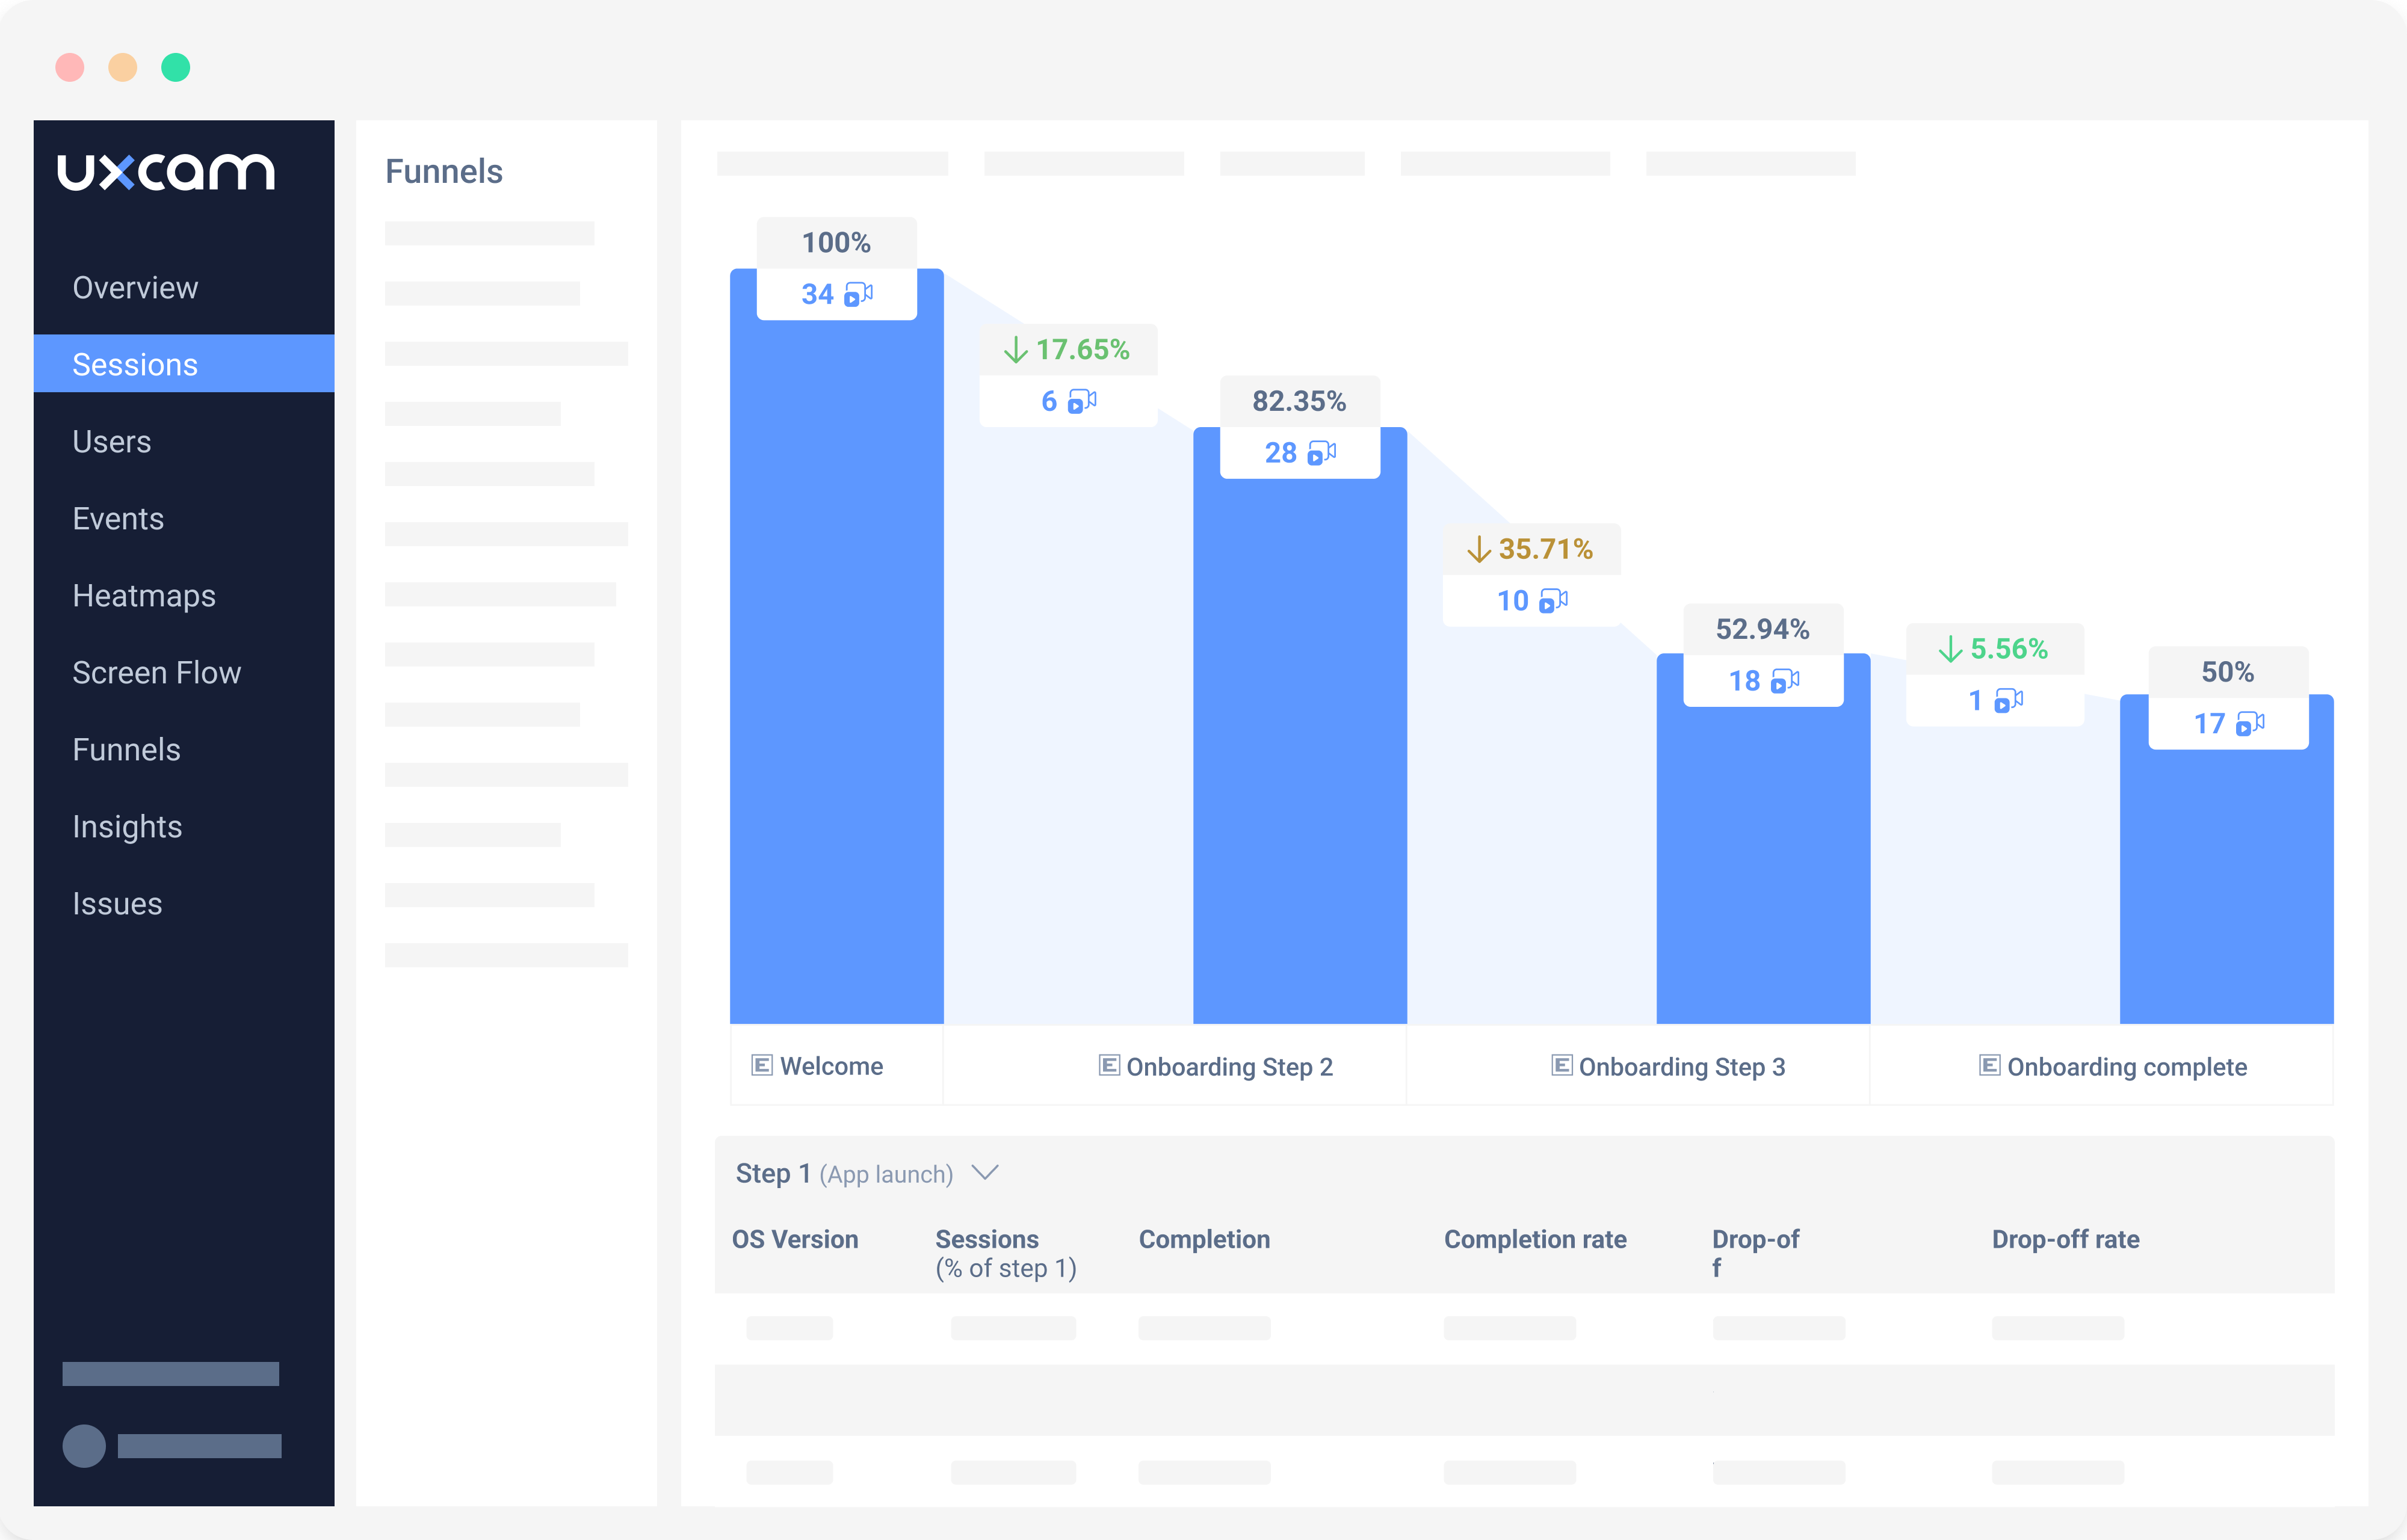
The conversion rate is the percentage of users who become paying customers. Higher conversion rates usually indicate high engagement rates. After all, if your users are paying for your app, they obviously see some value in your app. Plus, paying users won’t want to waste their money, so they’re likely to have higher engagement rates than non-paying users.
7. Churn rate
The churn rate measures the opposite end of the retention rate and is the number of users that leave an app over a period of time. A climbing churn rate is bad news. However, the good news is you have a variety of engagement metrics and reliable analytics tools like UXCam to help you get to the root cause, so you can develop a solution and reduce churn.
8. Stickiness ratio
Stickiness or retention ratio is another significant KPI to understand app engagement. The term "stickiness" refers to how valuable, and relevant users find your app. A sticky app delivers a unique and memorable user experience that sets it apart. The calculation includes the DAUs and MAUs figures, and a high percentage indicates that your users find value in your app and thus come back to use it.
9. App crashes


An app crashing or randomly shutting down is a significant obstacle to app success. If this happens, user engagement is interrupted, and they are further inconvenienced by needing to restart the app. The experience can be unforgiving, especially if the user is required to redo something, and it could cause some users to bounce off entirely.
Analyzing the number of crashes and when they happen helps product teams pinpoint and resolve bugs to improve app stability and performance.
10. Session depth


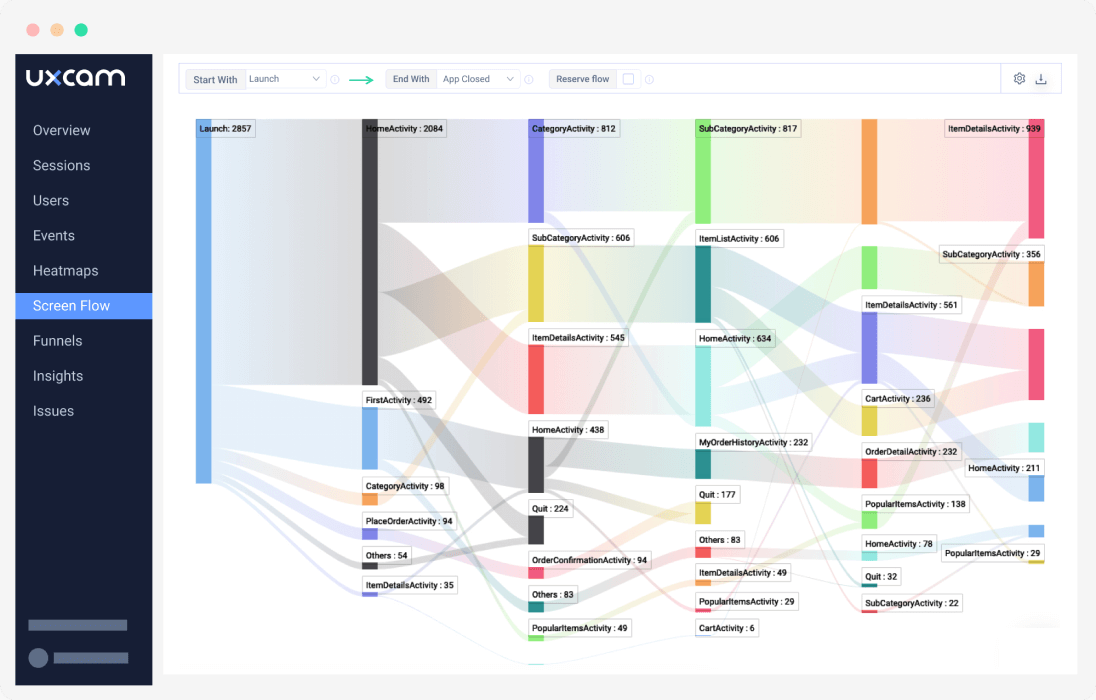
The session depth metric is the number of pages viewed during a single app session. It’s a good indication of how far a user gets through their user journey before exiting the app. Measuring this mobile app KPI can give you a lot of insight into engagement and help you understand your users better.
Understanding retention is vital for an engaging app experience, and 73% of app users expect their individual needs and expectations to be understood. Develop a deeper understanding of your users with UXCam.
UXCam is a leader in mobile app experience analytics, with several features that support product teams in gathering data for engagement and UX metrics. The whole team can discover a variety of data about their users' behavior and app experiences. Features like heatmap analytics and session replays let you identify how your app is used and helps your product teams pinpoint issues within the user journey, which gives them an opportunity to resolve them.


Benefits of mobile app engagement analytics
Engagement metrics can help product teams make informed decisions regarding app usability, experience, and performance improvements. Here are some mobile app analytics examples and how businesses can benefit from this data.
Retention rate and active users
The retention rate highlights the percentage of your user base that keeps returning. This is based on the number of active users within a day or month. This information, coupled with user behavior analytics, enables the business to understand the features that retain users. This allows you to keep adding to those features or develop new ones based on what users already enjoy.
User satisfaction or dissatisfaction
Engagement metrics like session frequency are a great indicator of returning users' satisfaction with your app experience. Longer session lengths could mean positive engagement. But, on the opposite end of the spectrum, shorter sessions could indicate issues with your software.
Heatmap analytics, like those found on UXCam, can show you where the bottlenecks are and illuminate concerns that traditional quantitative techniques would fail to pick up. This allows you to pinpoint the exact events which are engaging users and those that are causing them to bounce off, which can help you provide solutions and reduce churn.
Conversion rate
The conversion rate is the number of users who take a desired action, like an upgrade to a premium plan, for instance. This KPI is a solid indication of how well your app is perceived. When a business focuses on mobile app conversions, the revenue per user increases and more users are acquired. These gains have a positive impact on business objectives and ROI.
How to measure app engagement metrics efficiently
First, you'll need to be clear on what successful app engagement looks like. Then, set up user mobile app tracking using a tool like UXCam to track progress over time. You’ll be provided with a host of analytics tools, including those based on events, issues and screen flow.


Factors to consider to increase mobile app engagement
Maximizing user interest in your app is important for growing your user base and staying competitive. To help you get started, here are a few fundamental tactics that can be implemented quickly to encourage daily use of your mobile application.
1. Personalize and simplify welcome screens
A study found that 71% of consumers want businesses to deliver personalized communications. Consider customizing your new user welcome message and address them by their first name. This information can be easily gathered from user sign-up pages.
In addition, try not to overwhelm the user with detailed welcome screens. Information overload can cause confusion and frustration. Instead, they should be minimal with brief and concise app information.
Adding animated images and icons encourages engagement as it can keep a user interested in a screen. However, you’ll need to ensure that you don’t slow the app load time too much.
2. Decrease onboarding friction (and user churn)
A compelling mobile app onboarding experience is essential since the most significant drop-off in user engagement occurs during the onboarding process. The abandonment rate increases when critical features and navigation is complex.
Every additional onboarding step results in a 20% increase in user churn. So, you’ll need to keep tutorials simple, intuitive, and brief for effective onboarding, and show the value of your app early.
3. Offers, promotions, and incentives
Rewarding active app users or offering new user discounts is an effective persuasion technique for extended app use. Consider these effective techniques to increase engagement.
Remember, everyone loves a freebie - occasionally give users a surprise gift or exclusive promotion. It doesn't have to be expensive; something like entry into a competition with the chance to win a t-shirt, or a discount on complementary products will suffice. This can encourage engagement and create appreciative fans.
New user referrals - you can also encourage current users to refer a friend to your app in exchange for a reward. The reward could be as simple as a free month if your app uses subscriptions. The referral technique remains effective in encouraging loyalty and gaining new users.
Use UXCam for an app that converts
Getting your app to stand out from the never-ending sea of mobile apps requires data-backed decisions to be successful. Engagement metrics data can highlight how users interact with your app and whether it provides value.
Understanding retention is vital for an engaging app experience, and 73% of app users expect their individual needs and expectations to be understood.
UXCam helps you to get the understanding you need to deliver an optimized user experience. It seamlessly integrates with multiple platforms, and setup takes minutes.
Signup for free today and find out why 37,000 mobile app specialists choose UXCam for their mobile app analytics needs.
Related Articles
Best mobile app analytics tools
Top 51 mobile app KPIs to measure app performance Most important mobile app analytics metrics to measure
Mobile app metrics to track for every job role
Mobile app KPI dashboard examples and how to use them


TABLE OF CONTENTS
- Summary - Top 10 app engagement metrics
- What are mobile app engagement metrics?
- Mobile app user engagement metrics to measure
- Benefits of mobile app engagement analytics
- How to measure app engagement metrics efficiently
- Factors to consider to increase mobile app engagement
- Use UXCam for an app that converts


Related articles


Conversion Analysis
React Native Crash Reporting + Best Tools and Techniques
Learn how to improve your mobile app's stability with effective React Native crash reporting. Explore the top techniques and tools for monitoring and managing...


Tope Longe
Product Analytics Expert


Conversion Analysis
Flutter Performance Monitoring - Best Tools and Techniques
In this article, we'll introduce you to the top Flutter performance monitoring tools and demonstrate how UXCam can help you monitor your app's performance with...
Tope Longe
Product Analytics Expert


Conversion Analysis
How to measure, analyze, and reduce app churn
All the user acquisition in the world won't matter if you've got a high churn rate on your app. If you want to know why users are uninstalling or unsubscribing, tools like screen flow, heatmaps, and screen recordings can get users loving — instead of leaving your...
Tope Longe
Product Analytics Expert