Mobile app metrics: essential metrics to track in your job role

TABLE OF CONTENTS
- Mobile app metrics to track for Product Manager
- Mobile app metrics to track for UX & UI Designers
- Mobile app metrics to track for Growth Marketers
- Mobile app metrics to track for iOS and Android developers
- Mobile app metrics to track for Backend Developers
- Sum up: What are the essential mobile app metrics to track
Are you a part of a mobile app team? If yes, excellent choice of career path! If not, it's not too late to join one of the most fast-developing industries. Especially after we walk you through one of the most confusing topics for mobile app teams: what mobile app metrics should different team members track in their daily jobs?
In this article, we will cover the essential app metrics for:
Product managers
UX/UI designers
Growth marketers
iOS and Android developers
Backend developer
Found yourself on this list? Then let's dive deeper into each of the positions.
Mobile app metrics to track for Product Manager
In the mobile industry, the product manager plays a significant role. At the same time, a job position like this might cover different angles of responsibilities. However, there are some key app analytics metrics that all app product managers should look at.
Active App Users
You can segment and track active app users by:
DAU: Daily Active Users - the number of people who use your app at least once a day.
MAU: Monthly Active Users - the number of people who use your app at least once a month.
These values allow you to determine how sticky your app is. But keep in mind that different app categories aim for different results. For example, the hotel booking app and weather forecast app can have different DAU and MAU numbers and still be very successful.


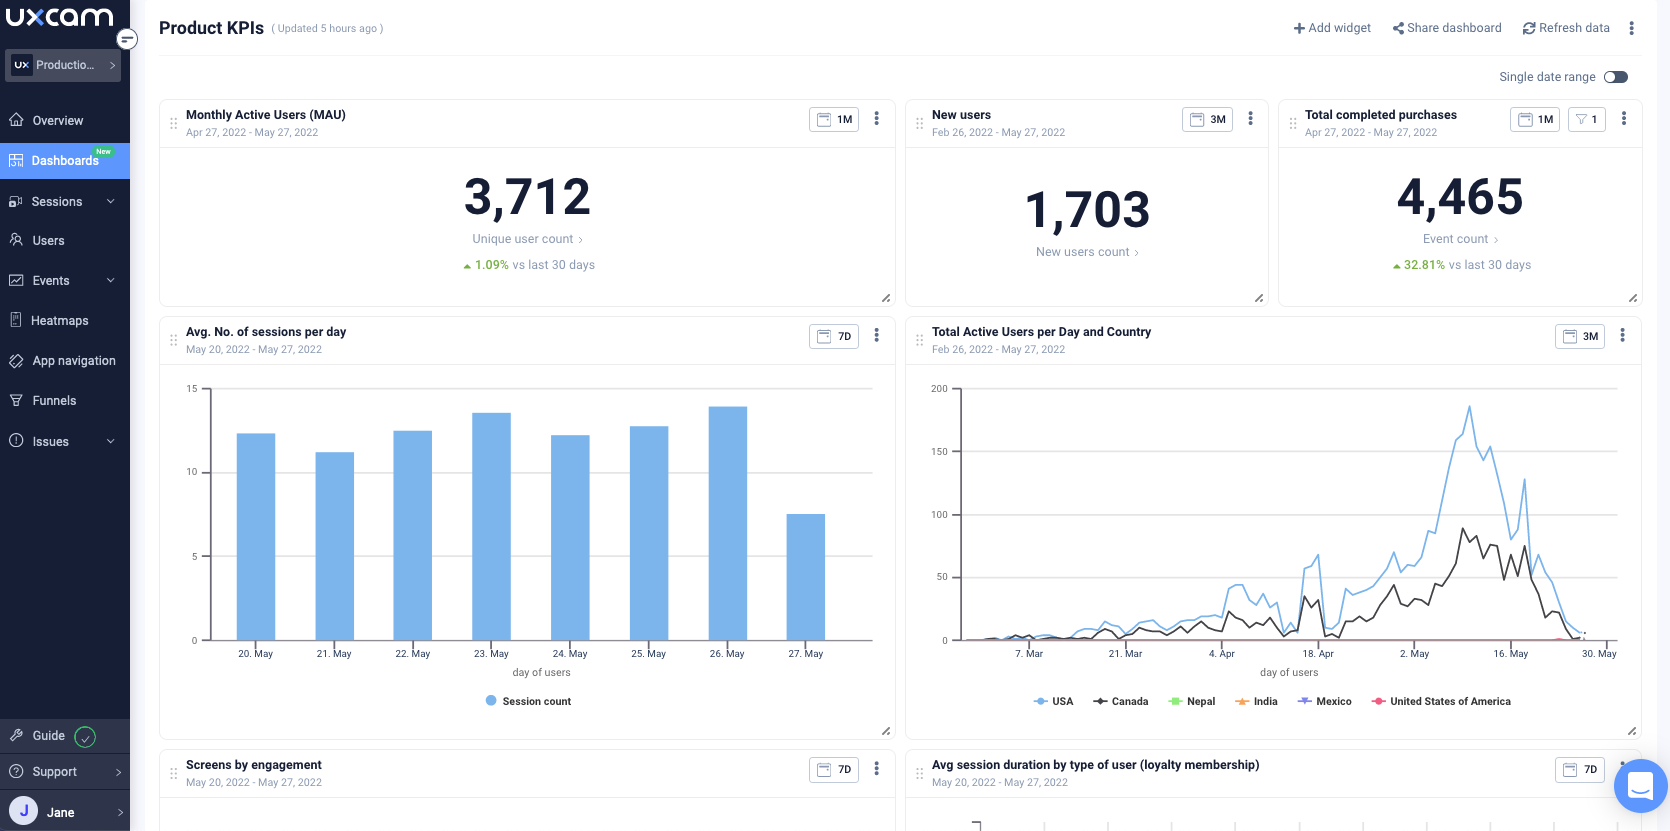
Weekly active users (WAU) and Daily active users (DAU) on the UXCam Dashboard.
Downloads
App downloads show how many people downloaded your app in a certain period of time. It's quite a straightforward metric that you need to track to understand what influences the increase or decrease in app downloads. Also, as a product manager, you need to keep an eye on your competitor's downloads. Analyzing their performance gives an overview of the market situation and insights into your app improvement.
You might also be interested in The most important Mobile App Analytics Metrics to Measure
App Engagement metrics
Engagement metrics are important to track as they provide a clear answer if users really use your app. There are different engagement-related metrics to consider during app engagement analysis:
Session Length
Session Interval
Screen Views and Engagement Flow
Events
Social Interaction
Retention Metrics
By tracking the retention rate, you can analyze how many users are still using your app after a certain period of time. The higher the retention rate, the better. If your retention rate is low, you need to analyze why people leave your app. The reasons can differ from a not satisfying design to simply limited features inside an app. As a product manager, it's your task to figure it out and take action.
Revenue metrics
One of the essential tasks for product managers is to ensure that the company will get more revenue with new app improvements. Otherwise, why would you invest your time and budget in launching new features or improving the app? The list of financial metrics can be very detailed, but here are the most crucial revenue metrics that product managers should constantly track:
Average Revenue Per User (ARPU)
Lifetime Value (LTV)
Customer Lifetime Value (CLV)
Return On Investment (ROI)
Time To First Purchase
Mobile app metrics to track for UX & UI Designers
Metrics are not the first thing that comes to mind when thinking about design. However, metrics play a significant role in understanding the satisfaction level of users. Here are the most crucial indicators that UX & UI designers need to look at.


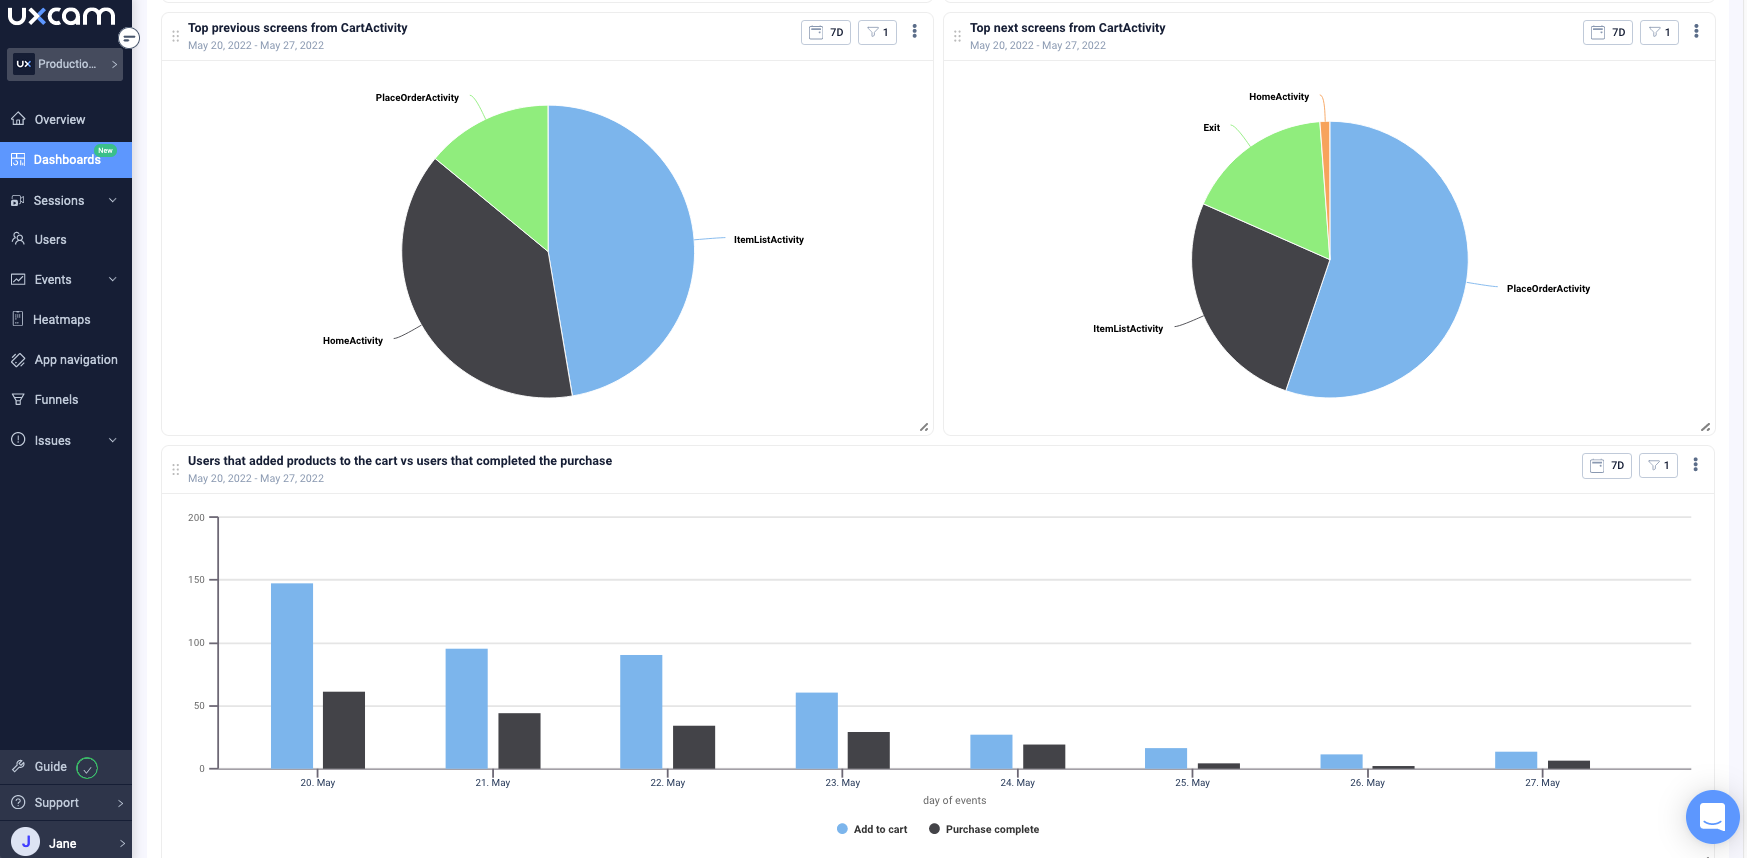
Cart activity shown in dashboard from UXCam.
Activation rate
Inviting people to download your app is one thing, but activating users is another task. The activation rate indicates the number of people who downloaded your app versus those who completed the onboarding process and activated your app. This metric is essential for UX & UI designers as it might indicate the issues with user experience in the initial steps.
You might also be interested in: The ultimate app KPI cheat sheet
Abandonment rate
Depending on the app goal, the abandonment rate is the ratio number of abandoned goals to the number of initiated actions towards completing a goal. For example, you are working on the design of a retail app. In this case, you need to track how many users put an item into a shopping cart but didn't complete a transaction.
Task Time
The shorter is time to completion, the better. In some specific cases, when the goal is to engage users more, you might aim for users to complete a task for a longer time. However, remember that users don't like to meet many steps to archive their goals. Therefore, the more intuitive your design is, the faster users navigate inside the app.
Task success
The task success metric overlaps with the task time metric but aims to identify the task success rate in percentage. The best way to measure this metric is to conduct focus groups. Depending on the number of user representatives, you can deduct margin and error and indicate the success rate of the specific tasks inside the app. The results help to understand where and what might distract users from completing their goals in the app, which could then be improved on the design level.
Customer Satisfaction Score
A customer Satisfaction Score is essential not only for designers but also for developers. However, tracking this indicator helps understand which changes improved or worsened user experience. You can measure it by app's ratings and referrals or push in the survey in your app.
Mobile app metrics to track for Growth Marketers
As a mobile growth marketer, you will probably focus on growing your app user acquisition (UA). Rather your main focus is organic or paid UA, or even both, here are the essential indicators of your app growth.


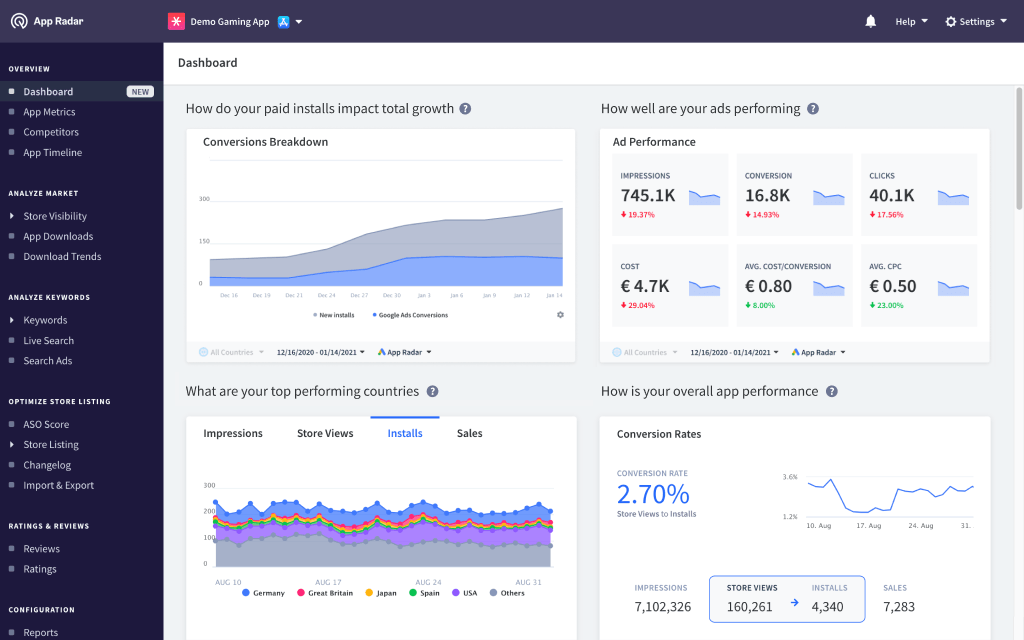
Conversion break downs on dashboard from App Radar.
User Growth Rate
To ensure that your app is growing, you need to track the user growth rate. Also, continually analyze the rate changes to identify which particular events increase or decrease the number of users in your app.
((Present – Past) / (Past)) X 100
Installs & Uninstalls
The difference between downloads and installs is that app installs are complete download actions. In other words, if someone downloaded an app, it doesn't mean that they completed the setup process. That's why it is vital to keep track of actual installations.
At the same time, uninstalls will indicate the number of users who uninstall your app from their mobile devices. For growth managers, it is important to know when and why users made this decision and what you can communicate to your team to improve the uninstallation rate.
Upgrades
If your app offers an upgrading option (premium or paid), you need to track the number and timing of upgrades to answer the following questions:
How long does it take a user who has installed or registered for the app to upgrade?
What percentage of users upgrade versus using a free or basic version?
Is the upgraded version rated higher than the basic version, or are they similarly rated?
Answering these questions will allow you to calculate the valuation of your mobile app.
Paid Conversion Rate
To see real growth, you also need to invest money into ads. Therefore, calculating the conversion rate via paid advertising will show you a paid conversion rate. It includes all types of advertising (from Social Media to display ads). In other words, it covers any other method of marketing your mobile app that involves a direct exchange of money for mentions or views.
Cost Per Install (CPI)
Cost per install measures your customer acquisition costs for customers that installed your app after seeing an advertisement. It tracks paid installs rather than organic ones.
Ad Spend / # of Installs Directly Tied to Ad Campaign
Organic Conversion Rate
The conversion rate via unpaid discovery is another important metric to track your app growth. Since the growth manager can also take the role of App Store Optimization manager, here are some additional metrics for tracking the success of your ASO:
Keywords
App Store Category Ranking
Views To Installs
Reviews
Ratings
Mobile app metrics to track for iOS and Android developers
As a mobile developer, one of your main goals is to provide users with a fast-loading app and avoid possible crashes and bugs. Well, easier said than done. However, tracking the following metrics will help you improve the user experience in time.
Load Time
Load time is the amount of time it takes to load an app from the first tap until it's available to use. It also relates to in-app screens and how long it takes the user to move from one screen to the next.
The faster the app loads, the more appealing the user experience becomes. Your load times should almost always be as short as possible.
API Latency
API latency is the time interval between your API proxies being called or triggered and their response or load time. Aim to keep this number low. This metric is tied to load time and the corresponding user behaviors.
Devices
Knowing what devices your users use to interact with your app allows developers to avoid displaying issues or bugs. Moreover, developing Android and iOS apps requires different coding. Therefore, it is essential to know what devices your target clientele prefers and invest more time and money into the specific device.
Operating system (OS)
Your app should be of the same high-development quality on different operating systems. Therefore, developers should track crash or uninstall rates for all OS. If you have more issues with one of the OS, try to get to the bottom of why it is happening and solve any problems.
Screen Dimensions/Resolution
Every time iOS and Android developers make some app updates, they need to ensure that it appears correctly in different resolutions. Therefore, KPIs like Screen Dimensions/ Resolution come to help. Also, correlate it with app performance metrics like uninstalls or crashes to get more extensive insights.
Mobile app metrics to track for Backend Developers
Core metrics that backend developers should track intersect with KPIs of iOS and Android developers. Therefore, keep an eye on the metrics mentioned above and consider including the following KPIs in your mobile app metrics analytics.
Crashes
Neither users nor developers like when the app crashes frequently. Keeping track of the number of crashes that occur and when they happen is necessary to improve the performance of the user process. Moreover, tracking this mobile metric also allows developers to improve the user experience and the retention rate of their apps.


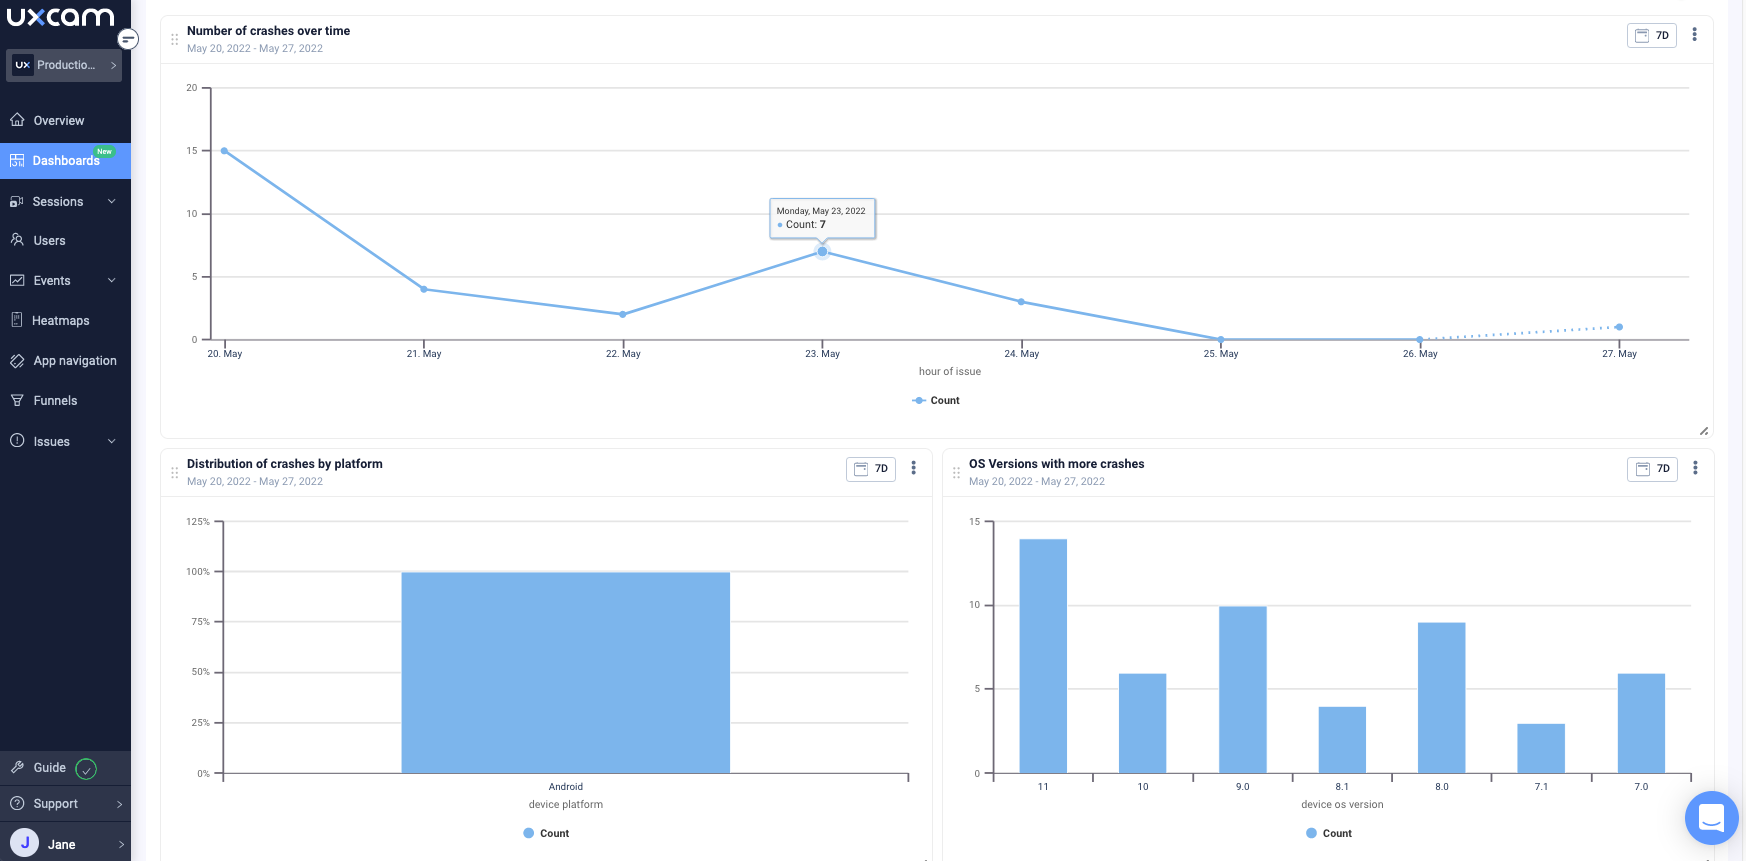
Crashes over time on UXCam dashboard.
Permissions Granted
The amount of access or permissions that your customers allow via your app.
Server response time
Besides a user-friendly design and excellent user experience, users also demand fast app response time. If your app is slow, most probably, it's because your backend server response time is slow. Monitoring server response time will help you react faster to any server issues.
Time to first byte
Time to the first byte measures the time from when a user first initiates a web request to when the first byte of the requested data appears on the end user's device. So, this mobile app metric is essential for backend developers to track, as it helps to establish the app response times that match users' expectations.
Connection times
As a developer, you might know that opening up too many connections in a mobile app can create resource management issues. Therefore, keep an eye on your connection times to avoid these problems.
Sum up: What are the essential mobile app metrics to track
The essential mobile app metrics that you need to track always depend on your goals. The bigger team is, the more goals it tries to achieve. However, there are some essential mobile metrics that the app team should track:
User growth rate
Retention rate
Conversion rate
Churn rate
Daily Active Users (DAUs)
Monthly Active Users (MAUs)
Session length, interval & depth
Average screens per visit
Now, as you know all the mobile app metrics analytics for each job role, you can improve your performance and grow the apps more confidently.
Related articles
What is Mobile Analytics? App Analytics Guide: definition, tools and best practices
AUTHOR
Iryna Lukashuk
Iryna is a digital marketing and social media specialist. She is fond of creating content for app marketers and developers to help them succeed in the competitive app business world.
TABLE OF CONTENTS
- Mobile app metrics to track for Product Manager
- Mobile app metrics to track for UX & UI Designers
- Mobile app metrics to track for Growth Marketers
- Mobile app metrics to track for iOS and Android developers
- Mobile app metrics to track for Backend Developers
- Sum up: What are the essential mobile app metrics to track


Related articles


Mobile app analytics
12 Mobile App Analytics Metrics That Actually Matter in 2026
Mobile app analytics metrics are the quantitative signals product teams use to measure performance, engagement, and...


Silvanus Alt, PhD
Founder & CEO | UXCam


Mobile app analytics
Mobile App Retention Benchmarks by Industry (2026)
Mobile app retention benchmarks for 2026, broken down by industry. Day-1, day-7, day-30 retention rates for fintech, ecommerce, social, gaming, and more,...
Silvanus Alt, PhD
Founder & CEO | UXCam


Mobile app analytics
Sentry vs Datadog: Features, Pricing, and Which One Fits Your Production Stack
Sentry vs Datadog compared head-to-head on features, pricing, and the production stacks each one...
Silvanus Alt, PhD
Founder & CEO | UXCam