Mobile App Retention Benchmarks by Industry (2026)


Mobile app retention benchmarks are the numbers every PM Googles at some point, usually when their CEO asks "is our retention good or bad?" and they realize they don't actually know. The honest answer is almost always "it depends what you're comparing against." Benchmark data helps, but only if you're honest about which segment your app fits into and what the numbers actually mean.
Below are the 2026 retention benchmarks I use when advising mobile teams, with the data sources and methodology disclosed so you can verify the numbers yourself.
Day-30 retention varies dramatically by category. Social apps top out near 15-20% for strong performers, ecommerce sits around 3-6%, fintech 10-15%, gaming 4-8%, and productivity 10-18%. The median across all categories remains stubbornly low, around 4%. That's the data floor most teams compete against.
Data sources and methodology
The benchmarks in this guide are compiled from three public sources, cross-referenced against anonymized patterns from UXCam's customer base (37,000+ apps across 50+ countries):
AppsFlyer State of App Marketing 2025 (published Q1 2026, covering 2025 full-year data). AppsFlyer's annual report aggregates anonymized retention data across 28B+ app installs. I used their category-level day-1, day-7, and day-30 numbers as the primary baseline.
Adjust Mobile App Trends 2026 (published February 2026). Adjust's report covers install trends, retention benchmarks, and attribution data across 100K+ apps. I used their retention-by-vertical breakdowns to validate AppsFlyer's numbers.
data.ai (formerly App Annie) State of Mobile 2026 (published January 2026). data.ai's annual report provides market-level context on engagement, revenue, and time-spent-in-app trends. I used their engagement data to contextualize the retention benchmarks.
UXCam anonymized product data (ongoing). UXCam's session-level data across its customer base provides a qualitative cross-check on retention patterns. I reference this directionally (e.g., "common patterns I see in session replays") rather than as precise statistical benchmarks.
Where sources disagree (and they sometimes do by 3-5 percentage points), I used the AppsFlyer number as the primary and noted the range. The "strong performer" column represents roughly the 75th percentile; "median" represents the 50th.
Key takeaways
Day-30 retention under 5% is the norm across most mobile app categories, which is both useful benchmark context and a reminder that mobile retention is genuinely hard.
Don't benchmark against "industry average" if your app has a specific use case. A niche fitness app and a broad fitness app have different retention dynamics even inside the same category.
Cohort retention matters more than aggregate retention. A rising overall retention number can hide worsening per-cohort retention if you're growing user volume, and vice versa.
The single most predictive metric for day-30 retention is day-1 completion rate of a meaningful first action. Apps that nail first-session activation retain at 2-3x the rate of apps that don't, regardless of category.
Tara, UXCam's AI analyst, is particularly useful for retention analysis because it compares cohorts automatically and surfaces the specific behaviors that distinguish retained users from churned ones. That insight usually beats a benchmark table for deciding what to fix.
Mobile app retention benchmarks
The numbers below reflect strong-performing apps (roughly the 75th percentile) in each category. The median is lower, often meaningfully lower. Use these as targets to aim at, not as averages you should already be hitting.
Overall benchmarks (all categories)
| Metric | Strong performer (75th percentile) | Median |
|---|---|---|
| Day-1 retention | 30-40% | 25% |
| Day-7 retention | 10-15% | 8% |
| Day-30 retention | 5-8% | 4% |
Retention drops sharply in the first week, then the decline slows. A typical mobile app loses 75% of its users within the first three days of install. Week-over-week retention past day 30 tends to stabilize around 2-4%.
Social apps
| Metric | Strong performer | Median |
|---|---|---|
| Day-1 | 50-60% | 40% |
| Day-7 | 25-30% | 18% |
| Day-30 | 15-20% | 12% |
Social apps have the strongest retention curves because their network effects compound: the more friends a user has in the app, the harder it is to leave. Whatsapp, Messenger, and Instagram sit well above these numbers. Breakout social apps (BeReal, Threads, Bluesky) spike early and often regress toward the median over a year.
Ecommerce apps
| Metric | Strong performer | Median |
|---|---|---|
| Day-1 | 25-30% | 18% |
| Day-7 | 8-12% | 5% |
| Day-30 | 3-6% | 2% |
Ecommerce retention curves are more spiky than most categories because purchase behavior is episodic. A user might "churn" for 30 days and then make a major purchase on day 45. DAU/MAU is a less useful metric here than monthly active buyers or 90-day repeat-purchase rate.
Fintech apps
| Metric | Strong performer | Median |
|---|---|---|
| Day-1 | 35-45% | 28% |
| Day-7 | 18-25% | 12% |
| Day-30 | 10-15% | 7% |
Fintech retention is driven heavily by habitual check-ins (balance, transactions, spending) rather than by major purchases. Neobanks and investing apps have stronger retention than one-off payment apps. Note: fintech retention numbers shifted materially after Apple's App Tracking Transparency because attribution got harder, so 2020-2022 fintech benchmarks aren't directly comparable to today's.
Gaming apps
| Metric | Strong performer | Median |
|---|---|---|
| Day-1 | 40-50% | 32% |
| Day-7 | 12-18% | 8% |
| Day-30 | 5-8% | 3% |
Gaming has the steepest day-1 to day-7 decline because most players churn after completing (or getting bored with) the initial content. The top 10% of games have very long-tail retention because monetization depends on the whales who stay engaged for months. Median gaming retention is lower than most other categories because of this bimodal distribution.
Productivity apps
| Metric | Strong performer | Median |
|---|---|---|
| Day-1 | 40-50% | 30% |
| Day-7 | 22-28% | 15% |
| Day-30 | 12-18% | 8% |
Productivity apps have some of the most durable retention curves because they get woven into users' workflows. Notion, Todoist, and Evernote-style apps above this range have a strong first-week activation and habit-forming pattern (daily entry, recurring reminders, integration with other tools).
Health and fitness apps
| Metric | Strong performer | Median |
|---|---|---|
| Day-1 | 35-45% | 25% |
| Day-7 | 15-22% | 10% |
| Day-30 | 8-12% | 5% |
Fitness apps have the largest seasonal swing (January spike, summer bump, fall decline). Annual retention benchmarks often hide that seasonality. Always compare fitness retention cohort-over-cohort within the same quarter, not year-over-year aggregates.
Streaming and media
| Metric | Strong performer | Median |
|---|---|---|
| Day-1 | 45-55% | 35% |
| Day-7 | 20-28% | 15% |
| Day-30 | 10-15% | 7% |
Streaming retention is driven by content: how much users want to watch and whether new releases give them reasons to come back. The benchmarks here shift significantly based on subscription model (free-with-ads vs paid).
How to Set Your Own Retention Benchmarks
External benchmarks are a starting point. Your own benchmark needs to be calibrated to your specific cohort, acquisition source, and product maturity.
Step 1: use your own historical data first
Your best benchmark is your own past performance. If last quarter's day-30 retention was 6%, you're trying to beat 6%, not the industry median. Start there.


Step 2: segment by acquisition source
Paid acquisition cohorts retain worse than organic. Referral-driven users retain best of all. Mixing these in an overall retention number obscures what's actually happening. I segment by source at minimum.
Step 3: use a retention analytics tool
UXCam's Retention Analytics lets you compare cohort retention side by side, filter by acquisition source and device class, and click straight from a retention drop into the session replays of users who churned that week. That's the diagnostic workflow that turns a benchmark gap into an action item.


Step 4: analyze competitor patterns (carefully)
Tools like data.ai and Sensor Tower estimate competitor retention, but the numbers are modeled, not actual. Use them directionally, not as precise targets.
Step 5: benchmark against your category, not your industry
"Fintech" covers apps as different as a neobank and a crypto exchange. Match your benchmarks to the specific sub-category (retail banking, investing, budgeting, payments, lending) because retention dynamics differ meaningfully between them.
Step 6: use cohort retention, not aggregate
Aggregate retention can rise because you're acquiring more users, even while each cohort individually retains worse. Always look at retention per weekly or monthly install cohort.


Step 7: compare with competitor analysis
When you have competitor data, compare like-for-like: same acquisition channel, similar product maturity, same geographic market. Comparing your newly launched Indian-market app to Instagram's global retention is not a useful benchmark.
Why mobile app retention matters
Retention compounds. If you improve day-30 retention from 5% to 7%, you haven't added 2 percentage points of retention. You've increased your active user base by 40%, which translates to 40% more lifetime revenue, 40% more word-of-mouth referrals, and 40% lower effective acquisition cost.
That compounding is why retention is the most important metric for most mobile apps, more than acquisition numbers or even revenue per user. A company with mediocre retention and strong acquisition will plateau. A company with strong retention and mediocre acquisition compounds.
Why benchmarking matters
Benchmarks give you context for whether your retention is "good" relative to the category. But they also help with internal alignment: when the product team says "our retention is fine" and marketing says "it's bad," a credible external number settles the debate and lets you focus on the harder question (what to do about it).
Best practices to increase mobile app retention
Five patterns I consistently see in apps that retain above category benchmark.
Nail first-session activation. Users who complete a meaningful action in session one retain at 2-3x the rate of users who don't. That's the single highest-leverage retention investment for most apps.
Build a reason to return within 24 hours. Push notifications, in-app reminders, streaks, scheduled content drops. The shape varies by category, but apps above the retention median all have some intentional mechanic that brings users back day-2.
Remove the friction you haven't noticed. Session replays of churned users reveal specific bugs and UX issues that aren't in any dashboard. The top 3 retention wins I've helped teams ship this year were all surfaced by watching sessions, not by analyzing numbers.


Personalize based on behavior. Users behave like other users who behaved like them. Segment by behavior (what features they use, how often, at what depth) and tailor the experience.
Measure cohort retention weekly. Leading apps watch their weekly cohort retention like stock traders watch prices. Weekly cadence lets you catch regressions fast enough to fix them.
Use UXCam to improve your retention
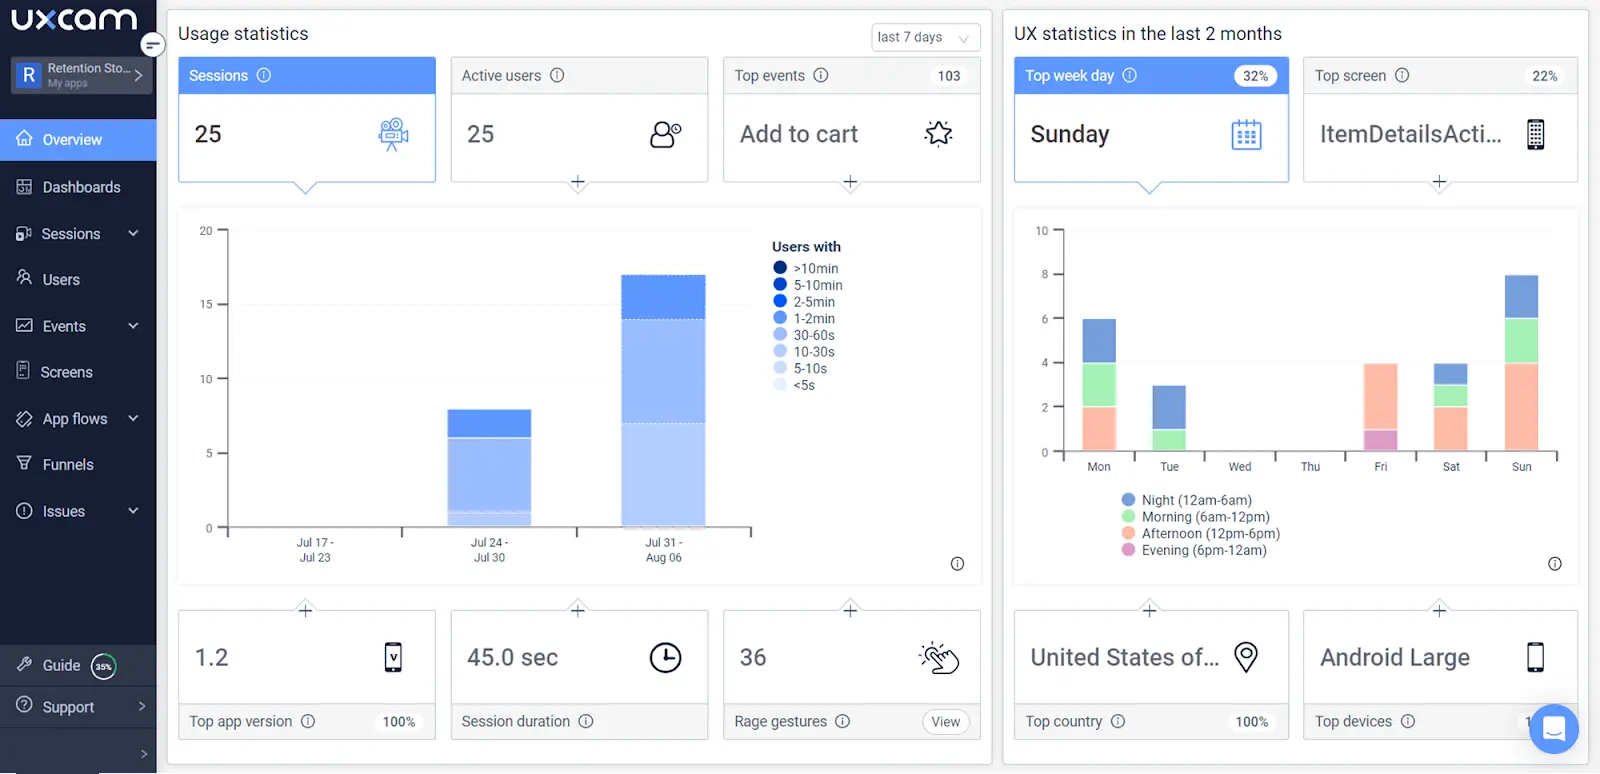
UXCam is a product intelligence platform that automatically captures every user interaction on mobile apps and websites, with no manual event tagging. Retention Analytics measures cohort retention over time, while session replay shows what churned users actually experienced. Tara, UXCam's AI analyst, compares retained vs. churned cohorts automatically and surfaces the behavioral differences, so teams know what to fix without manually reviewing hundreds of sessions.
When a cohort retains worse than the one before it, Tara tells you what those users did differently in session one, which almost always points at a specific, fixable friction point. Every metric in UXCam is backed by real user sessions: see a retention drop, click into the sessions that explain it.
Installed in 37,000+ products, mobile-first, web-ready. Request a demo to see it for your app.
What is mobile app retention?
Mobile app retention is the proportion of users who return to a mobile app over a defined time window after install. It's typically measured at day-1, day-7, and day-30 milestones, with each window telling you something different: day-1 is about first-session quality, day-7 is about habit formation, day-30 is about durable product-market fit.
Frequently asked questions
What's a good retention rate for a mobile app?
Depends on your category. Day-30 retention above 5% is healthy for most B2C apps, above 15% is excellent for social apps, above 10% for fintech. The median across all mobile categories is around 4%. Use category-specific benchmarks rather than an overall average because retention dynamics differ substantially by industry.
How is mobile app retention calculated?
Day-N retention is the percentage of users from a given install cohort who return to the app on day N. Formula: (unique users who opened the app on day N) / (total users in the install cohort) × 100. Track this cohort-by-cohort, not as a rolling aggregate, to see whether each new wave of users is retaining better or worse than the last.
What's the difference between retention and engagement?
Retention measures whether a user comes back. Engagement measures what they do when they're there. You can have strong retention with weak engagement (users open the app but do nothing meaningful) or strong engagement with weak retention (a small group does a lot but most disappear). Apps with strong retention and strong engagement compound. Everything else plateaus.
How do I improve day-1 retention specifically?
Day-1 retention is almost entirely about first-session quality. Watch session replays of users who churned within the first day. Look for specific friction: permission prompts firing too early, confusing onboarding, a dead-end screen, a crash. Fix the top friction point first. Most teams find 3-5 specific issues that together account for 30-50% of day-1 churn.
What's the difference between DAU and retention?
DAU measures today's active users. Retention measures whether users from a past cohort come back. A stable DAU with declining cohort retention is an unstable pattern (new users replacing churning old users). Always look at both together. Retention curves for specific install cohorts tell you whether the product is actually getting stickier.
What retention tools should I use?
For benchmark data, AppsFlyer, Adjust, and data.ai publish annual reports. For your own retention analysis, use your product analytics platform (UXCam, Amplitude, or Mixpanel for retention cohorts) plus a session replay tool to diagnose why churned cohorts left. The combination matters: dashboards tell you retention moved. Replays tell you why.
AUTHOR
Silvanus Alt, PhD
Founder & CEO | UXCam
Silvanus Alt, PhD, is the Co-Founder & CEO of UXCam and a expert in AI-powered product intelligence. Trained at the Max Planck Institute for the Physics of Complex Systems, he built Tara, the AI Product Analyst that not only analyzes user behavior but recommends clear next steps for better products.


Related articles

Mobile app analytics
12 Mobile App Analytics Metrics That Actually Matter in 2026
Mobile app analytics metrics are the quantitative signals product teams use to measure performance, engagement, and...
Silvanus Alt, PhD
Founder & CEO | UXCam
Mobile app analytics
Mobile App Retention Benchmarks by Industry (2026)
Mobile app retention benchmarks for 2026, broken down by industry. Day-1, day-7, day-30 retention rates for fintech, ecommerce, social, gaming, and more,...
Silvanus Alt, PhD
Founder & CEO | UXCam


Mobile app analytics
Sentry vs Datadog: Features, Pricing, and Which One Fits Your Production Stack
Sentry vs Datadog compared head-to-head on features, pricing, and the production stacks each one...
Silvanus Alt, PhD
Founder & CEO | UXCam