How to Improve Mobile App Performance: Complete Guide 2026


"Mobile app performance" is one of those phrases that means different things depending on who's saying it. An SRE thinks about uptime and API latency. A native developer thinks about frame rate and memory leaks. A product manager usually means "users aren't complaining about the app being slow." All three matter, but I'm going to focus on the last one, because it's the layer most product teams under-invest in.
Mobile app performance is the app's ability to deliver a fast, reliable, and crash-free experience on the devices your users actually have. For product teams, this means monitoring launch time, frame rate, crash-free sessions, UI freezes, and rage taps, and connecting each one to user behavior via session replay.
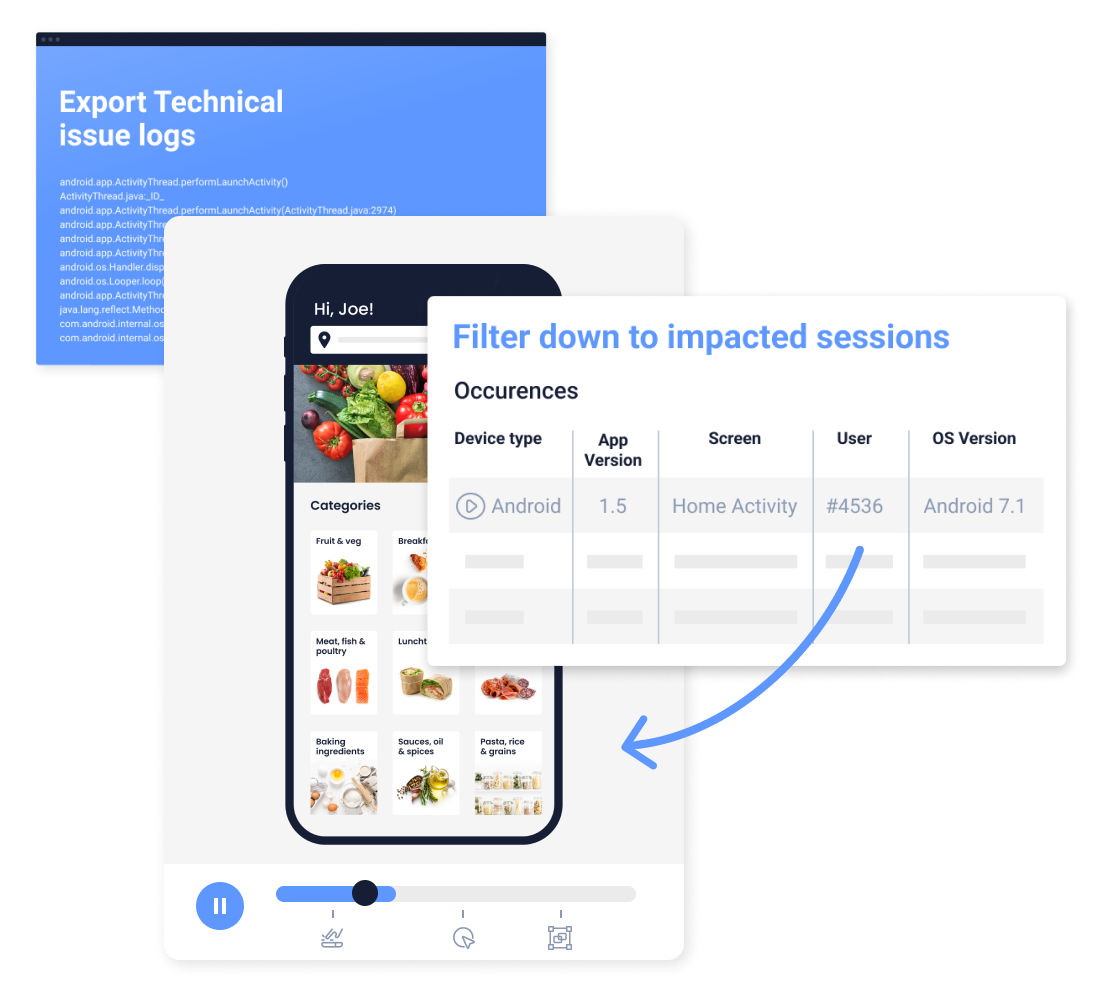
The technical side of performance (build pipelines, instrumentation, crash reporting) matters. But in practice, the gaps that hurt user-facing performance aren't usually the ones the dev team is already watching. They're the unresponsive button on slow Android devices, the onboarding flow that skips past mid-tier phones, the UI freeze that happens when users scroll fast. Technical monitoring rarely catches those. Session replay does.
Key takeaways
Users don't care about your Core Web Vitals equivalent. They care about whether the button they tapped responded, whether the app opened fast enough for them to not give up, and whether it crashed on the phone they own. Your performance metrics should measure what users feel, not just what your APM dashboard shows.
The single biggest performance win for most mobile apps is reducing cold-start time below 2 seconds. Users decide whether to engage within the first 3 seconds, and a slow launch disproportionately punishes first-session retention.
Most performance problems I surface in session replays aren't "the app is slow." They're specific: a button that doesn't respond on slower phones, a tap that needs a second to register, a modal that steals focus mid-scroll. Specific beats general every time.
Pair technical monitoring (APM like Firebase Performance, Datadog Mobile RUM, Sentry) with behavioral monitoring (session replay, rage-tap detection). Technical tools tell you what failed. Session replays tell you which specific user interactions the failure broke.
Tara, UXCam's AI analyst, automatically ranks UX performance issues by business impact, so you fix the three things that matter this week instead of the forty things that showed up in your dashboard.
What is mobile app performance?
Mobile app performance is the combined measure of how fast, responsive, and reliable an app feels to its users. That covers several distinct layers that teams often conflate:
Technical performance: frame rate, memory usage, CPU load, API response times, error rate
Launch performance: cold start time, warm start time, time-to-interactive
Reliability: crash-free sessions, crash-free users, ANR rate on Android
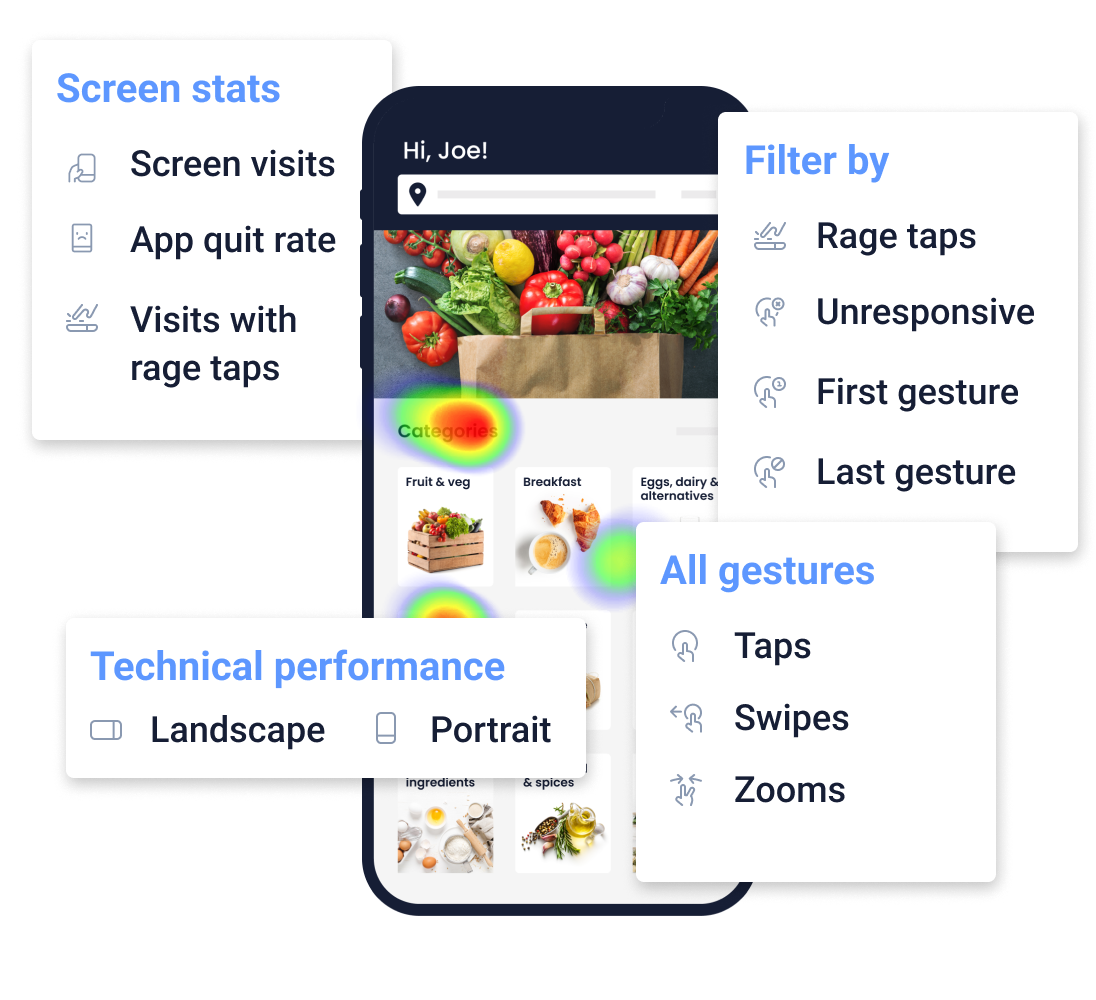
Perceived performance: rage taps, UI freezes, navigation friction, time between user intent and feedback
Product teams usually track the first three. The fourth is where session replay earns its keep, because it measures what users actually feel. An app can have excellent technical metrics and still feel slow if the right interactions aren't responding quickly enough.
Why improve mobile app performance?
Three concrete reasons that matter to almost every mobile team.
First-session retention: users decide within the first 3 seconds whether they'll engage with a new app. If cold start is over 3 seconds, your install-to-active conversion takes a measurable hit. Apps that get cold start below 1.5 seconds consistently out-retain comparable competitors.
Core business metrics: crashes, ANRs, and UI freezes correlate directly with churn. Users who experience one crash in their first session churn at roughly 3x the rate of those who don't. Fixing the top 5 crash sources is one of the highest-ROI performance investments any team can make.
Support cost: vague "the app is slow" support tickets are expensive to triage. Specific performance bugs caught by session replay are cheap to fix. Recora reduced support tickets by 142% after UXCam surfaced a specific "press-and-hold vs tap" confusion among elderly users. That's what happens when you catch the specific UX behavior causing the complaints, not just the aggregate complaint rate.
How to improve mobile app performance
Eight steps in priority order. The first three move the needle for most apps; the rest are incremental gains.
Step 1: Measure the right performance metrics


You can't improve what you don't measure. But measuring the wrong thing wastes engineering time and distracts from the issues users actually care about. The metrics I'd pin to the dashboard for any mobile app:
Cold start time (target: <2 seconds for 95th percentile)
Crash-free sessions (target: >99.5% for production apps)
Crash-free users (target: >99% daily)
ANR rate on Android (target: <0.47% per Google Play Console guidance)
Average frame rate during core interactions (target: >50 fps)
Rage-tap events per session (target: trending down over time)
UXCam's Issue Analytics surfaces these automatically and ranks them by how many users are affected. Tara AI goes one step further by flagging patterns like "rage taps spiked 3x on the new onboarding screen this week" so you don't miss the diagnostic needle in the haystack.
Step 2: Minimize cold start time
Cold start time is the duration between app launch and the first interactive screen. Below 2 seconds is good, below 1.5 is excellent, above 3 is hurting your retention measurably.
The usual culprits I find in cold-start audits:
Synchronous network calls in the launch path (move to lazy)
Large third-party SDKs initializing on the main thread
Splash-screen animations that don't let users interact (even if the data is ready)
iOS main thread bottlenecks in ViewController setup
Android app startup profiling (use the Macrobenchmark library)
Fix the worst one. Ship. Measure. Then fix the next.
Step 3: Monitor UI freezes and ANRs


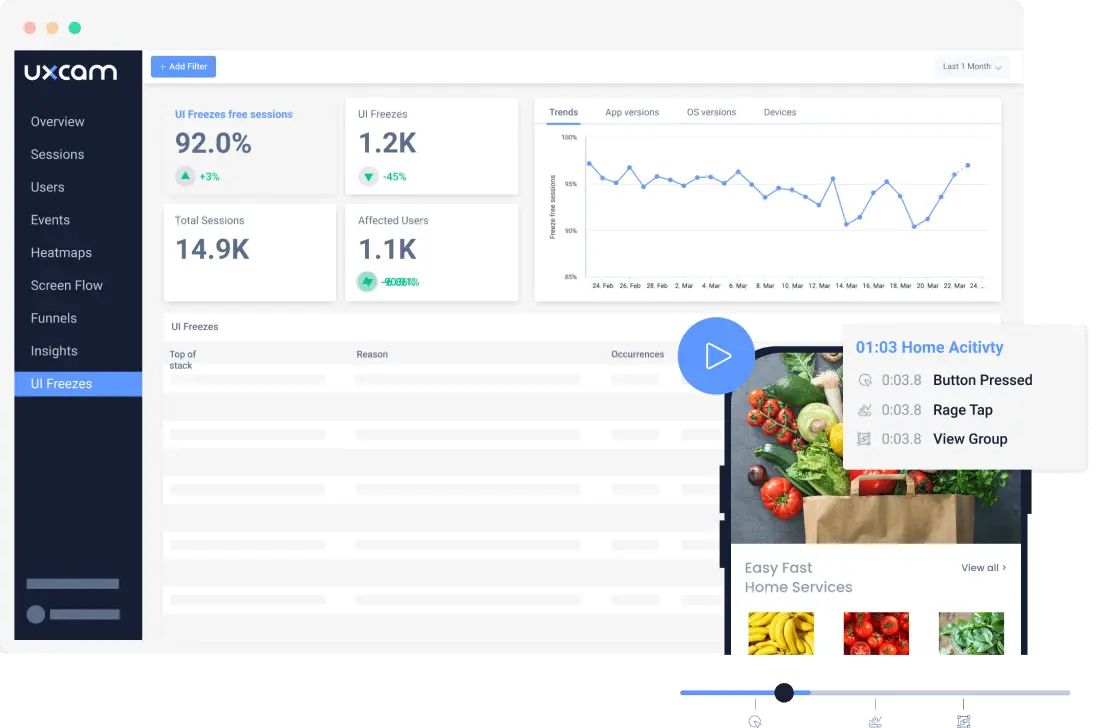
UI freezes are moments where the app stops responding for 2+ seconds. Android calls them ANRs (Application Not Responding) when they cross 5 seconds. Both kill retention, and both are often invisible to the team because nobody on the team has the phone or the network condition that triggers them.
Track freezes on real devices. Prioritize by how many users are affected, not by frequency. A 2-second freeze during signup that hits 10% of new users is worse than a 4-second freeze during a rarely-used settings screen.
Step 4: Design for the devices your users actually own
This is where I see the biggest gap between "performs well in staging" and "feels broken to users." The device you test on matters enormously.
In my experience, most mobile teams over-index on iPhones and under-index on mid-range Android. Your users are disproportionately on the devices your team doesn't own. Check Firebase or Google Play Console for your actual device mix, then make sure your QA process covers the most common mid-range phones. Tools like BrowserStack and LambdaTest run tests on real device cloud instances when you don't have the hardware locally.


Step 5: Cut non-essential features
The fastest performance optimization is the feature you don't ship. Every new feature adds weight to cold start, memory footprint, and test surface. Before shipping a new feature, ask: does this feature's expected engagement justify the performance tax it adds?
I've watched teams grow their cold-start time by 400ms over a year by shipping useful-but-not-critical features. That 400ms cost them measurable first-session retention.
Step 6: Design smart carousels and navigation patterns
Horizontal scrolling carousels, bottom-nav tabs, and side drawers all have performance implications. Carousels with auto-scroll animations drop frame rate on older phones. Drawers that load content lazily sometimes create perceptible delays. Test these specifically on mid-range Android before shipping.
Step 7: Preload what users will see next
Predictive preloading (fetching data for the screen the user is likely to navigate to) can materially improve perceived performance. Common patterns: preload the home screen while the user watches your splash, prefetch the detail view for the top result in a list, cache the most-viewed product images.
Step 8: Test and monitor crashes proactively
Use a crash reporting tool (Firebase Crashlytics, Sentry, Bugsnag) and set up alerts for any crash that affects more than 0.5% of users within 24 hours. The top 5 crashes usually account for 80% of crash impact, so the Pareto rule applies. Fix those first, ship, measure, repeat.
Step 9: Optimize image and media loading
Images are the second-most-common performance bottleneck I see after synchronous network calls. Use WebP or AVIF formats instead of PNG/JPEG. Implement progressive loading so users see a placeholder before the full image loads. Set aggressive cache policies for static assets. For apps with user-generated content (profiles, photo feeds), lazy-load images below the fold and limit resolution to what the device actually displays.
Step 10: Set up performance regression alerts
Performance degrades gradually with every release. The fix: set up CI alerts that flag performance regressions before they ship. Monitor cold-start time, frame rate, and memory peak as part of your release pipeline. Firebase Test Lab and Bitrise both support automated performance testing on real device matrices. The teams I've seen maintain sub-2-second cold start over multiple years all had automated performance gates in their CI.
Mobile app performance monitoring tools
Break tools into two categories: technical APM (what the code is doing) and behavioral UX monitoring (what users are feeling).
Technical APM tools:
Firebase Performance Monitoring (free, good for Android + iOS)
Sentry (crashes + performance, good SDK quality, reasonable pricing)
Datadog Mobile RUM (enterprise, integrates well with backend Datadog)
Embrace (mobile-specific APM, strong reliability focus)
Instabug (bug reporting + APM combined)
UX performance tools:
UXCam (session replay + Issue Analytics, rage tap + UI freeze detection)
FullStory (web-heavy, weaker mobile)
Hotjar (web-focused)
Most teams need one from each category. Technical tools tell you a crash happened. UX tools tell you which specific user interactions the crash broke. The combination is more useful than either alone.


Mobile app performance KPIs
The performance metrics I'd actually track, grouped by category:
General performance:
Cold start time (p50, p95)
Frame rate during core interactions
Memory usage peak
Reliability:
Crash-free session rate
Crash-free user rate
ANR rate (Android)
Hang rate (iOS)
UX performance:
Rage taps per session
Dead clicks per session
UI freeze rate
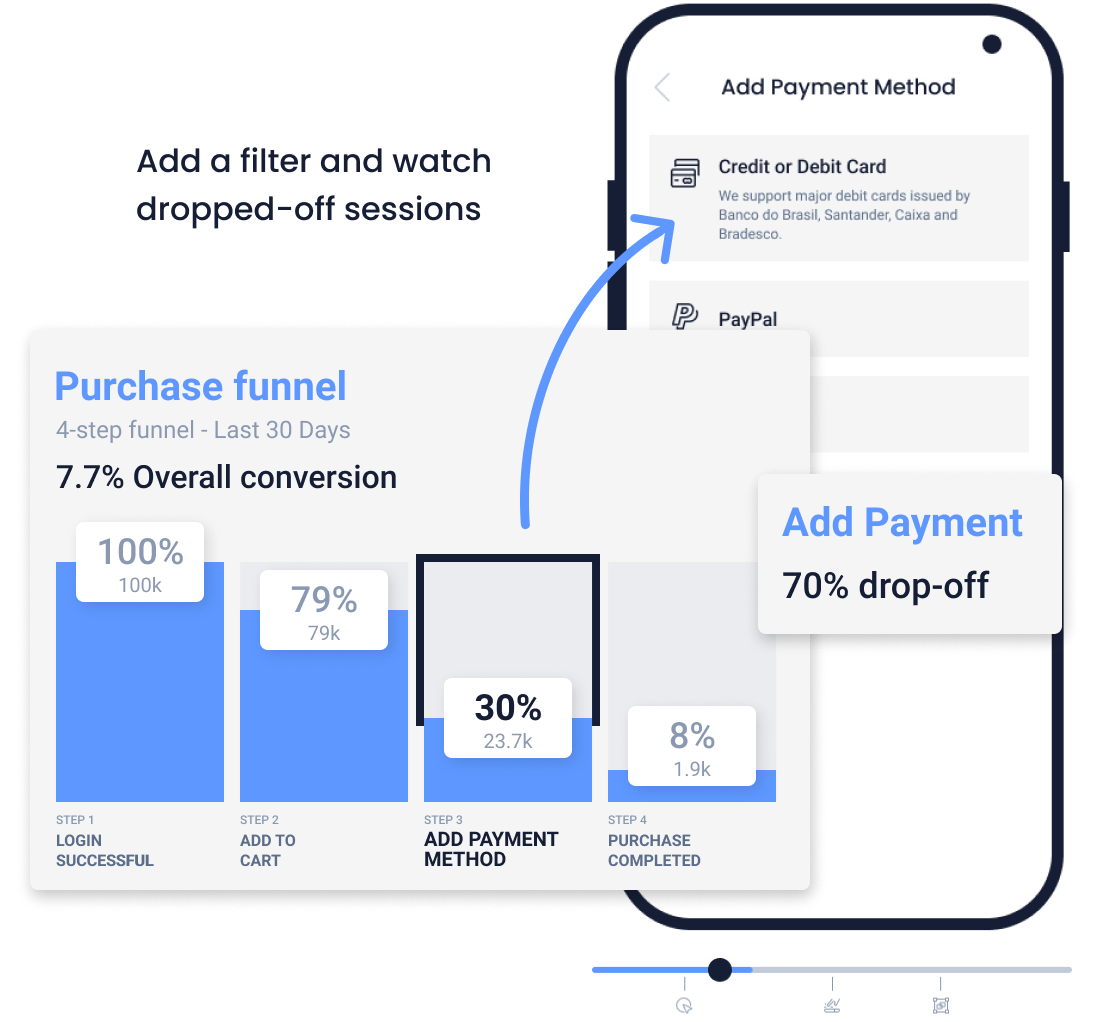
Abandoned navigation (started a flow, left before completion)
Engagement (performance-adjacent):
First-session completion rate
Day-1 retention by device class
Session duration by device class
Device class matters a lot. A 95th-percentile cold start that looks great overall might hide terrible performance on the 30% of users on mid-tier Android phones. Segment by device.
Improve mobile app performance with UXCam
UXCam is a product intelligence platform that automatically captures every user interaction on mobile apps and websites, with no manual event tagging. Issue Analytics detects and prioritizes UX performance problems (crashes, UI freezes, rage taps, unresponsive gestures) in real time and ranks them by how many users are affected. Combined with session replay, you see not just that something went wrong, but exactly what the user was trying to do when it did. Tara, UXCam's AI analyst, processes these sessions to recommend specific fixes, giving teams evidence-based insights and the evidence to convince stakeholders.
Inspire Fitness used this workflow to boost time-in-app by 460% and reduce rage taps by 56%. PlaceMakers identified a performance problem, tested a fix, and validated the result in 3 days. UXCam's SDK has been refined for over 9 years, sits under 300KB, uses less than 5% CPU, and is installed in 37,000+ products.
Request a demo to see it for your app.
Frequently asked questions
What is mobile app performance?
Mobile app performance is the combined measure of how fast, responsive, and reliable an app feels to its users. It covers technical performance (frame rate, memory, CPU), launch performance (cold start time), reliability (crash-free sessions, ANR rate), and perceived performance (rage taps, UI freezes, navigation friction). The first three are what most teams track. The fourth is what users actually feel, and where the biggest improvement opportunities usually live.
How do I measure mobile app performance?
Use two categories of tools: technical APM (Firebase Performance, Sentry, Datadog Mobile RUM) for the engineering metrics, and behavioral tools (UXCam, Instabug) for the UX metrics. Track cold start time, crash-free sessions, ANR rate, and rage-tap rate at minimum. Segment every metric by device class, because mid-range Android performance is usually much worse than flagship iPhone performance and hides in an overall average.
What's a good cold start time for a mobile app?
Below 2 seconds is good for most apps, below 1.5 seconds is excellent, above 3 seconds hurts first-session retention measurably. Target the 95th percentile, not the average, because users on slower devices and slower networks are the most vulnerable to churn and usually the ones you're worst at serving.
What's the difference between APM and UX performance monitoring?
APM (Application Performance Monitoring) tools like Firebase Performance, Sentry, and Datadog measure what the code is doing: API latency, frame rate, crash rate, memory. UX performance tools like UXCam measure what users are feeling: rage taps, UI freezes, abandoned flows, navigation friction. Most teams need both. APM tells you something broke. UX tools tell you which specific user interaction the break affected.
How do I reduce mobile app crashes?
Start with a crash reporting tool (Firebase Crashlytics, Sentry, Bugsnag) and prioritize by user impact, not frequency. The top 5 crashes usually account for 80% of crash impact. Fix those first, ship, measure, repeat. Don't aim for zero crashes. Aim for a crash-free user rate above 99%, with no single crash affecting more than 0.5% of users in 24 hours.
Does app performance affect retention?
Yes, directly. Users who experience a crash in their first session churn at roughly 3x the rate of those who don't. Apps with cold start above 3 seconds see measurably worse install-to-active conversion. UI freezes in the onboarding flow disproportionately hurt first-session completion. Performance issues compound: one bad experience early makes every future session less likely.
What performance metrics should a product manager track?
Three at minimum: cold start time at the 95th percentile, crash-free user rate, and rage-tap rate. All three are user-facing, easy to communicate, and tightly correlated with retention. Add ANR rate on Android as a fourth if your app is available there. More metrics than that and nobody on the team will look at them.
AUTHOR
Silvanus Alt, PhD
Founder & CEO | UXCam
Silvanus Alt, PhD, is the Co-Founder & CEO of UXCam and a expert in AI-powered product intelligence. Trained at the Max Planck Institute for the Physics of Complex Systems, he built Tara, the AI Product Analyst that not only analyzes user behavior but recommends clear next steps for better products.


Related articles

Mobile app analytics
12 Mobile App Analytics Metrics That Actually Matter in 2026
Mobile app analytics metrics are the quantitative signals product teams use to measure performance, engagement, and...
Silvanus Alt, PhD
Founder & CEO | UXCam


Mobile app analytics
Mobile App Retention Benchmarks by Industry (2026)
Mobile app retention benchmarks for 2026, broken down by industry. Day-1, day-7, day-30 retention rates for fintech, ecommerce, social, gaming, and more,...
Silvanus Alt, PhD
Founder & CEO | UXCam


Mobile app analytics
Sentry vs Datadog: Features, Pricing, and Which One Fits Your Production Stack
Sentry vs Datadog compared head-to-head on features, pricing, and the production stacks each one...
Silvanus Alt, PhD
Founder & CEO | UXCam