5 Best Mobile App Monitoring Tools for 2026

Looking to find the best mobile app monitoring tool for your app? Mobile app usage figures grow exponentially each year, and the expected number of first-time app downloads is expected to reach 200 billion in 2025. Although half the battle is won once the app is downloaded, app retention is where the hard work begins.
Lousy performance is a pet peeve for most mobile app users, causing 71% to churn within the first 90 days of downloading an app. Fortunately, app experience monitoring tools like UXCam deliver the 360-degree insights product teams need to improve their conversion and retention stats.
What are the best mobile app monitoring tools?
The top five mobile app monitoring tools for mobile app performance insights are UXCam, Dynatrace, New Relic, Headspin, and Splunk.
In this roundup, we'll look at their features, pricing, pros, and cons, so you can decide which of the best cutting-edge app performance monitoring software is best for your needs.
Top mobile application monitoring tools
| Tool | Best Use Case |
|---|---|
| UXCam | For overall mobile app UX and issue analytics |
| Dynatrace | For AI-supported application performance monitoring |
| New Relic | For full stack mobile app monitoring and observability |
| Headspin | For data science-driven mobile app monitoring and testing |
| Splunk | For a unified mobile app security and observability |
UXCam
For Overall Mobile App UX and Issue Analytics


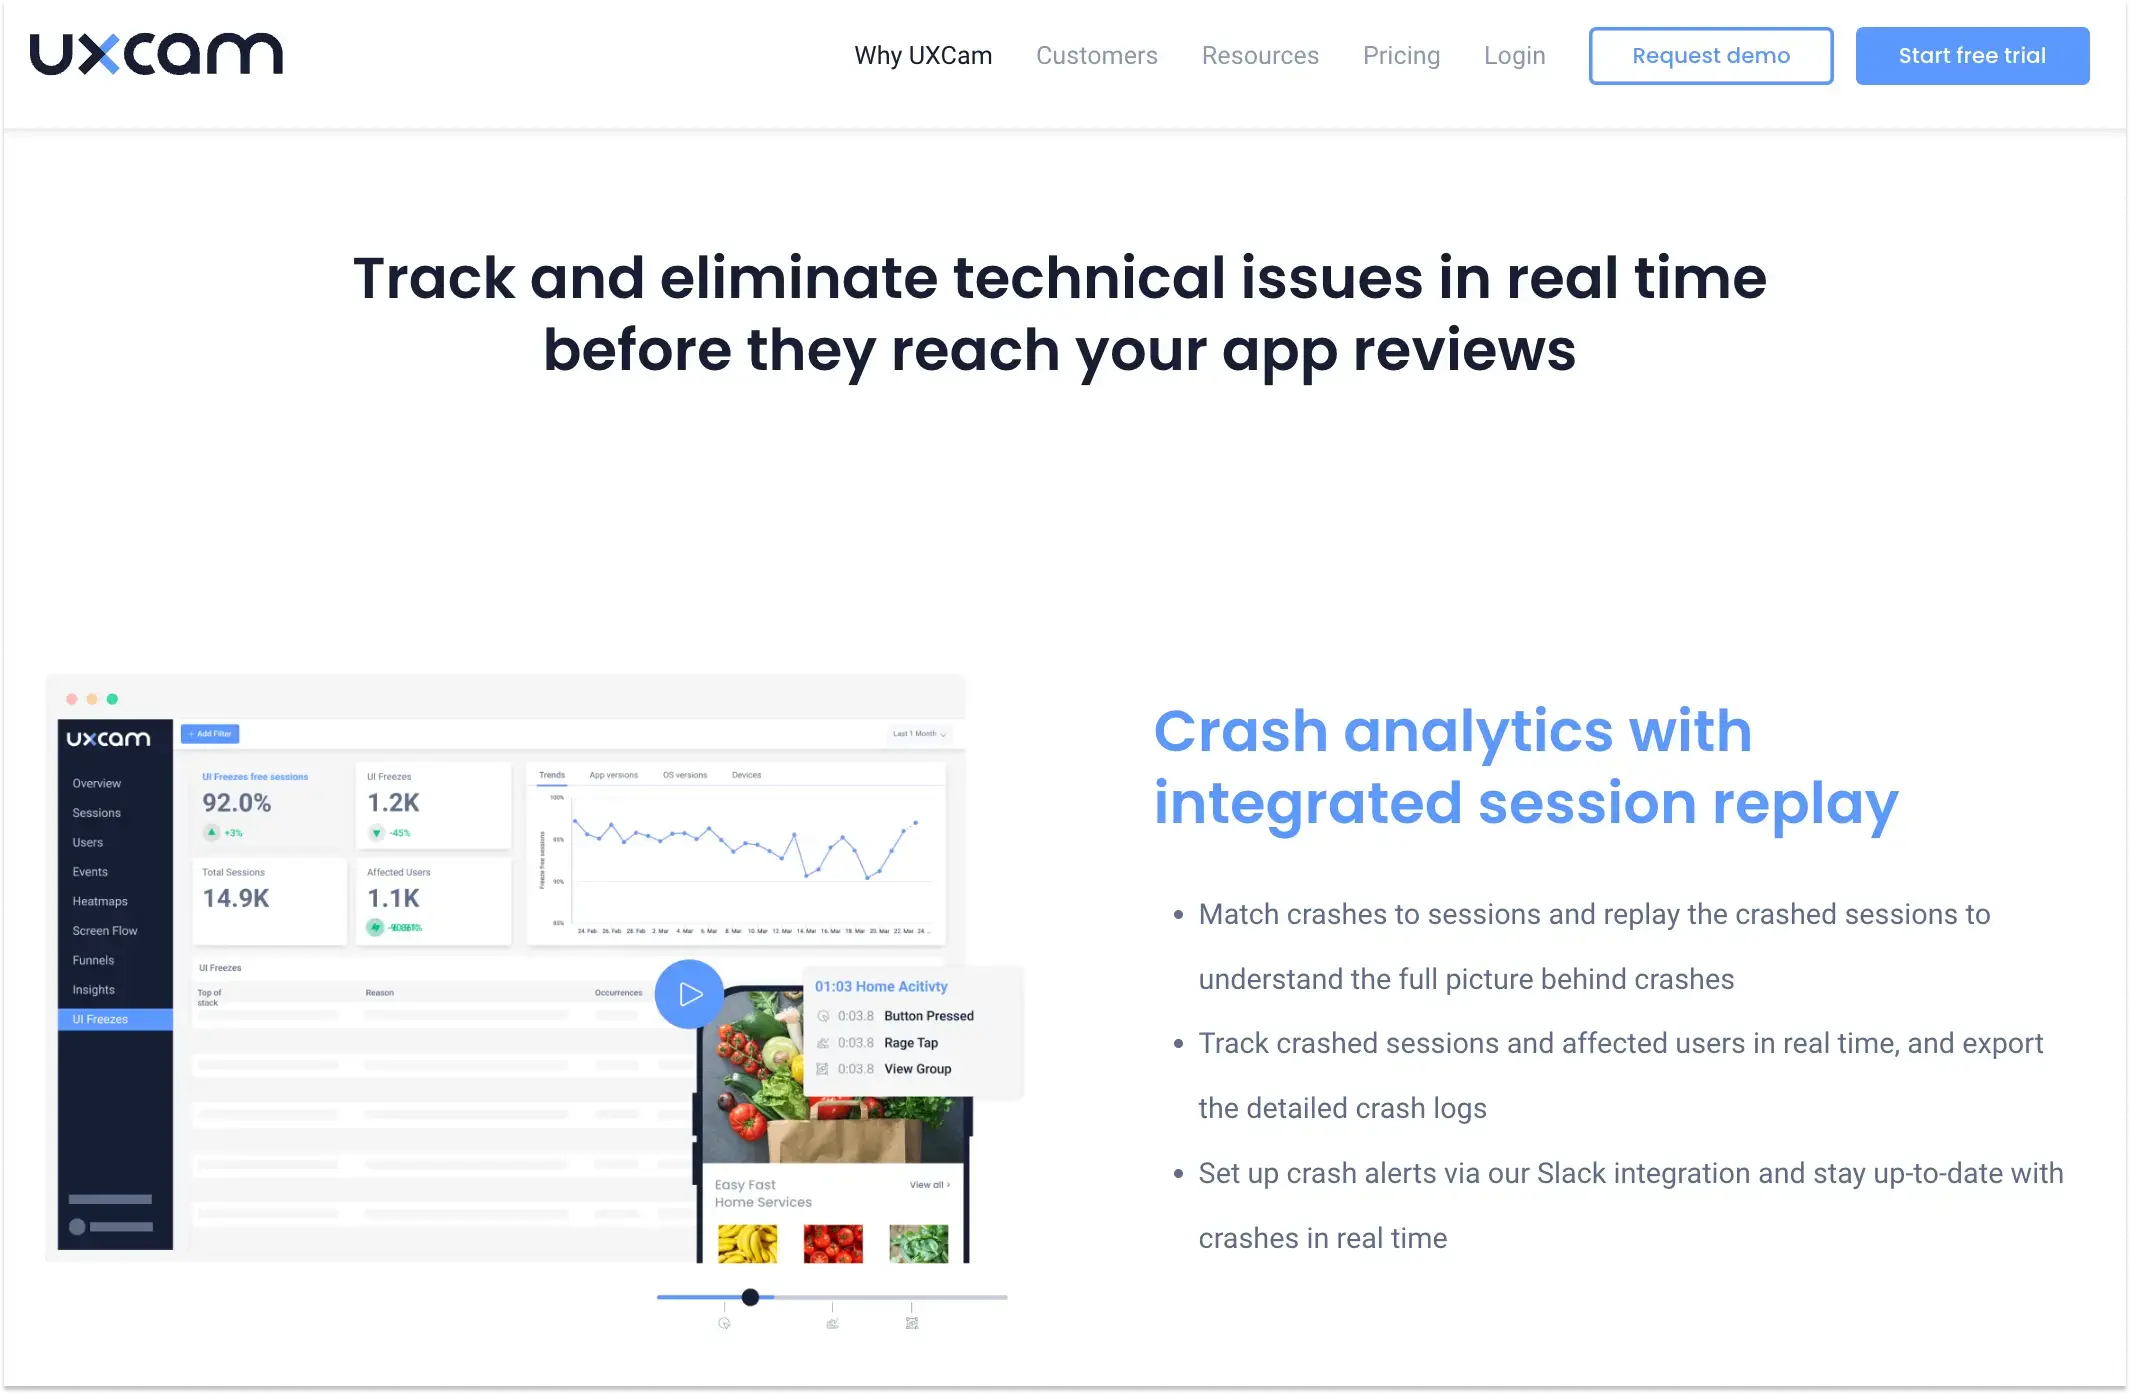
UXCam is a market leader mobile app analytics tool. It provides the features product teams want for a 360-degree understanding of the user's journeys and how they use the app.
UXCam offers the best of both worlds. The technical reports help clarify the root causes behind issues like crashes and UI freezes to help you eliminate problems before they affect app performance. In addition, you can gain deeper insight by uncovering user behavior, such as bottlenecks, frustrations, and drop-offs.
Your product teams can combine a wealth of valuable insights for fixes and developments to enhance user satisfaction.
Key Features
Lightweight SDK available for iOS, Android, React Native, Flutter, Cordova, Xamarin and Native Script
It offers easy integration with the analytic tools you use.
Easy set-up with absolutely no instrumentation or tags needed.
Session replay to understand the real reasons behind app crashes and user frustrations.
Easily export the logs for each UI freeze and replay affected sessions in video format.
Funnels and retention analytics to understand complex user conversion behaviors.
Pricing
UXCam delivers flexible pricing packages for businesses of all sizes. Schedule a demo to discuss your requirements, and they'll offer the most suitable package with pricing details.
Pros
Lightweight SDK for seamless app performance
Privacy compliant
14-day free trial
Cons
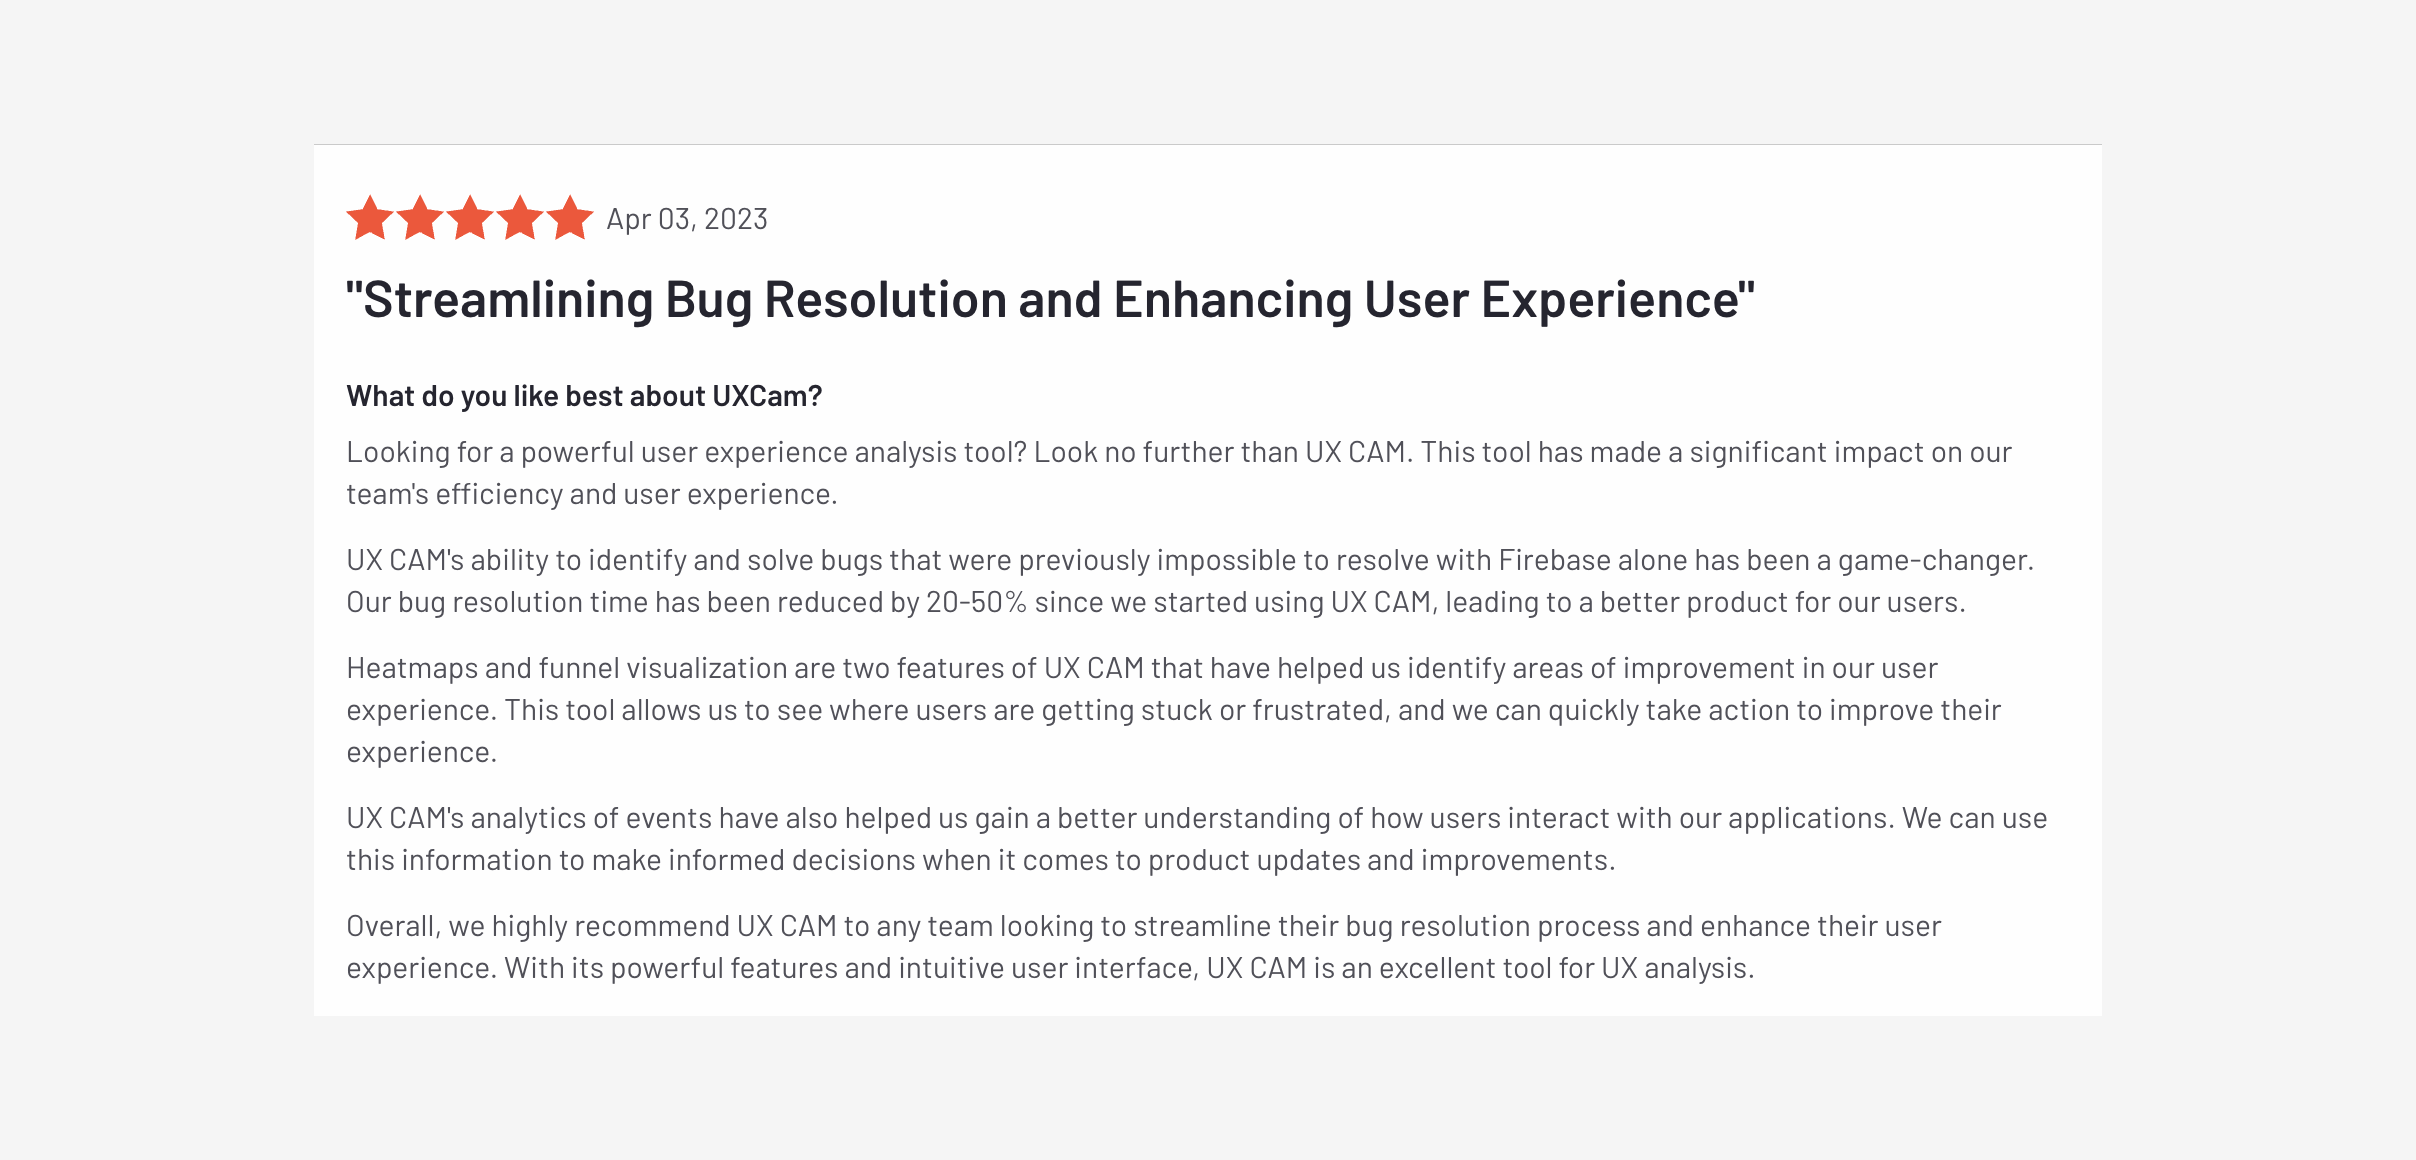
Based on recent user reviews on G2 and Capterra, here are the top two cons of UXCam;
Pricing: UXCam is priced based on the number of sessions and the cost is not available on the website. You have to book a demo to get a custom quote.
Limited integrations: Some users have mentioned that UXCam has limited integrations with other tools, which can make it difficult to use in conjunction with other analytics solutions.


Dynatrace
For AI-Supported Application Performance Monitoring


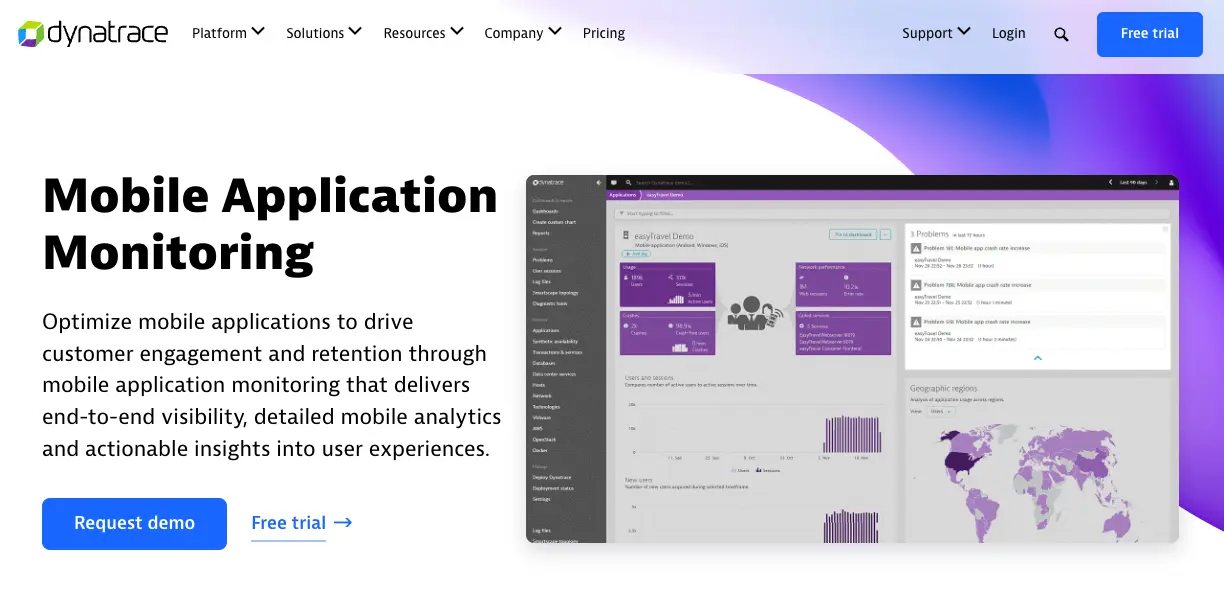
Dynatrace is an APM tool with on-premise, cloud, hybrid application and SaaS monitoring. Using AI-supported algorithms, it offers frequent predictive alerts and self-learning to resolve issues proactively. Dynatrace is ideal for more detailed technical insight into your apps' inner workings and structural conditions.
Key features
Detailed information on app crashing, including the number of users affected
Ability to automate DevOps pipelines for quicker app delivery
Support to increase conversion and ROI by understanding and leveraging customer interactions
Pricing
Dynatrace offers six pricing plans. All are billed annually and include a 15-day free plan.
Pros
Excellent AI analytics
625+ supported technologies
Extensive support center with documentation, live community, training, and more
Cons
Based on recent user reviews on G2 and Capterra, here are the top three cons of Dynatrace;
No free trial
Complexity: According to user reviews, Dynatrace hub can be quite complex to comprehend, and it has a steep learning curve
Cost: Some users on have mentioned that Dynatrace is expensive.
New Relic
For Full Stack Mobile App Monitoring and Observability


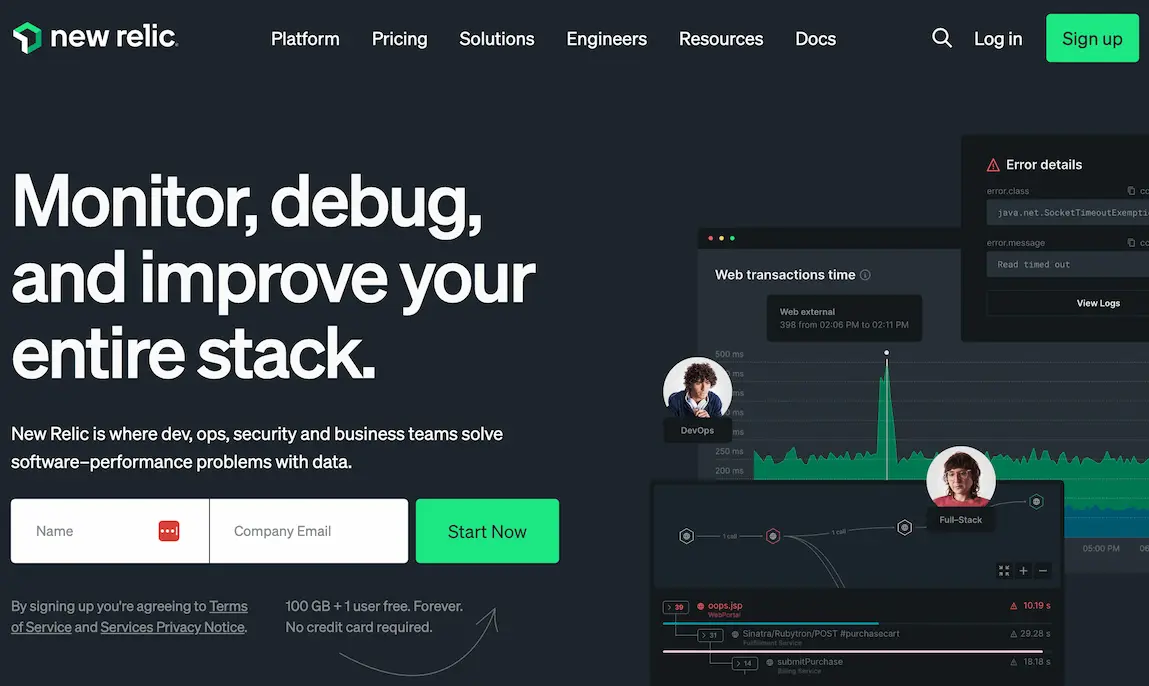
New Relic is a cloud-based network monitoring and observability platform designed to help you maintain a seamless front-end mobile app experience. New Relic can support your product teams to work better with dev, security, ops, and business teams to solve software-performance problems and achieve a perfect customer experience.
Key features
Ability to correlate data and errors to front-end problems for a better understanding
Replicate and resolve incidents with mobile breadcrumbs and event trails features
Connect code performance to business indicators for continuous KPI improvement
Pricing
New Relic operates a monthly usage pricing model. Your bill will be based on data storage and user types, and they will not charge you for feature access.
Pros
100GB free data ingest per month
Unlimited free basic users
Enterprise-level security
Cons
Based on recent reviews from G2 and Capterra, here are the top three cons of New Relic:
Poor documentation: Some users mentioned the need to improve the quality of the official documentation to deliver a better experience during usage.
Memory leaks: Users have reported that New Relic's Python agent has many memory leaks, which can lead to resource hogging.
User interface: Some users find New Relic's user interface overwhelming and confusing, especially for new users. They feel that the platform has a lot of complexity that can be difficult to navigate.
Headspin
For Data Science-Driven Mobile App Monitoring and Testing


HeadSpin is for deep knowledge of your app's performance. Product teams can stay on top of understanding the underlying issues impacting UX presented in the user data collected from device sessions.
Some of HeadSpin's standout features include automation in test and production environments to help speed up app development time. The UX and performance issues data collected, include screen recordings, CPU usage, and more to quickly resolve performance and functional issues.
Key features
Accommodates various end-to-end testing and monitoring with real devices
Automatic error detection and root cause analysis (RCA)
Hosted on infrastructure deployed in 90+ locations globally to support end-to-end testing
Pricing
The pricing information isn't available on their website. However, you can book a free trial or demo.
Pros
SOC 2 compliant testing platform
Education, training, and certification available
Collects real location and network data based on real SIM-enabled devices
Cons
Based on recent reviews from G2 and Capterra, here are the top two cons of HeadSpin:
High Pricing: While HeadSpin provides a comprehensive set of features, it comes at a cost. Some users have noted that the pricing structure can be a bit steep for small businesses or startups.
Complicated setup: Some reviewers have mentioned that the platform
presents a bit of a challenge during the initial setup phase and is confusing to for starters.
Splunk
For a Unified Mobile App Security and Observability


Splunk is a cutting-edge APM platform to support teams in building, troubleshooting, and delivering seamless mobile apps. It offers complete fidelity trace analysis for context and a thorough understanding of complicated cloud and microservice environments. Splunk intends to help product teams design secure, reliable, and compliant mobile apps.
Key features
Open Telemetry standardization for more flexibility and control in introducing new processes and technologies
AlwaysOn Profiling for code-level visibility of service bottlenecks
AI-assisted and high cardinality for rapid issue detection and resolution
Pricing
Splunk offers 4 pricing editions with an APM free edition and free trial.
Pros
Customized dashboards
Real-time insights, alerts, and updates
Engaged community with passionate Splunk experts
Cons
After a thorough analysis of user reviews on platforms like G2 and Capterra, here are the top two cons of Splunk:
Complexity: Users often find Splunk difficult to navigate, particularly during the initial setup, due to its steep learning curve.
Cost: Although users value Splunk's features, many express concerns about its high cost and desire a more flexible pricing model, especially for smaller businesses.
Mobile app monitoring - a quick refresher
What is mobile app monitoring?
Mobile app monitoring collects and analyzes large amounts of data concerning the app's performance. Performance can be affected by several components, including the:
application code
device in use
network connection
server requests
server resource usage
Mobile app monitoring assesses problems with app performance. For example, to find out how frequently your app crashes, monitoring tools track the frequency over time, making it easier to link to a root cause and find important patterns.
Why you need application performance monitoring tools
Application performance monitoring (APM) tools make monitoring the highly distributed infrastructure of today's mobile app design easier. Because components are consistently influx, APM tools monitor all critical components for accessible troubleshooting and performance management.
Here are some other benefits of an APM tool.
Understand your user’s behavior for better UX
APM tools show how users naturally interact with your mobile apps throughout their journey. With valuable insight into screen taps, average UI hangs, code and infrastructure problems, and more, you can stay on top of the app's technical performance and UX.
In a nutshell, all aspects of APM tools equate to user satisfaction improvements. Whether used to identify cost-saving opportunities, more efficient releases, or increased stability and uptime, the result is a satisfying experience that helps reduce user churn.
Troubleshoot user facing incidents faster
App defects and bugs don't need to cause an outage to let you know they're around.
APM tools speed up incident diagnosis and help find the precise root cause. With simplified problem diagnosis, product and technical teams have more time to work on other areas to support product growth.
Different types of APM tools
APM tools can be categorized into three types based on their specific function:
Application metrics-based: This type primarily collects different app and server-related metrics. The data identifies slow app URL requests. However, since they don’t profile the app's code, they can't tell the reason for slowness.
Code profiling-based: This is for code profiling and transaction tracing to help you investigate the cause of performance issues.
Network-based: This type of APM tool measures app performance by focusing on network traffic.
In some cases you might look to categorize them by the app development frameworks supported. For example;
Android app monitoring tool
iOS app monitoring tool
Flutter app monitoring tool
React native app monitoring tool
How to choose a mobile application monitoring tool
Selecting the right mobile app monitoring tool can make a substantial difference in your app's performance. But, how do you make the right choice with so many options available out there? Let's delve into the key aspects you need to consider to ensure you pick a tool that aligns with your needs.
The type of performance monitoring available
One of the main things to remember is the type of monitoring available. Many APM tools focus on measuring the following five components of app performance:
Runtime app architecture
Real user monitoring
Analytics and reporting
Component monitoring
Business transactions
Here are some important things to consider when deciding on selecting a suitable APM solution.
Reporting and analytics
Does the tool offer the metrics you need? For example, is tracking performance by specific parameters more important than code-level diagnostics? And will the insight be presented in a meaningful and easy-to-understand way?
Ease of use
If applicable, the APM tool you use should be quick and easy for anyone, e.g., product teams and stakeholders. Here are some questions you may need to ask:
Can you start using it without installing it on your servers?
Are the dashboards easy to understand, or is customization required?
And what will the maintenance be like? How often will it need to be upgraded, for example?
Programming language and technical Support
Consider the types of technologies the APM tool needs to monitor and whether your product team will need a flexible tool to support mobile development frameworks.
In addition, take a look at the support options available. Will you have access to 24/7 support? Do they have high-quality help documentation? Do they sound like they'll be 100% onboard in helping to ensure product success? For example, acting as a partner as opposed to the service provider.
Keep an eye on your app's health with UXCam
The abundance of mobile apps has made users more selective and sensitive to app quality. Fortunately, mobile app performance monitoring tools monitor app health and highlight the red flags before they cause UX problems.
Remember, the key is not just to create a great app, but to constantly refine and enhance it based on user experience and feedback.
Whether it's through session replays, heatmaps, crash reports, or funnel analysis, these tools help you to identify bottlenecks and iron out kinks to deliver a seamless user experience. Each tool has its unique strengths and potential limitations, so choose what fits your needs best.
All-rounded APM tools like UXCam combine technical with UI insights through session replay to help product teams increase ROI and decrease churn rates. Consider joining the thousands of product teams using UXCam to keep their users happy consistently.
Sign up to book a free demo or to start a free trial.
Related Articles
6 Best error monitoring software to diagnose app crashes
Best iOS crash reporting tools
Best Android crash reporting tools
Top 10 mobile app crash reporting tools
AUTHOR
Tope Longe
Product Analytics Expert
Ardent technophile exploring the world of mobile app product management at UXCam.


Related articles


Conversion Analysis
React Native Crash Reporting + Best Tools and Techniques
Learn how to improve your mobile app's stability with effective React Native crash reporting. Explore the top techniques and tools for monitoring and managing...
Tope Longe
Product Analytics Expert


Conversion Analysis
Flutter Performance Monitoring - Best Tools and Techniques
In this article, we'll introduce you to the top Flutter performance monitoring tools and demonstrate how UXCam can help you monitor your app's performance with...
Tope Longe
Product Analytics Expert


Conversion Analysis
How to measure, analyze, and reduce app churn
All the user acquisition in the world won't matter if you've got a high churn rate on your app. If you want to know why users are uninstalling or unsubscribing, tools like screen flow, heatmaps, and screen recordings can get users loving — instead of leaving your...
Tope Longe
Product Analytics Expert