Top 5 Ecommerce Funnel Metrics and How to Analyze Them


Capitalizing on the frequent mobile use to access e-commerce businesses requires a deep understanding of ecommerce funnel metrics. These metrics are pivotal in measuring, analyzing, and optimizing the customer journey.
From gauging the effectiveness of user interface designs to understanding the nuances of user engagement, these numbers indicate what works, what doesn’t, and what needs improving.
In this article, we’ll discuss five key e-commerce funnel metrics, how to calculate them, and how UXCam helps you understand the user behavior behind the numbers.
Helpful summary
Overview: This article introduces five key e-commerce funnel metrics and explains how UXCam helps you to understand the behavior behind the numbers.
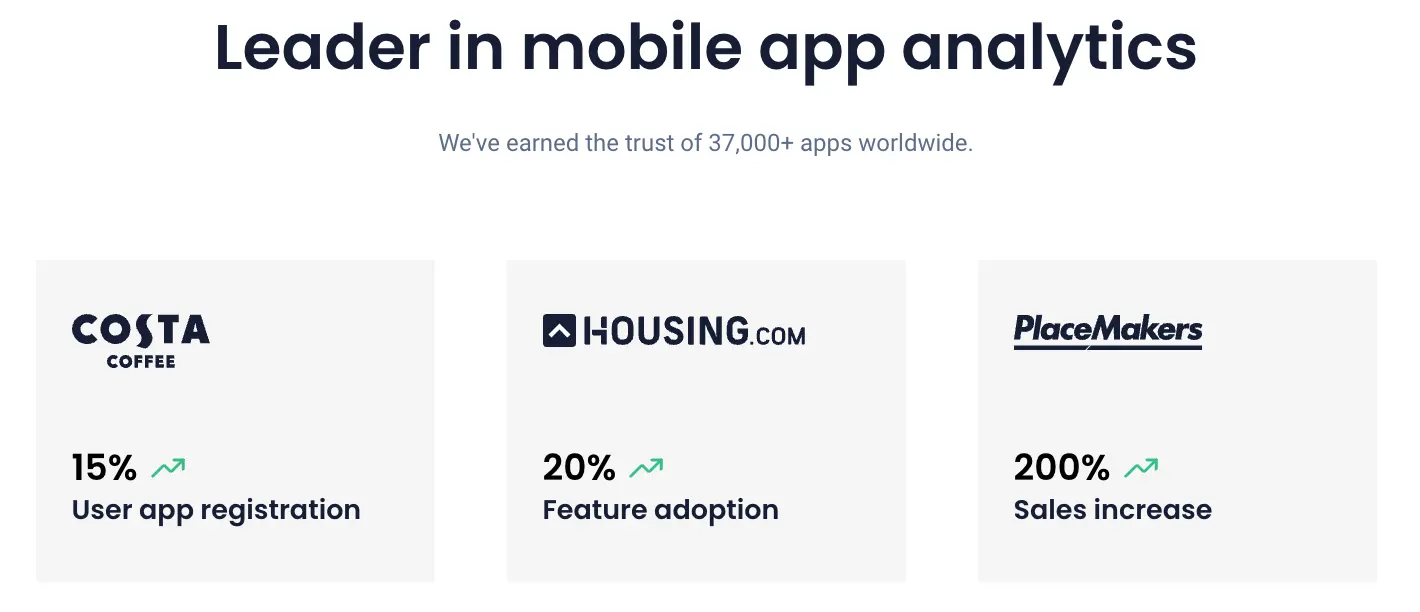
Why you can trust us: We're leaders in mobile analytics. Our deep product and behavior insights have helped over 61,000 product teams to understand and improve UX.
Why this is important: Understanding e-commerce funnel metrics helps you identify issues along the customer journey. Addressing these issues boosts conversions, satisfaction, and revenue.
Action points: Use metrics to identify patterns and trends, and use qualitative analysis tools like session replay and heatmaps to identify root causes.
Further research: Read our article on e-commerce conversion rate optimization for mobile apps for more information.
Why listen to us?
UXCam is a leading mobile analytics platform with tons of features and tools for understanding e-commerce mobile apps and users.
We’ve helped major e-commerce brands like PlaceMakers understand trends within their apps, and transform that understanding into actionable business decisions.


What are Ecommerce funnel metrics?
Ecommerce funnel metrics are KPIs that track the customer journey through a web or mobile funnel (usually, the sales funnel).
A simple example? Conversion rate.


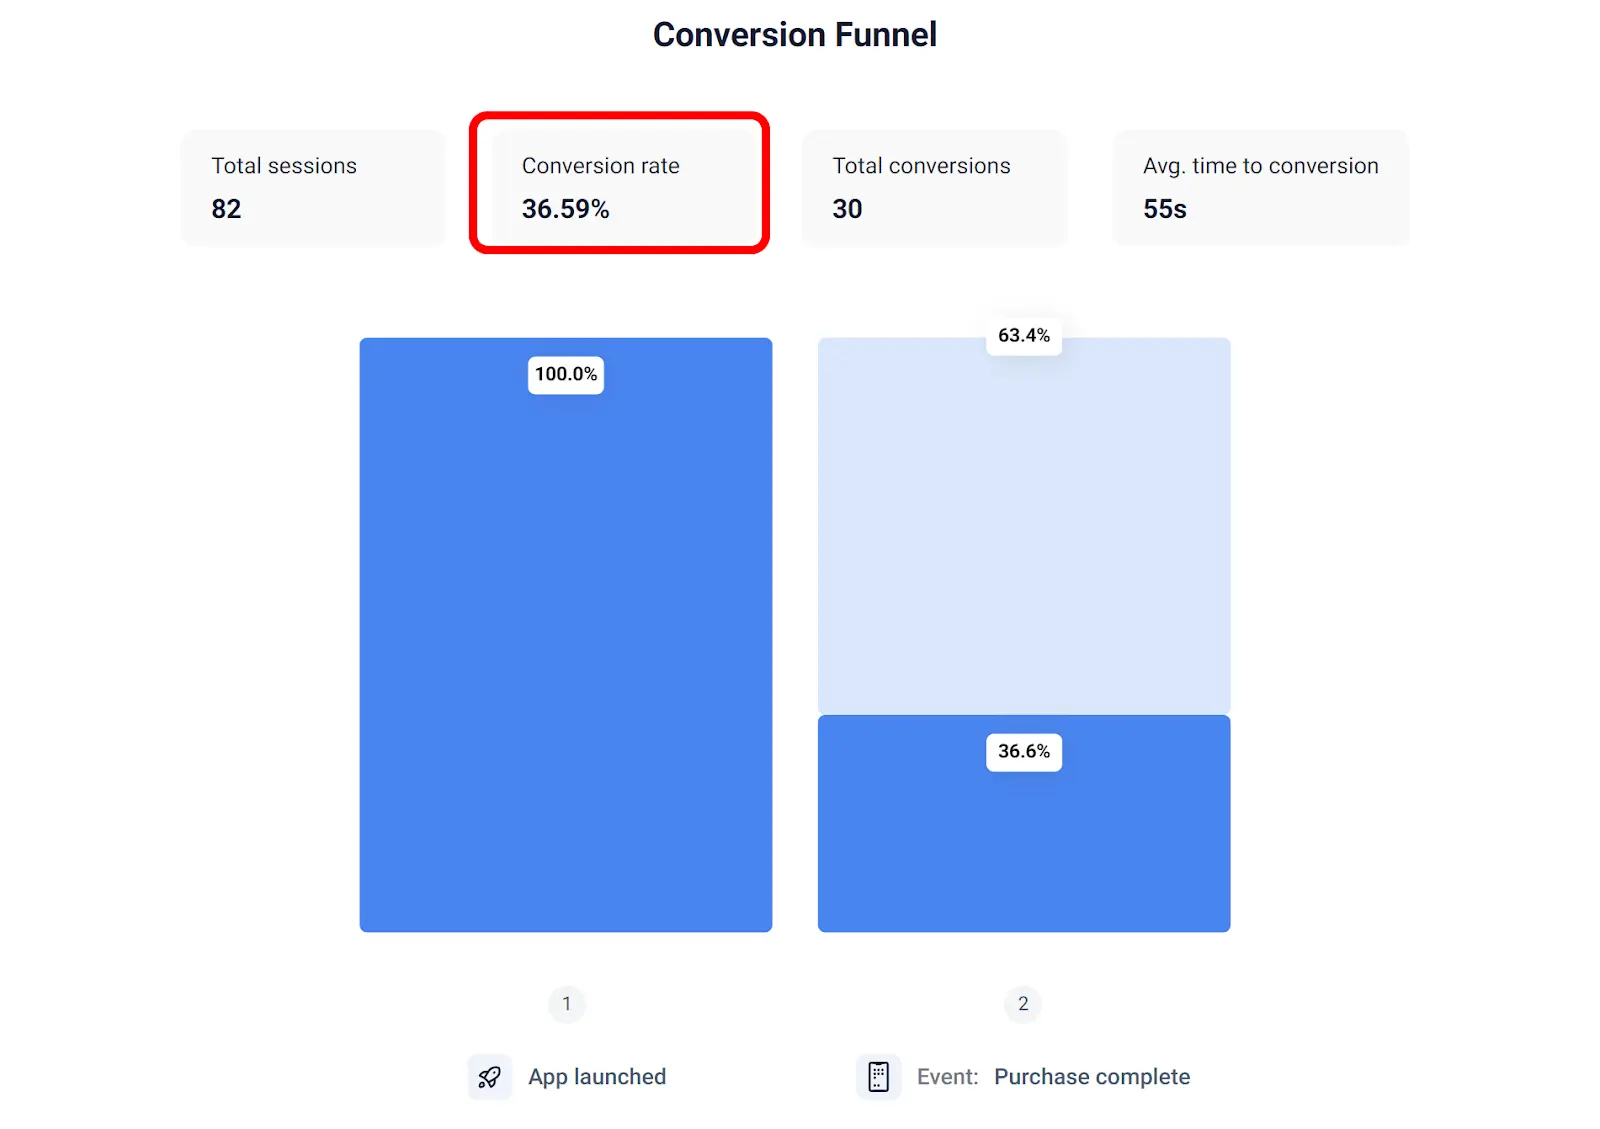
Conversion rate can tell you what percentage of your website visitors end up completing a purchase. It can also tell you what percentage of customers who complete one stage in your funnel continue on to the next. This is powerful information—if there’s a major drop-off at a certain stage, you can identify and address potential issues in your funnel.
And that’s the goal of e-commerce funnel metrics—to identify areas for improvement and optimize the customer journey, ultimately leading to increased conversions and sales.
5 key e-commerce funnel metrics for mobile apps
1. Cart abandonment rate
The cart abandonment rate measures the percentage of shoppers who add items to their shopping cart and then exit without completing the purchase. Understanding your cart abandonment rate helps identify issues with the check-out process—things like complex navigation, lack of payment options, or unexpected costs.
How to calculate:
Cart abandonment rate = ((Total number of carts created – Number of completed purchases) / Total number of carts created)) x 100
How to analyze cart abandonment rate with UXCam
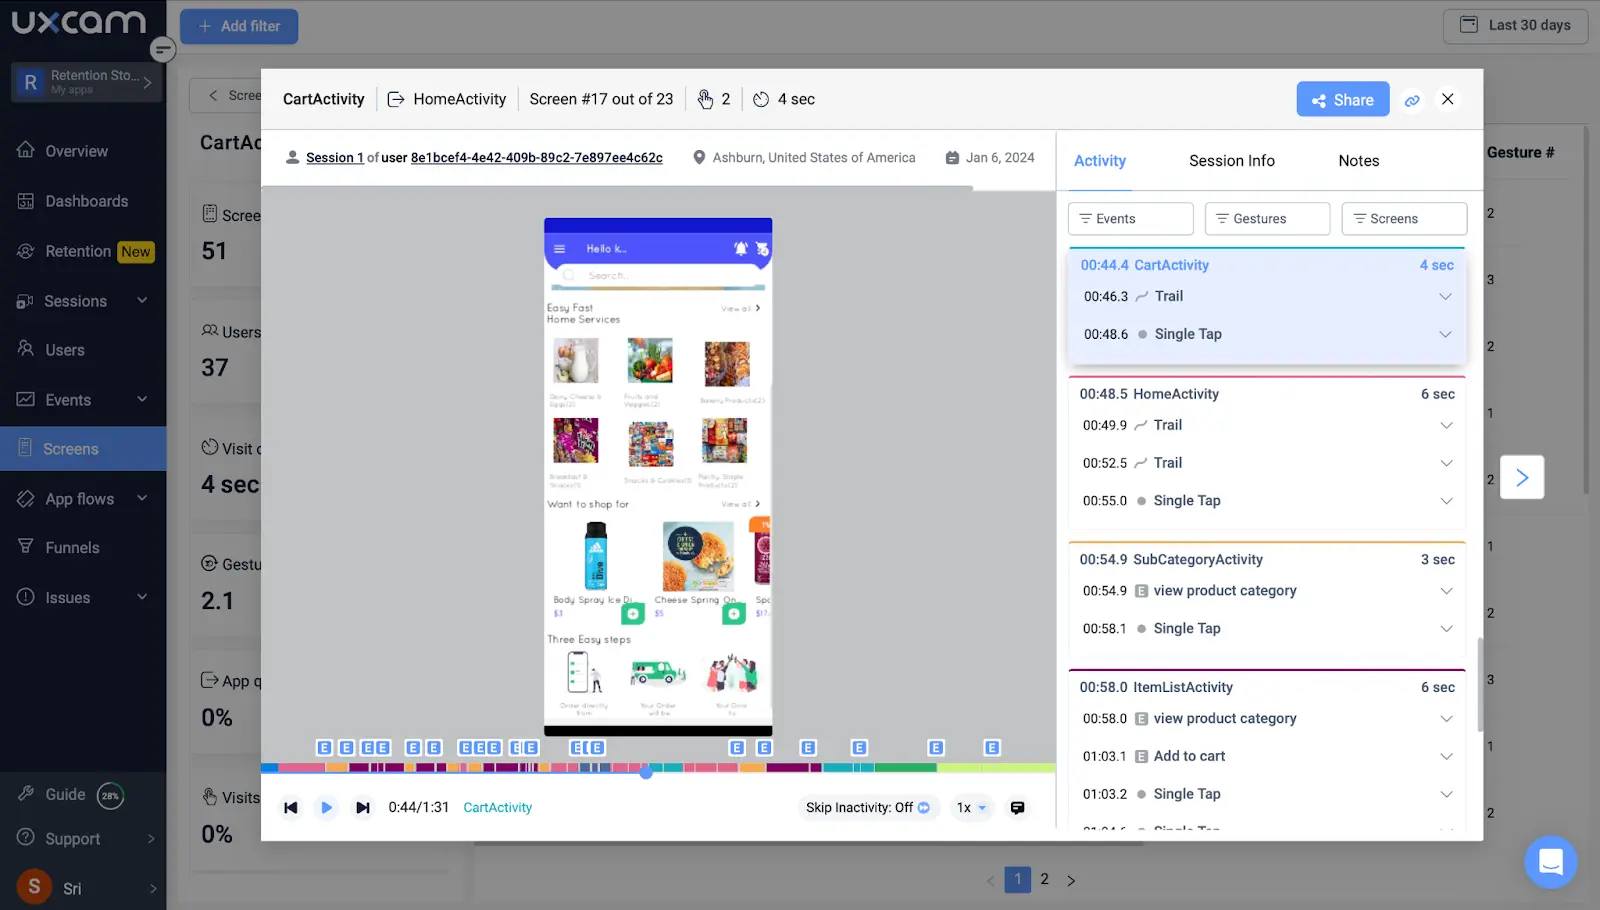
UXCam’s session replay feature records the user’s entire session within mobile app, so you can see their session experience from their perspective. Learn how users navigate your e-commerce funnel and where they commonly encounter issues leading to cart abandonment.
Using UXCam, you can access the session replays with a detailed log of activities, gestures, timings, and other information for a comprehensive understanding of the events leading up to cart abandonment.


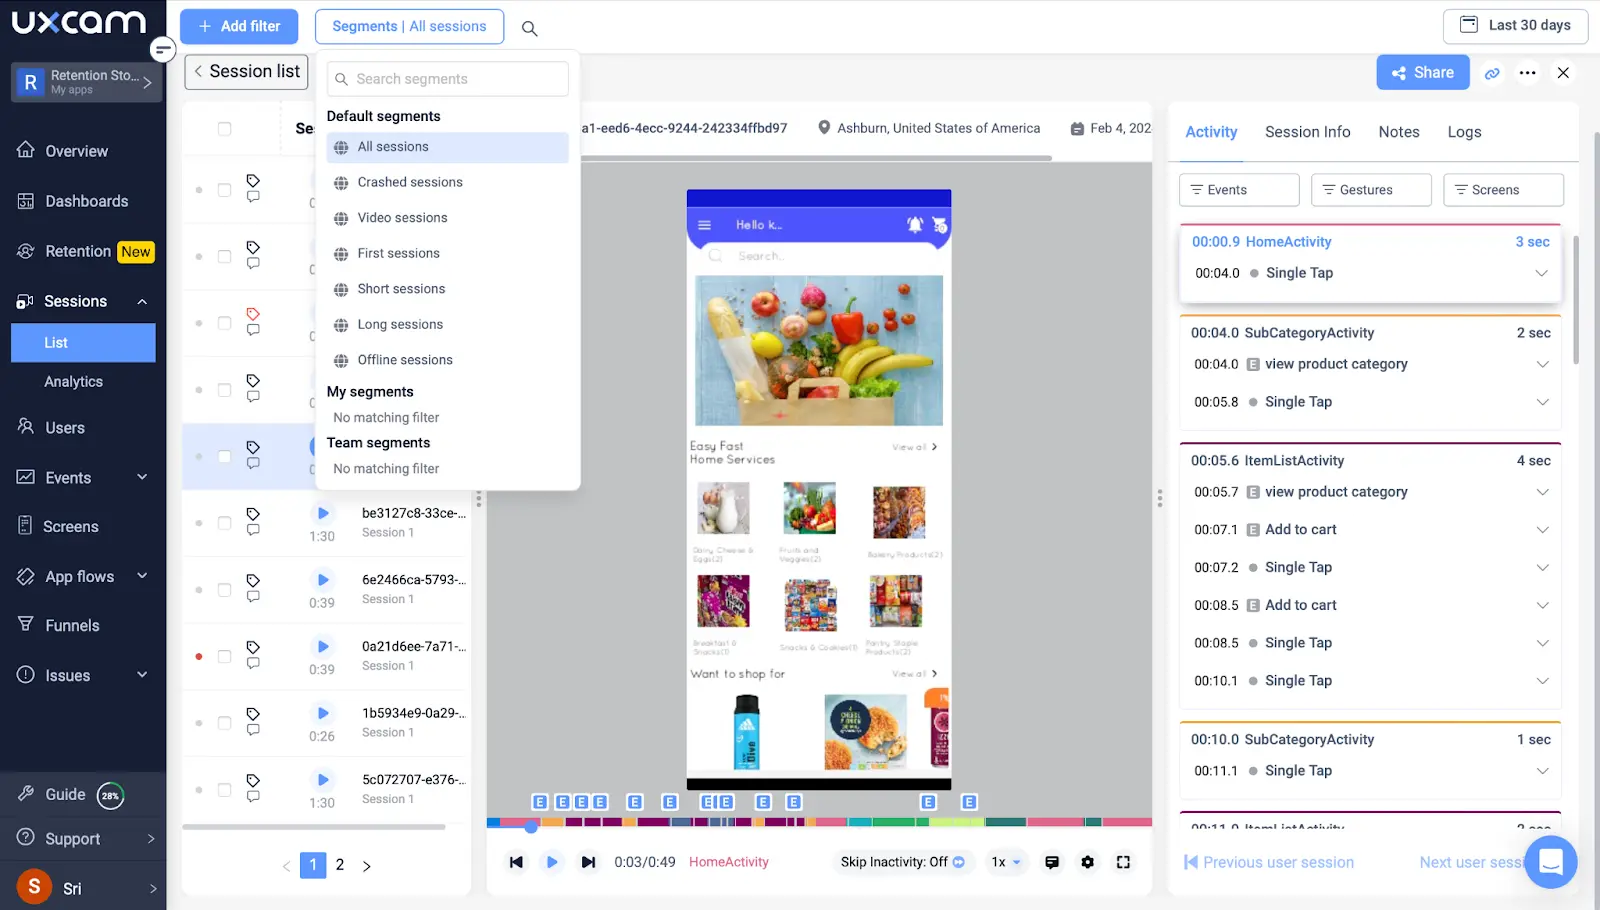
Under the “Sessions” tab, you’ll find lots of useful quick session total and average stats, including:
Rage taps
Time in app
Crashes
2. Interactions per visit
Sometimes referred to as “engagement per session,” it counts the number of user interactions during a session, like button clicks, swipes, and other gestures. By understanding the types of interactions users engage in and their frequency, you can personalize the user experience to meet individual preferences and behaviors better, leading to more conversions.
How to calculate:
Interactions per visit = (Total interactions/Total visits)
How to analyze interactions per visit with UXCam
UXCam provides heatmap data, which is a visual representation of where users tap and swipe and the elements they interact with the most and least. This data will help you optimize screen layout and design for a boost in conversions.


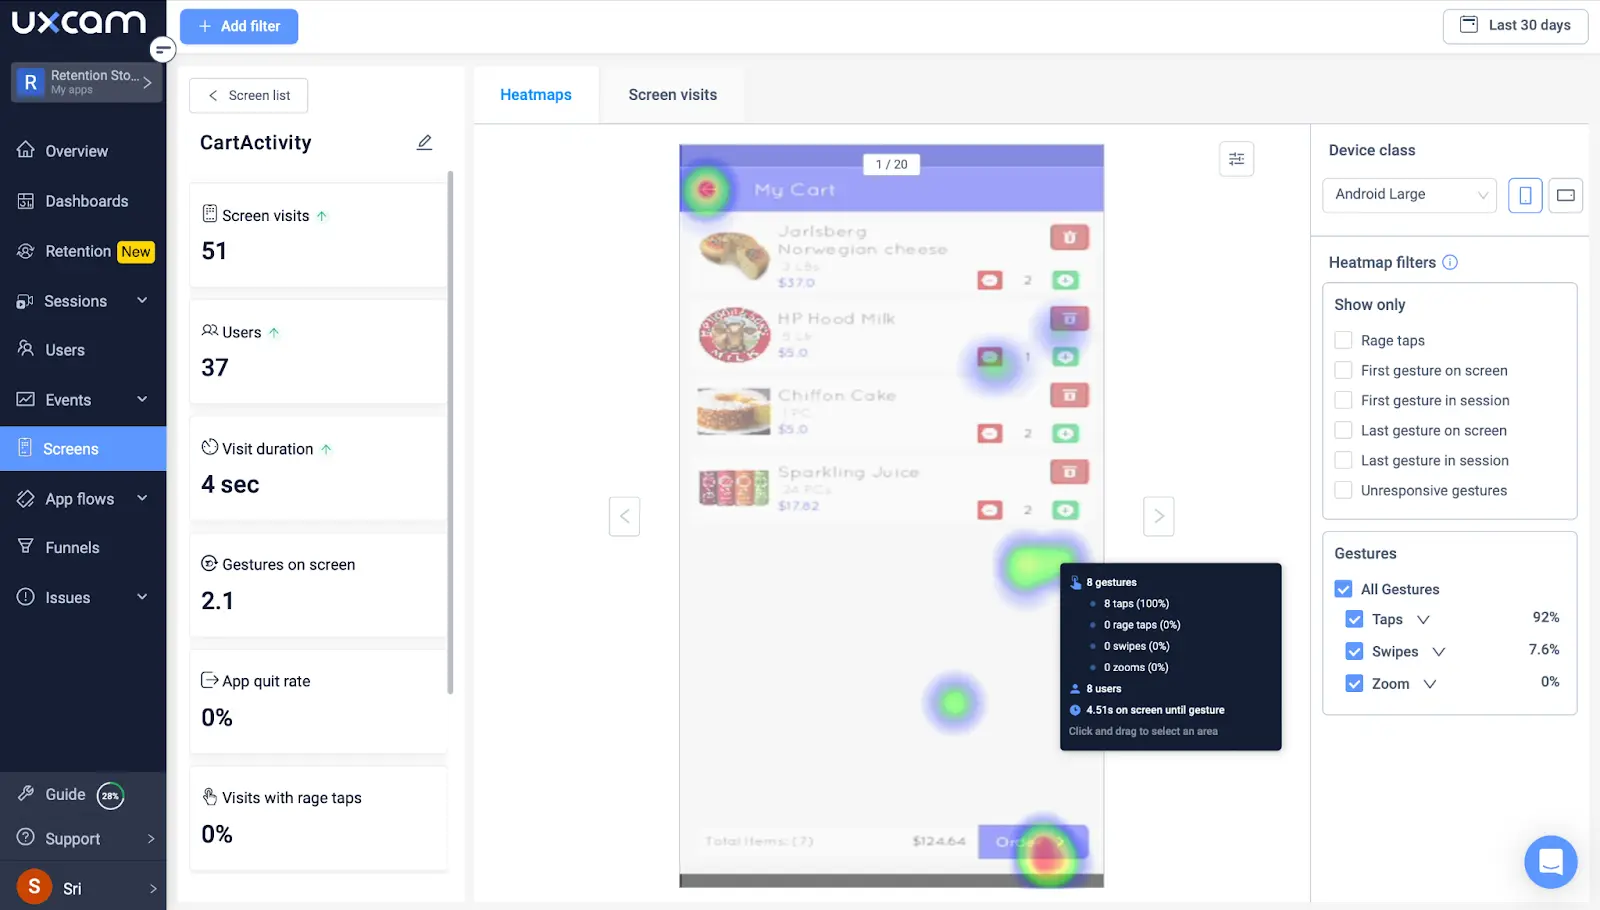
Under “Screens,” you can choose the screen you wish to see and filter your heatmap by gesture type and device. We display the gesture stats for each screen element, and you can jump to session replays for more context.


3. New vs. returning users
This metric differentiates between first-time app users and returning users, offering insight into your apps’ ability to attract and retain customers—it's vital for funnel optimization.
Knowing the ratio of new to returning users informs designs in optimizing the e-commerce funnel. For example, new users might need additional information and trust-building elements, while returning users might benefit from streamlined paths to repurchase.
How to calculate:
Percentage of new users = (Number of new users/Total number of users) x100
Percentage of returning users = (Number of returning users/Total number of users) x100
How to analyze new vs. returning users with UXCam
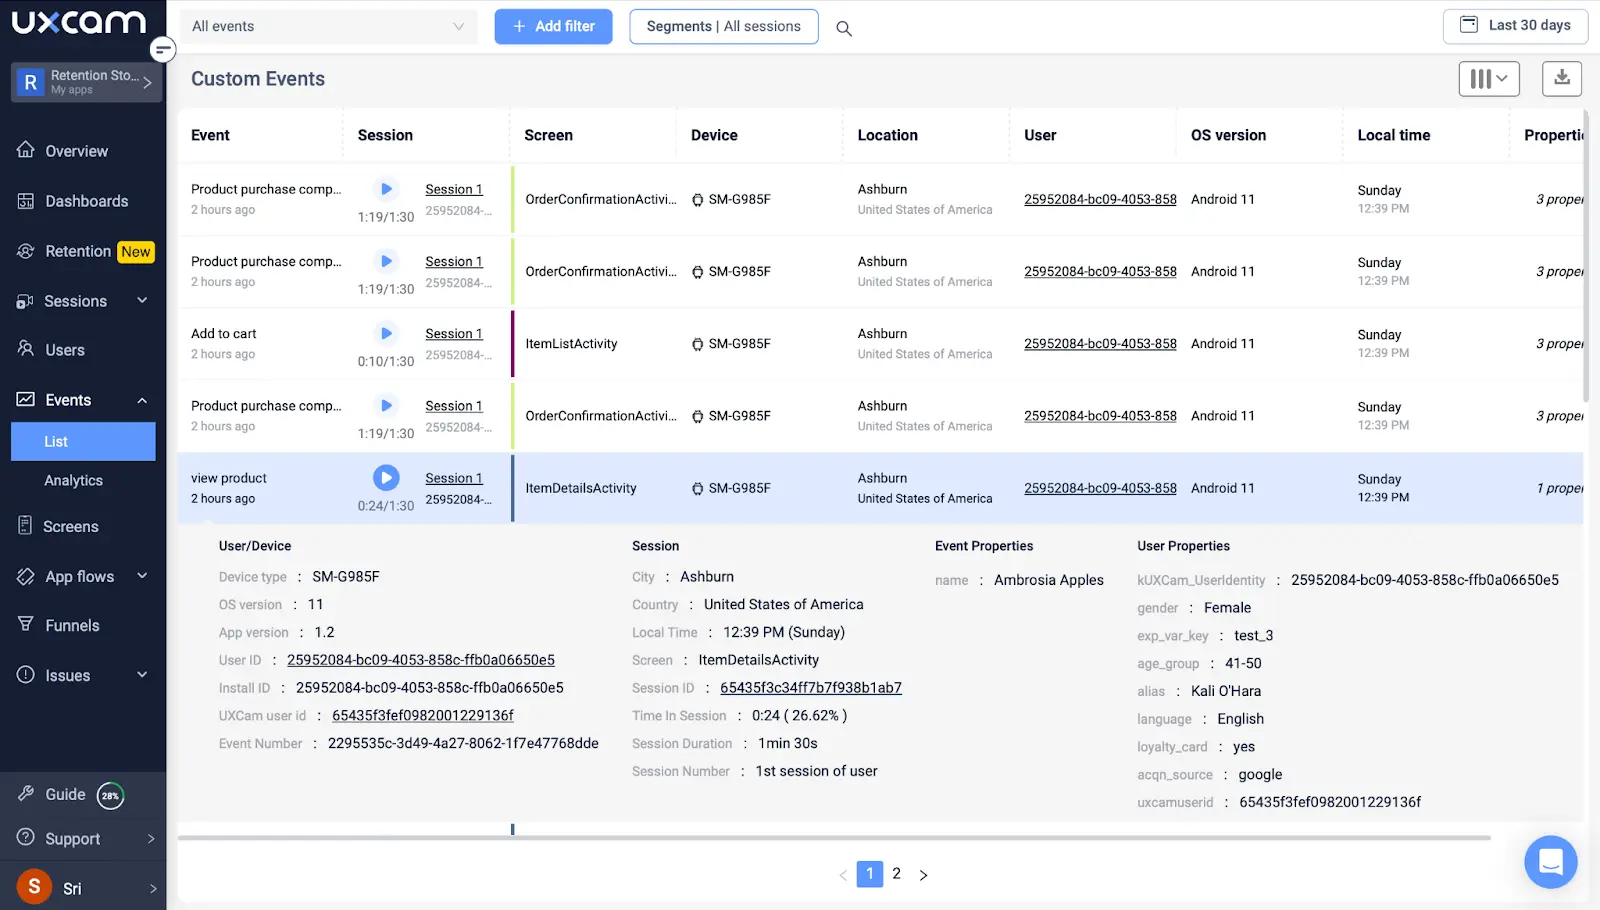
UXCam’s segmentation helps you quickly identify patterns and trends through pre-built segments. You can group users by new, returning, loyal, or slipping away users; users displaying particular frustration signals or experiencing bugs—for example. Combine session replays and heatmaps to help pinpoint conversion drivers, engagement levels, and churn reasons.


Our custom events and user properties allow you to expand analysis even further—A/B testing, for example. We’ll enhance your results with the behavior changes in different app versions.


4. Checkout flow completion rate
This measures the success rate of users completing each checkout process step without dropping off. It identifies friction points along the funnel and is critical for e-commerce because it directly correlates to how effective an app or website is at converting interested users into paying customers.
How to calculate:
Checkout flow completion rate = (Number of successful checkouts/number of checkouts initiated) x 100
The rate is expressed as a percentage, giving you the proportion of initiated checkouts that result in a completed purchase.
How to analyze checkout flow completion rate with UXCam
Our journey analysis feature visualizes screen flow by tracking the sequence of screens visited. It identifies the paths taken and where issues and bottlenecks are experienced. Heatmap data for specific problems can also be accessed from journeys.


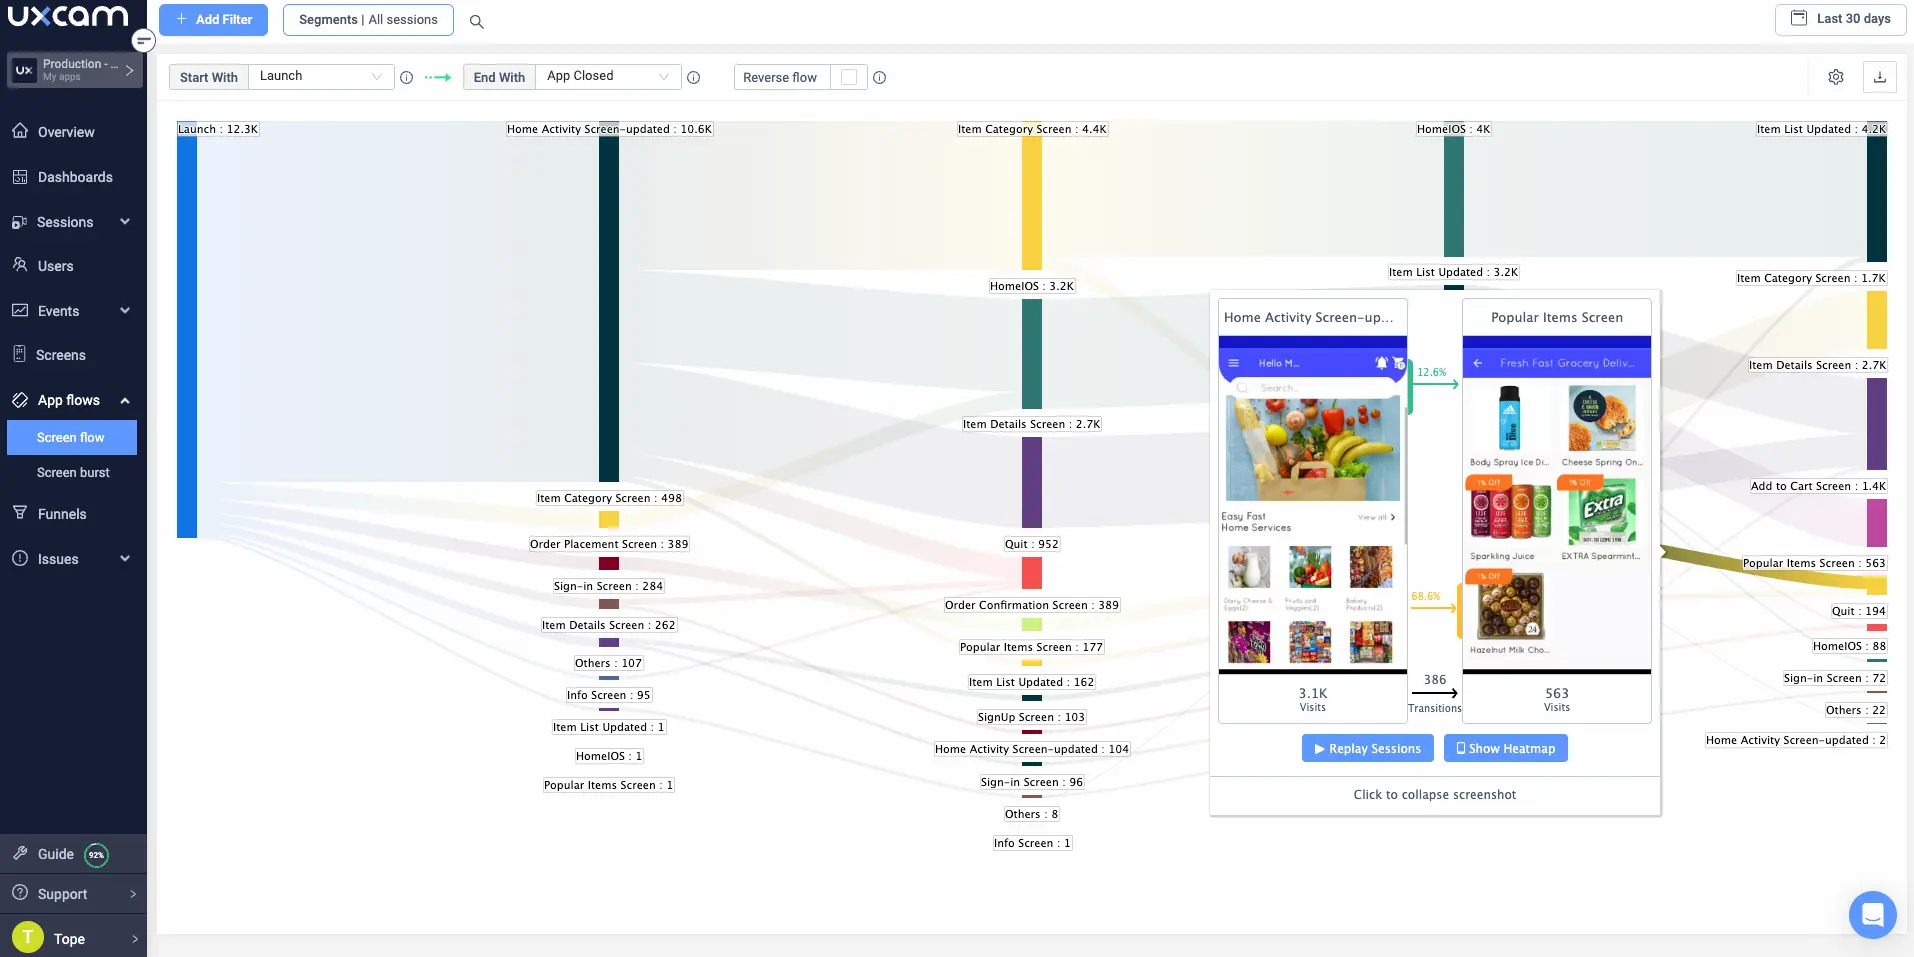
Specific journeys can be reversed to see common exit paths, which is useful for optimizing checkout processes.
5. Error rate
The error rate refers to the frequency at which users encounter errors while using the app. These errors include crashes or failed transactions, loading errors, broken links, or any other bug that impedes UX.
High error rates can frustrate users and put them off completing purchases. It can erode trust in the app and brand, leading to lower customer retention. Keeping the error rate low is essential for a smooth user journey through the e-commerce funnel, leading to better overall business performance.
How to calculate:
Error rate = (Number of sessions with errors/total number of sessions) x 100
How to analyze error rate with UXCam
Our issue analytics features help teams understand error rates by integrating session replay with crash analytics to reproduce errors. This powerful suite also includes UI freeze analytics identifying sessions and impacted users. UI Freeze details can be filtered by occurrence and OS.


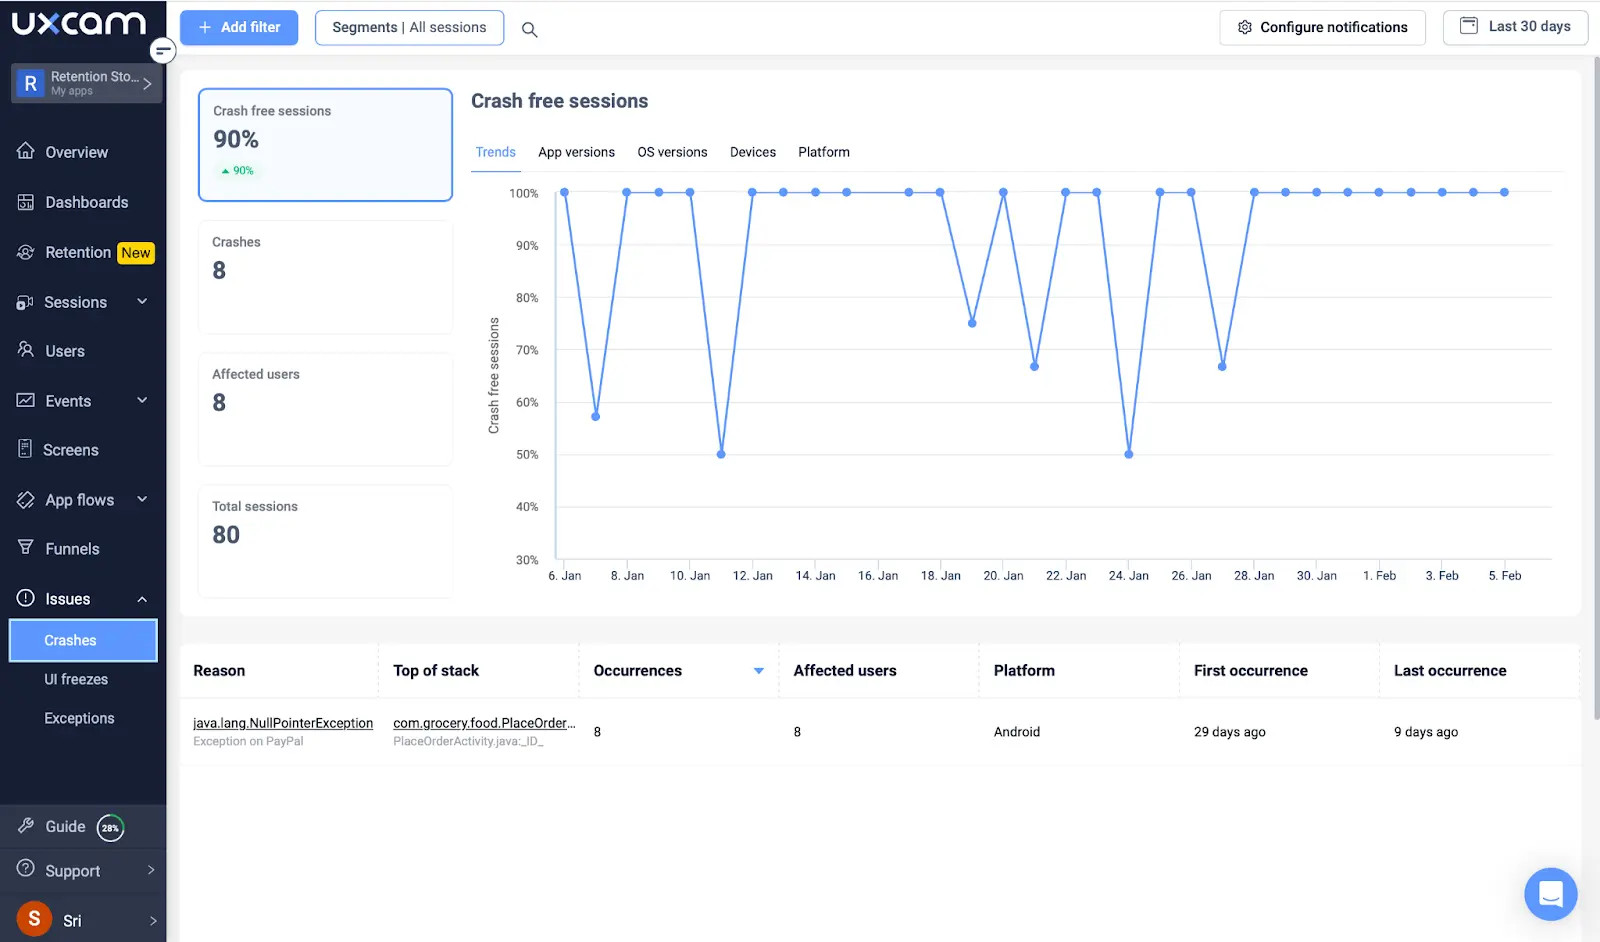
Our handled exception reporting and app logs show teams what happens in the back end when errors and performance issues occur.
Get a complete understanding of your e-commerce funnels
E-commerce funnel metrics are pivotal for mobile apps in understanding and enhancing the user journey, directly impacting conversion rates and business success. UXCam offers a comprehensive platform that bridges the gap between raw funnel analytics data and actionable insights, allowing businesses to delve into the “why” behind the results.
Join the thousands of forward-thinking mobile app brands leveraging our platform to make informed design decisions by signing up for your free account today.
You might also be interested in these;
E-commerce Customer Analytics - How to Drive Growth With Data
Ecommerce Product Management Guide for Mobile Product Teams
Top 5 Best Ecommerce Analytics Tools
AUTHOR
Tope Longe
Product Analytics Expert
Ardent technophile exploring the world of mobile app product management at UXCam.


Related articles


App Analytics
The Hotjar for mobile apps: UXCam
Hotjar doesn't support mobile apps. Learn why mobile and web analytics are fundamentally different, what changed after the Contentsquare acquisition, and the best mobile-first...


Jonas Kurzweg
Product Analytics Expert


App Analytics
Mobile App Tracking: Practical Guide and the 8 Best Tools for 2026
A practitioner's guide to mobile app tracking in 2026, covering how SDKs work, what to measure, and the 8 tools product teams actually...


Silvanus Alt, PhD
Founder & CEO | UXCam


App Analytics
Why Do My Apps Keep Crashing? A Complete Guide
Why do your apps keep crashing? A product analyst's guide to diagnosing crash causes, fixing memory leaks, and using session replay to find root...
Silvanus Alt, PhD
Founder & CEO | UXCam