5 Most Important Mobile App Retention Metrics to Measure


Mobile app retention is the key to sustainable growth.
Without strong retention, your app is a sinking ship, with users abandoning it faster than you can bring in new ones. This leads to wasted marketing spend, poor engagement, and stalled growth. To stay afloat, you need to track the right app retention metrics and uncover what keeps users coming back.
At UXCam, we help mobile product teams take a data-driven approach to development through comprehensive product analytics. In this guide, we’ll be sharing five retention metrics that every product team should be tracking to gain insights into user behavior and achieve success.
Let’s get started.
Top 5 mobile app retention metrics to track
| Metric | Description |
|---|---|
| DAU & MAU | Measures the number of users engaging with the app daily and monthly. Helps understand active user growth. |
| Stickiness rate | Calculated as (DAU/MAU) * 100. Indicates how frequently users return to the app. |
| User churn rate | The percentage of users who stop using the app within a given period. Lower churn means better retention. |
| App user retention rate | The percentage of users who return to the app after a specific time (e.g., day 7, day 30). Essential for measuring long-term engagement. |
| Session length | The average duration a user spends in the app per session. Longer sessions often indicate higher engagement. |
Daily active users (DAU) and monthly active users (MAU)
DAU and MAU represent the number of users that are active in your app on a daily and monthly basis, respectively. Tracking these metrics shows how consistently users are returning to and engaging with your app over time.
To calculate DAU:
Total New Users on [Day] + Total Returning Users on [Day] = DAU
Total Unique Sessions on [Day] = DAU
MAU / Days in [Month] = DAU
To calculate MAU:
Total Unique Sessions in [Month] = MAU
UXCam measures DAU and MAU by tracking unique app sessions.


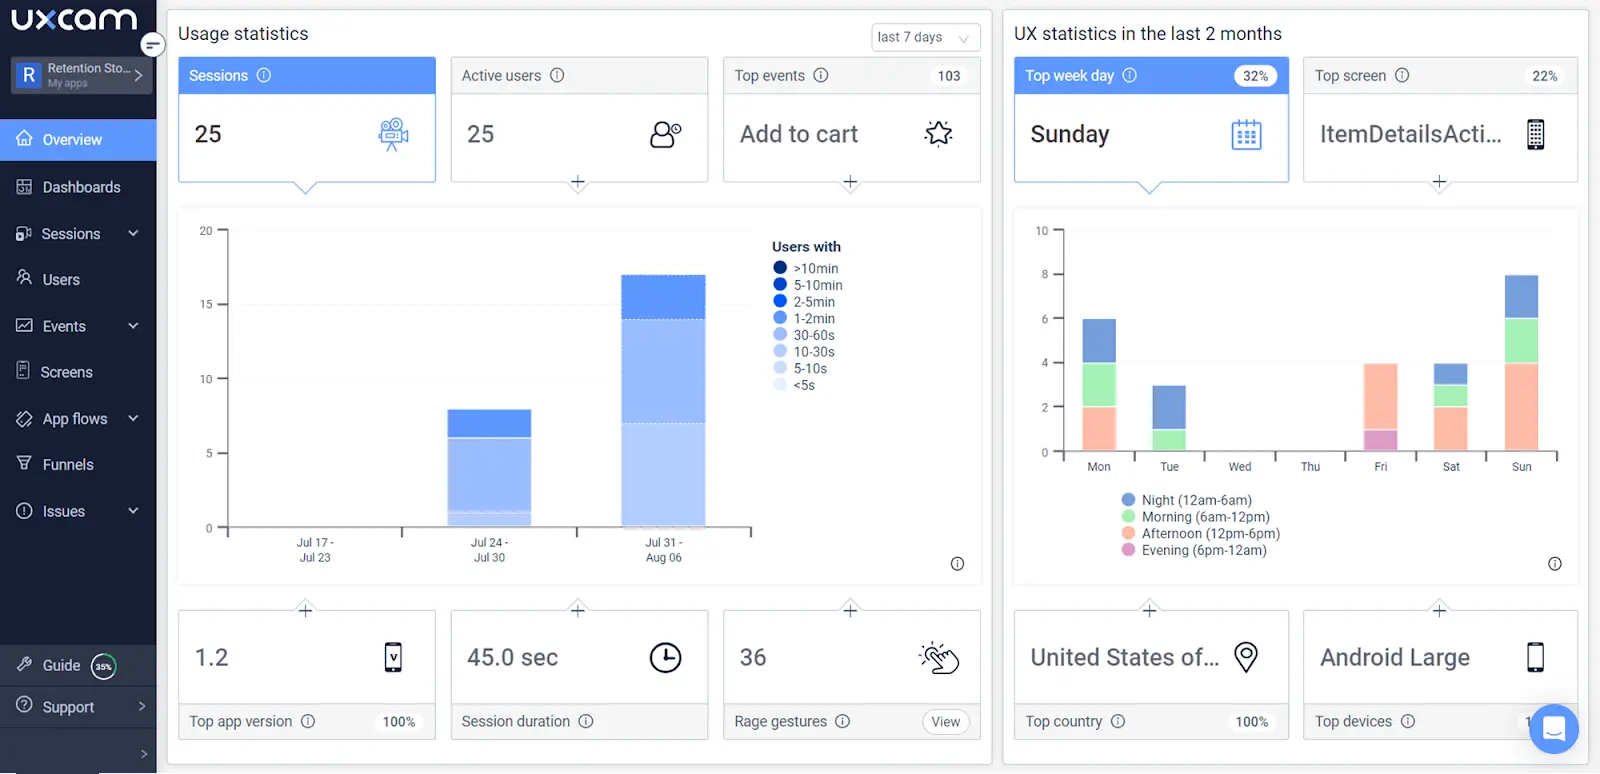
You can see DAU and MAU and their visits from your UXCam dashboard for at-a-glance insights into major app usage trends. You can also zoom in on individual user sessions through event analytics and session replays for deeper insights.
Stickiness rate
Stickiness ratio is the ratio of returning users to total users. It's a ratio that provides insights into how effective you are in keeping people coming back for more.
To calculate stickiness rate:
DAU / MAU x 100% = Stickiness Rate


User churn rate
Churn rate is the percentage of users who have stopped using your product or service over a given period. It's a good metric to help you measure the success of customer retention initiatives and keep track of user satisfaction over time.
To calculate churn rate, you need three pieces of info:
Total number of users at the start of the period.
Total number of users at the end of the period.
Total new users during the period.
Once you have this data, the formula is:
(Users at Start – (Users at End – New Users)) / Users at Start x 100% = Churn Rate


Once you’ve calculated your churn rate, it's important to analyze the results and take appropriate actions to reduce it—this is where UXCam comes in.
UXCam can track churn in real-time to offer insights that help you understand why users are leaving. With UXCam's data-driven analysis, you can pinpoint user frustrations and technical errors—and take the right steps to address them quickly.


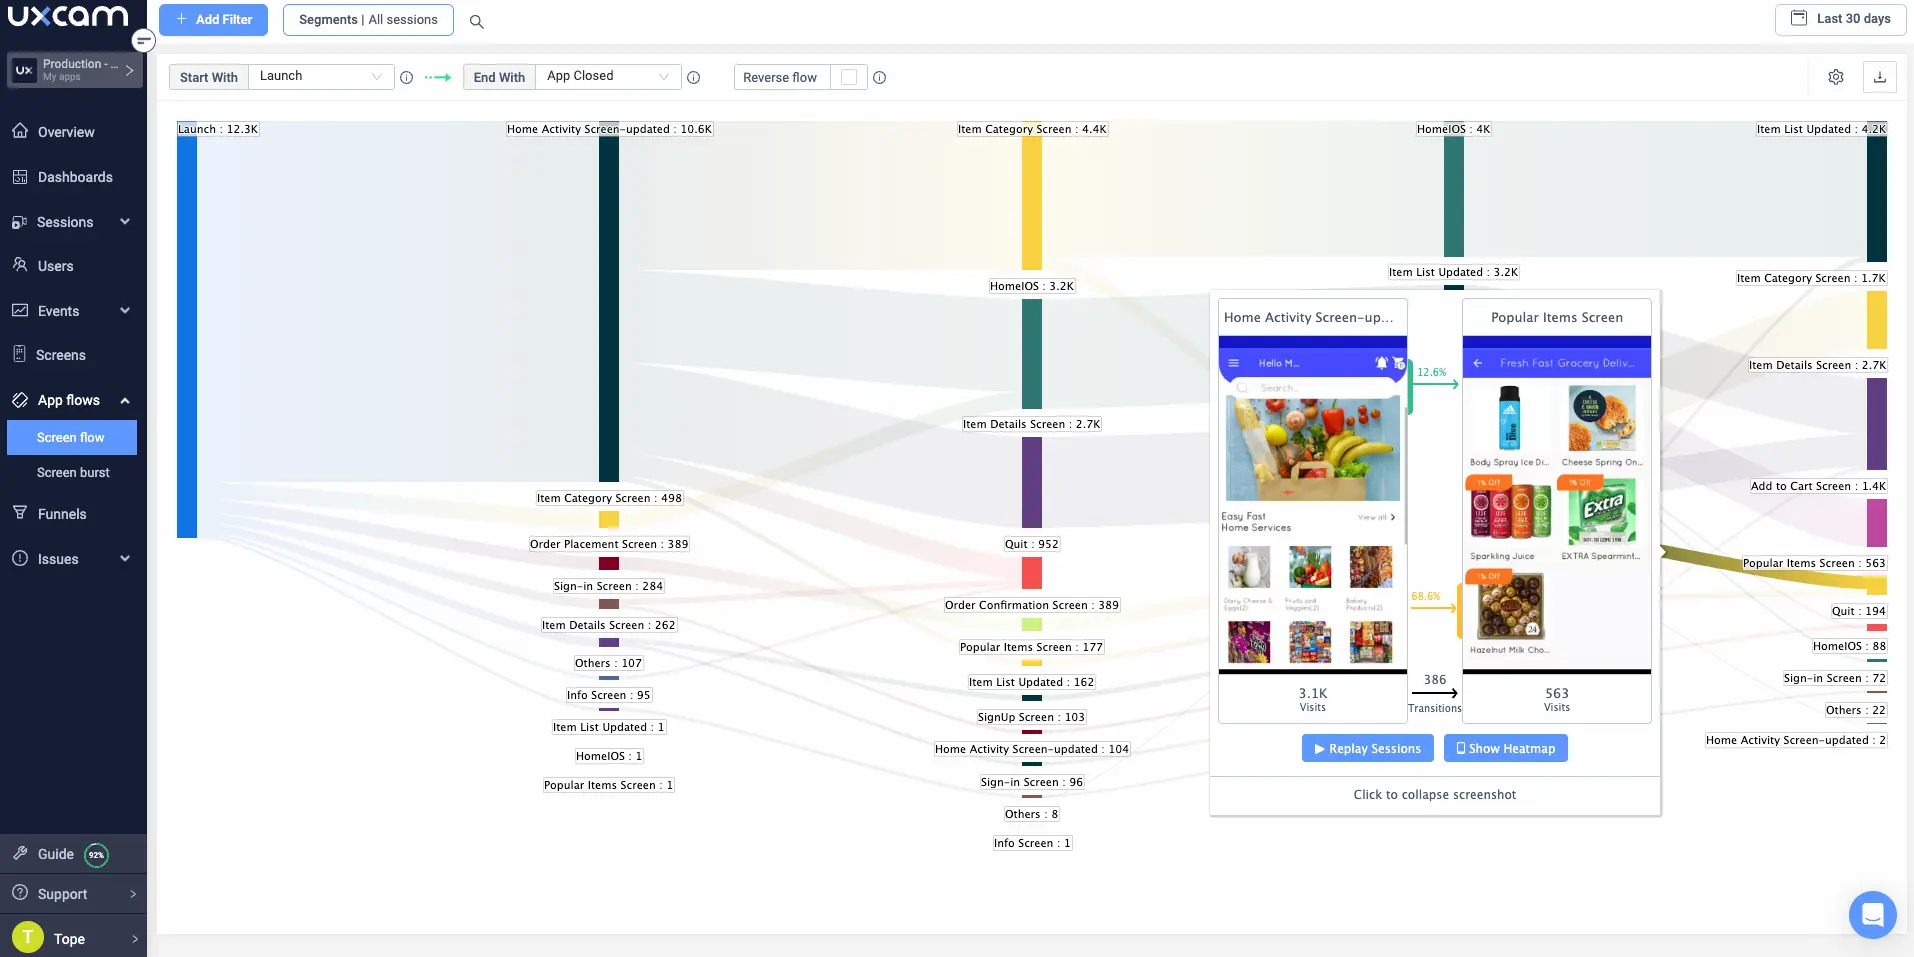
You can also view screen flows and funnels that show how users interact with your app. This data can be used to identify bottlenecks and drop-off points that might indicate where users are getting frustrated or otherwise leaving the app.
App user retention rate
User retention rate is the percentage of users that keep using your app over a given period.
To calculate user retention rate, you need the same three pieces of info as with user churn rate:
Total number of users at the start of the period.
Total number of users at the end of the period.
Total new users during the period.
The formula for retention rate is:
(Users at End – New Users) / Users at Start x 100% = Retention Rate


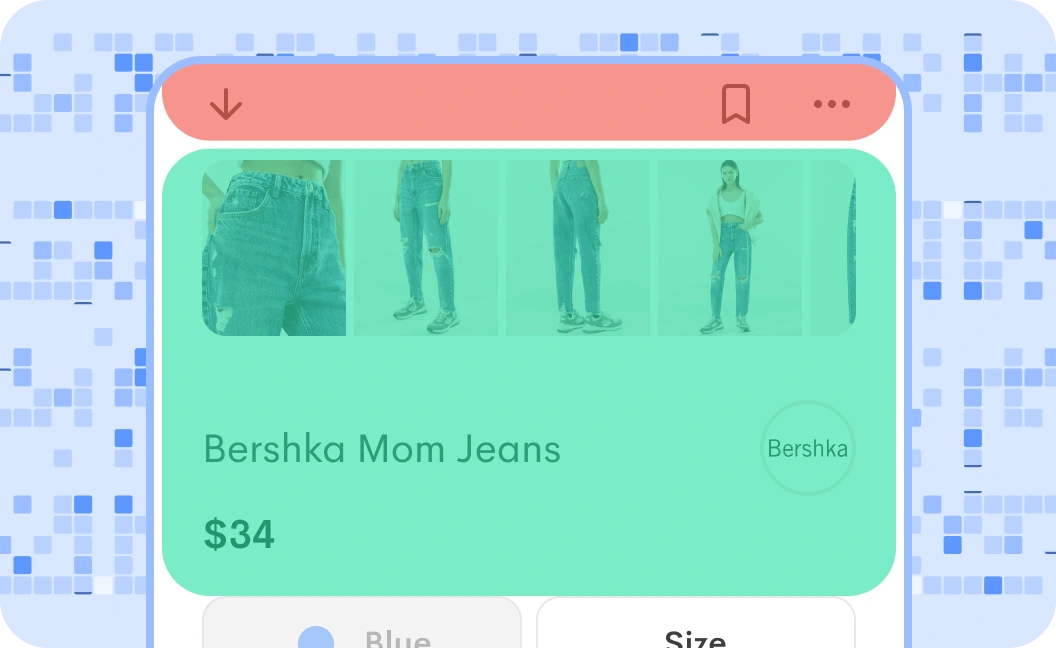
By analyzing retention rate using tools like UXCam’s retention reports, user journey mapping, and heatmaps, you can identify features that cause user drop off and what encourages users to stay. This data allows teams to focus on the right usability issues and create a more enjoyable, helpful experience for users in the long run.


By understanding user retention rate, companies can make better decisions around their product strategy and prioritize features and updates that will keep their app engaging for users over time. The goal is always to achieve an ever-increasing user retention rate.
Session length
Session length is (surprise, surprise) the average length of a user’s single session in your app. A longer session length is generally considered a positive metric that shows the user was engaged with the product. To increase session length, you need to make sure users aren’t getting bored or confused and can access the features they need quickly.
UXCam can be used to track session length—and compare session lengths across app versions, segments, and more.


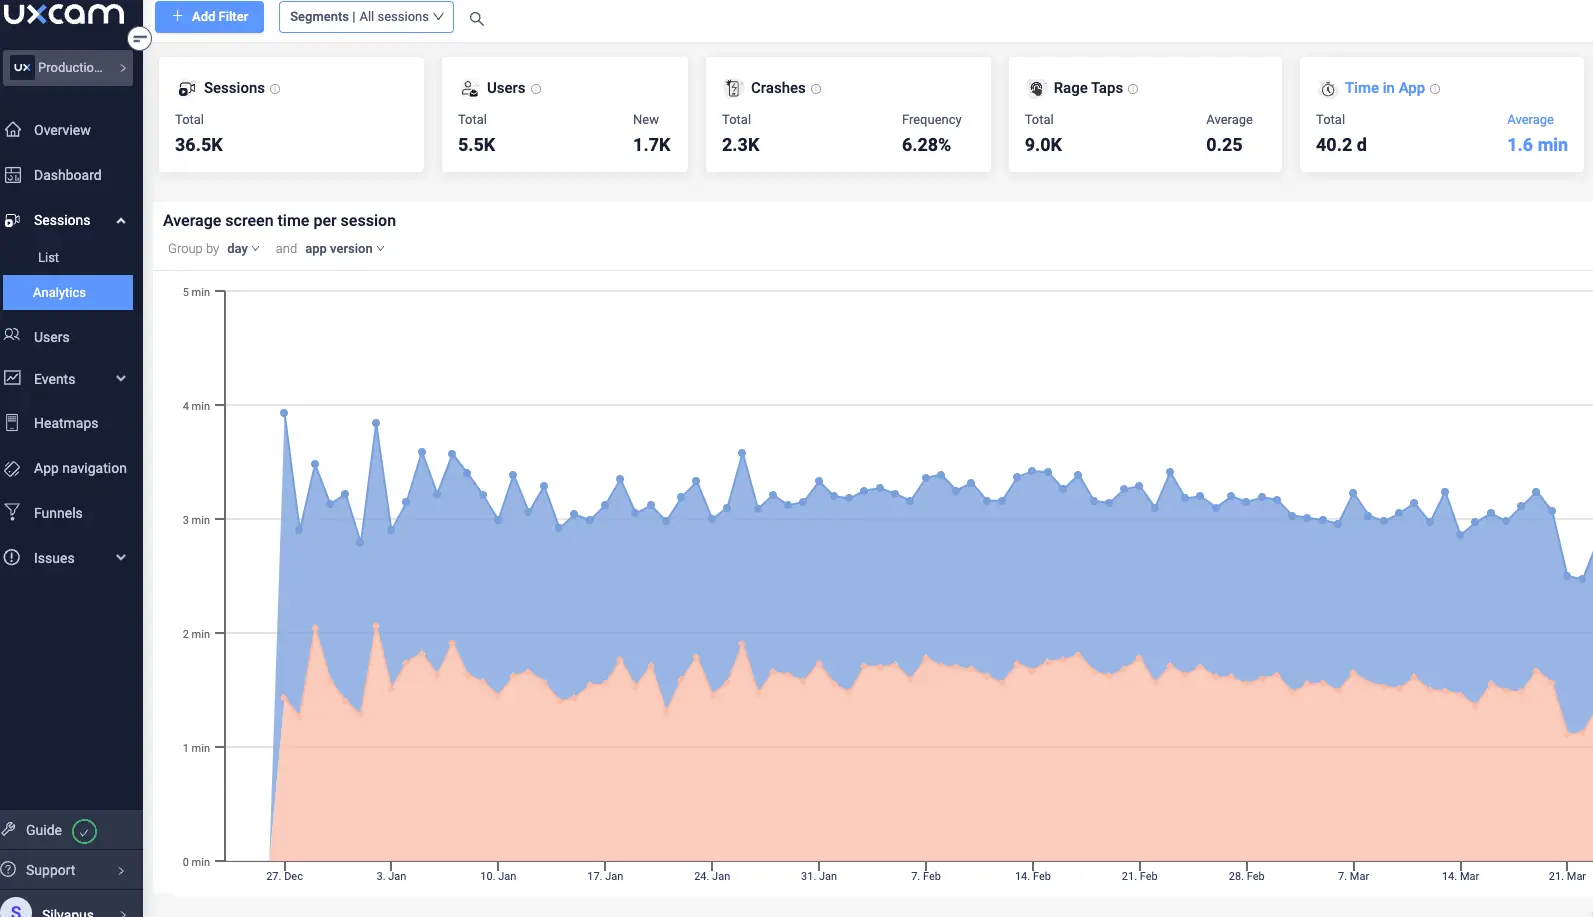
These side-by-side comparisons make it much easier to zero in on the whys behind user behavior and to test strategies for increasing session length.
Mobile app retention - a quick recap
What is mobile app retention?
Mobile app retention refers to the ability of a mobile application to engage its users over time. It's a measure of user loyalty and how frequently users return to use the app.
Highly engaged users tend to be more valuable in terms of revenue, so it’s important to understand how you can keep them around longer. By tracking key retention metrics, you can gain insights into which features are resonating with your audience and which ones need improvement.
At UXCam, we help product teams track retention through dedicated retention reports.
You can build customizable reports that show you just how engaged users are with your product as a whole, with individual features, or with specific app flows. You can also add retention rates to dashboards for easy tracking and analysis.
Importance of mobile app retention
Sustained revenue growth
Retained users are more likely to make in-app purchases or subscribe to services, guaranteeing sustained revenue growth. A study revealed that users who return to the app after being retargeted generate 37% more revenue compared to new users.
Cost-effectiveness
Retaining a user is cheaper than acquiring a new one. Data reveals that in North America, the average cost of acquiring a new app installation was $5.28, while the average cost of obtaining an in-app purchase from a user was $75.
User engagement
High retention rates indicate strong user engagement and satisfaction. However, a cross-industry study of 37,000 apps revealed that only about 42% of users remained active one month after downloading the app, with approximately 58% of users discontinuing its usage.
By the third month, the retention rate declined to around 27%, while the churn rate increased to approximately 73%. These findings highlight the challenge of maintaining user engagement and loyalty beyond the initial download and usage period.
Brand loyalty
Users who consistently use an app are more likely to become loyal brand advocates. When customers have a positive experience and find value in a brand's products or services, they're more inclined to continue purchasing from that brand. This not only generates revenue, but also helps establish a solid customer base.
Additionally, a study revealed that an astounding 86% of loyal customers are more likely to recommend the brand to their friends, family, and colleagues.
Market competitiveness
Apps with higher retention rates can stand out in a competitive market. For instance, news apps boast significantly higher retention rates compared to other categories. Despite not being as popular in terms of total downloads, users are more intentional when downloading news apps. In 2022, the 30-day retention rate for news apps exceeded 11% by app category.
Conclusion
Mobile app retention metrics are important for measuring the success and growth of your app. They help you understand how users interact with your app, what features they value, and how loyal they are.
At UXCam, we arm mobile product teams with a suite of analytics tools they can use to unpack the whys behind retention and churn metrics. Our intuitive platform helps teams get to the heart of user behavior so they can make more informed decisions about how to improve their mobile app and stay ahead of the competition.
Sign up for free today and start improving your mobile app retention metrics with UXCam.
You might also be interested in these;
Mobile app retention benchmarks by industries
6 Best customer retention software and tools for growth
Funnel analysis examples: How to improve app conversions
AUTHOR
Tope Longe
Product Analytics Expert
Ardent technophile exploring the world of mobile app product management at UXCam.


Related articles

Mobile app analytics
12 Mobile App Analytics Metrics That Actually Matter in 2026
Mobile app analytics metrics are the quantitative signals product teams use to measure performance, engagement, and...


Silvanus Alt, PhD
Founder & CEO | UXCam


Mobile app analytics
Mobile App Retention Benchmarks by Industry (2026)
Mobile app retention benchmarks for 2026, broken down by industry. Day-1, day-7, day-30 retention rates for fintech, ecommerce, social, gaming, and more,...
Silvanus Alt, PhD
Founder & CEO | UXCam


Mobile app analytics
Sentry vs Datadog: Features, Pricing, and Which One Fits Your Production Stack
Sentry vs Datadog compared head-to-head on features, pricing, and the production stacks each one...
Silvanus Alt, PhD
Founder & CEO | UXCam