Product Analytics Dashboard Examples (+ How To Use Them)


When you start getting serious about product analytics, you realize just how many valuable metrics, segments, and correlations there are to keep tabs on.
Staying organized is tough—but product analytics dashboards make it a ton easier.
In this guide, we’ll be giving you an overview of when product analytics dashboards actually are before doing a deep dive into a ton of example cases using some of the customizable dashboards that you can build in UXCam. By the end, you’ll have a pretty good idea of how to start taking advantage of this useful tool.
Ready? Let’s get to it.
What Is a product analytics dashboard?
User interactions with your product generates tons of data—taps, swipes, conversions, bounces, referrals, clicks… you get the idea.
A product analytics dashboard allows you to easily take all of this data (or at least most) and translates it into easy-to-understand graphs, tables, charts, and stats. This is super helpful for data-driven product teams—it allows them to answer important questions, like:
“Why are people dropping off my onboarding flow?”
“How often are users interacting with feature X?”
“Which features are driving the most conversions?”
Armed with these insights, it's much easier to make impactful product improvements.
Product analytics dashboard examples and guide
UXCam
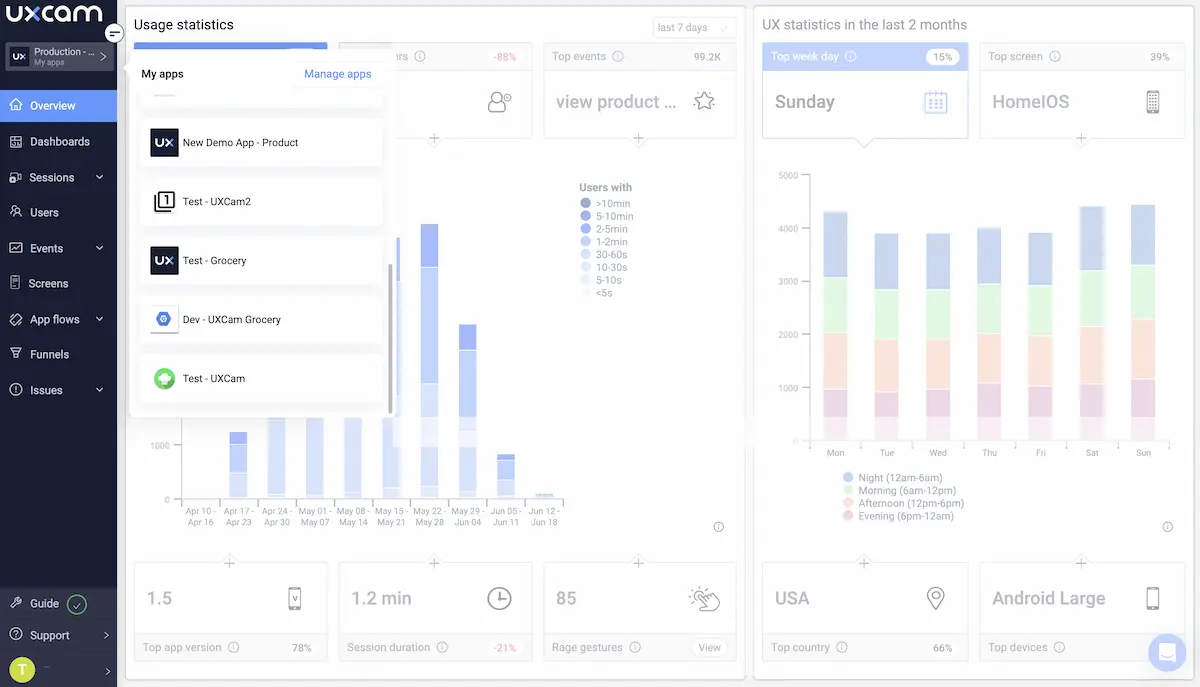
UXCam is an all-in-one mobile product analytics platform—and dashboards are a big part of that.
With UXCam, every user interaction is tracked and stored for analysis thanks to tagless auto-capture. To make all that data accessible, it's represented in real-time through interactive visualizations—think scatter plots, bar charts, and heatmaps.


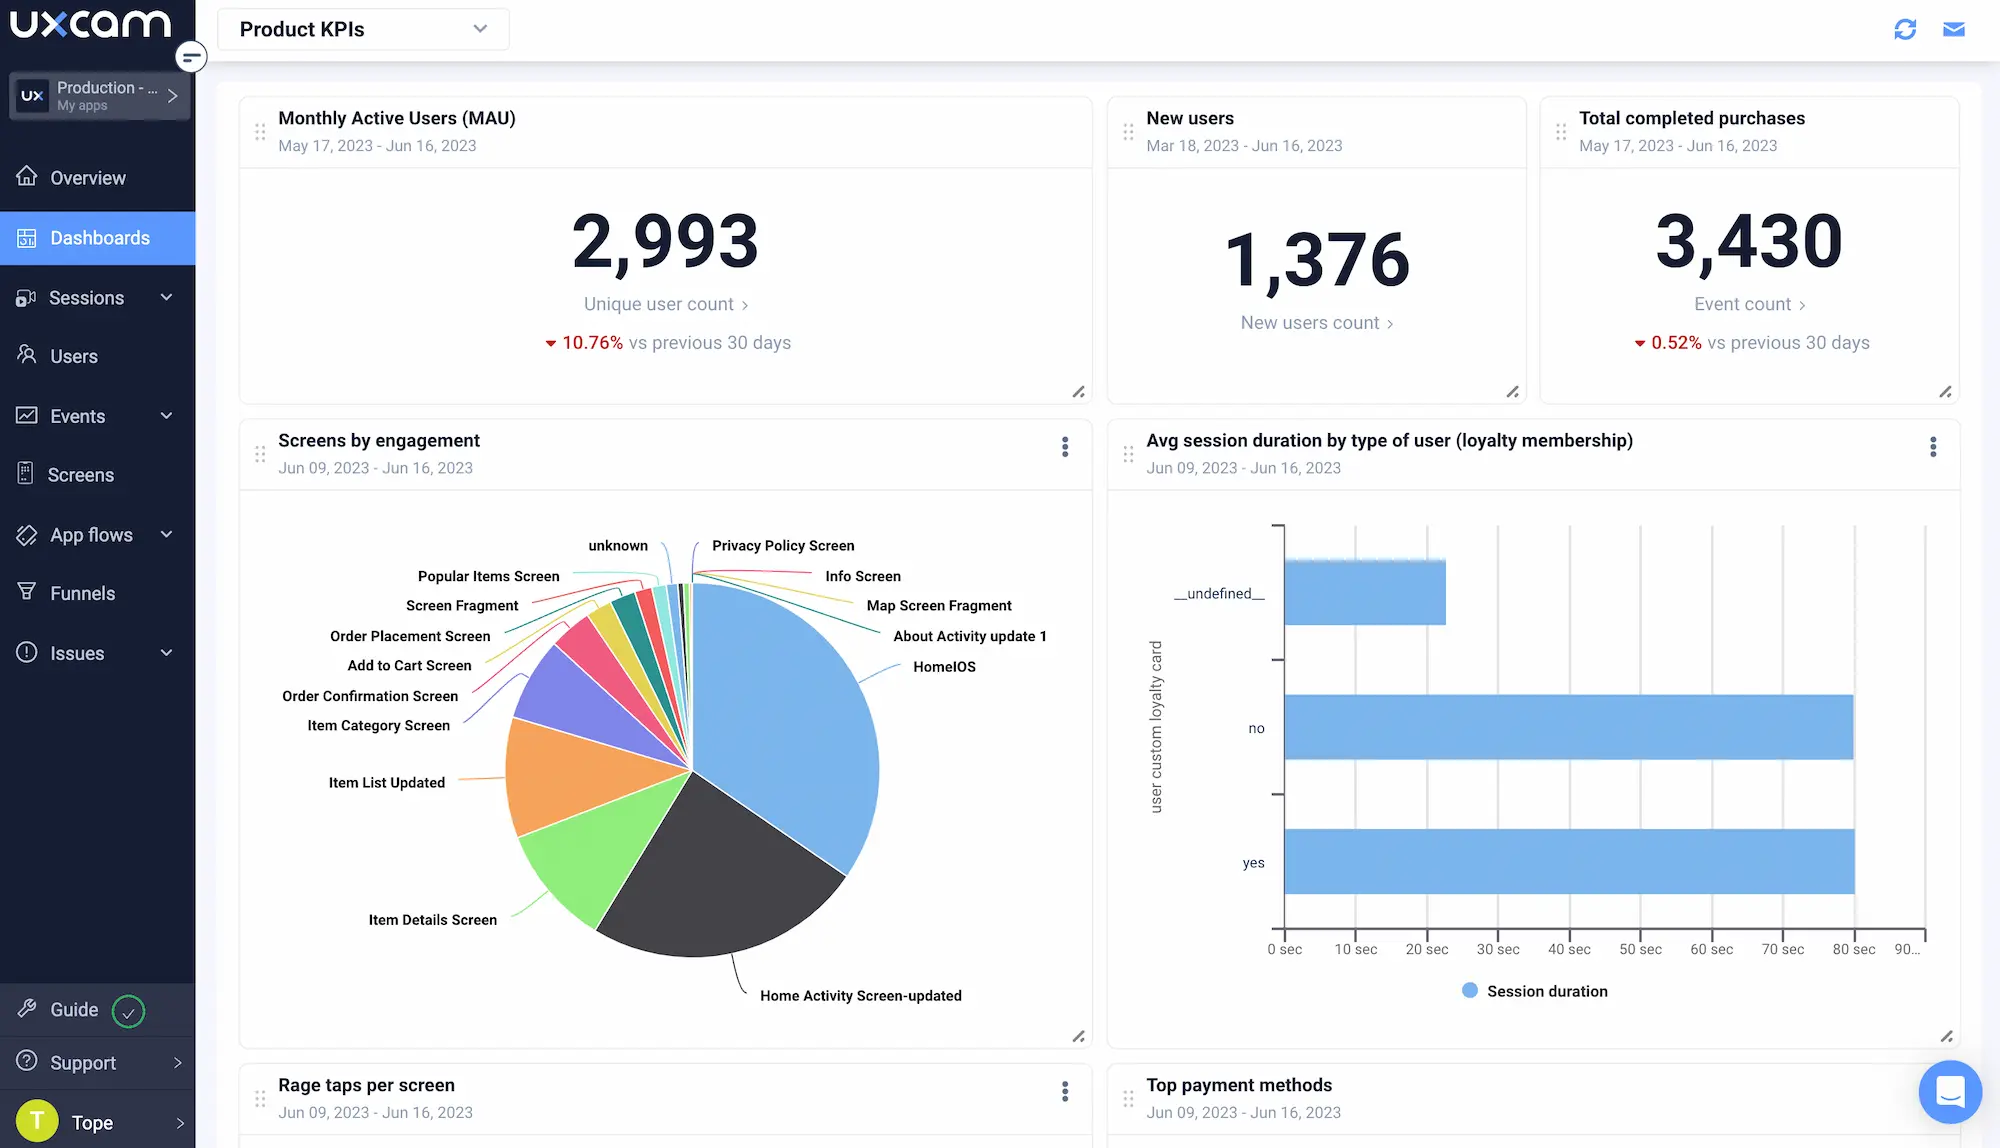
Where do dashboards come into play? Well, you can add these visualizations to custom or pre-built dashboards so that your team has easy access to the most up-to-date product data—without having to go digging for it.
There are a ton of use cases for this feature, so let's take a look at some of them.
How to use UXCam's product analytics dashboards
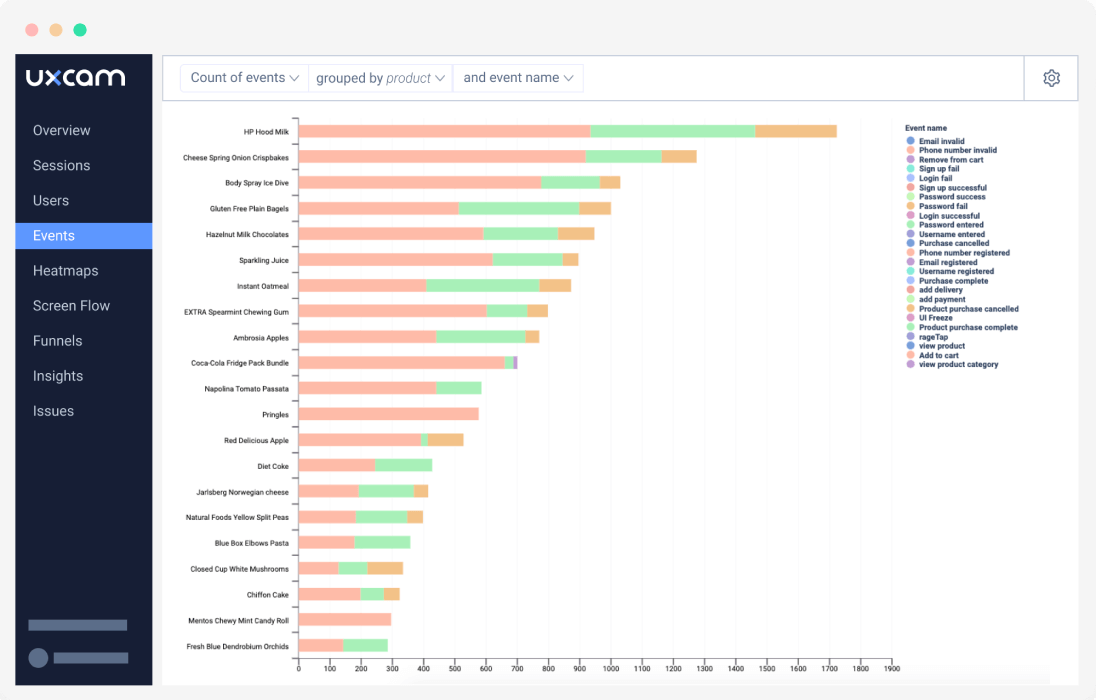
1. Track key actions and processes
By creating a dashboard for specific events, you can track key in-app actions and processes as they change over time.


Say you have a fitness app with an event for “workout_completed”—by creating a dashboard for that event, you can track the number of workouts completed per day, week, or month and look for engagement trends. This info might help boost the effectiveness of your push notifications by taking advantage of naturally occurring peaks and valleys.
2. Understand user patterns
Users tend to fall into groups, and those groups tend to behave similarly—that's why user segmentation is so effective. By splitting users into groups (e.g., age range, gender, etc.), you can track events via dashboards with the added context of user attributes.


For instance, pretend you run a cinema ticket app. By creating a dashboard for “ticket_purchase” by age group, you might find that users in the 30-40 age group are 30% more likely to buy 4 tickets at a time.
That might be a great opportunity to run a multi-buy promotion, which your teams can take advantage of.
3. Filter user sessions by UI element interactions
UXCam automatically records every user session for analysis—but what if you're interested in sessions that meet specific criteria?
You can create a dashboard that collects user sessions where the user exhibits the behavior you're interested in—whether that's interacting with a UI element or completing a goal.


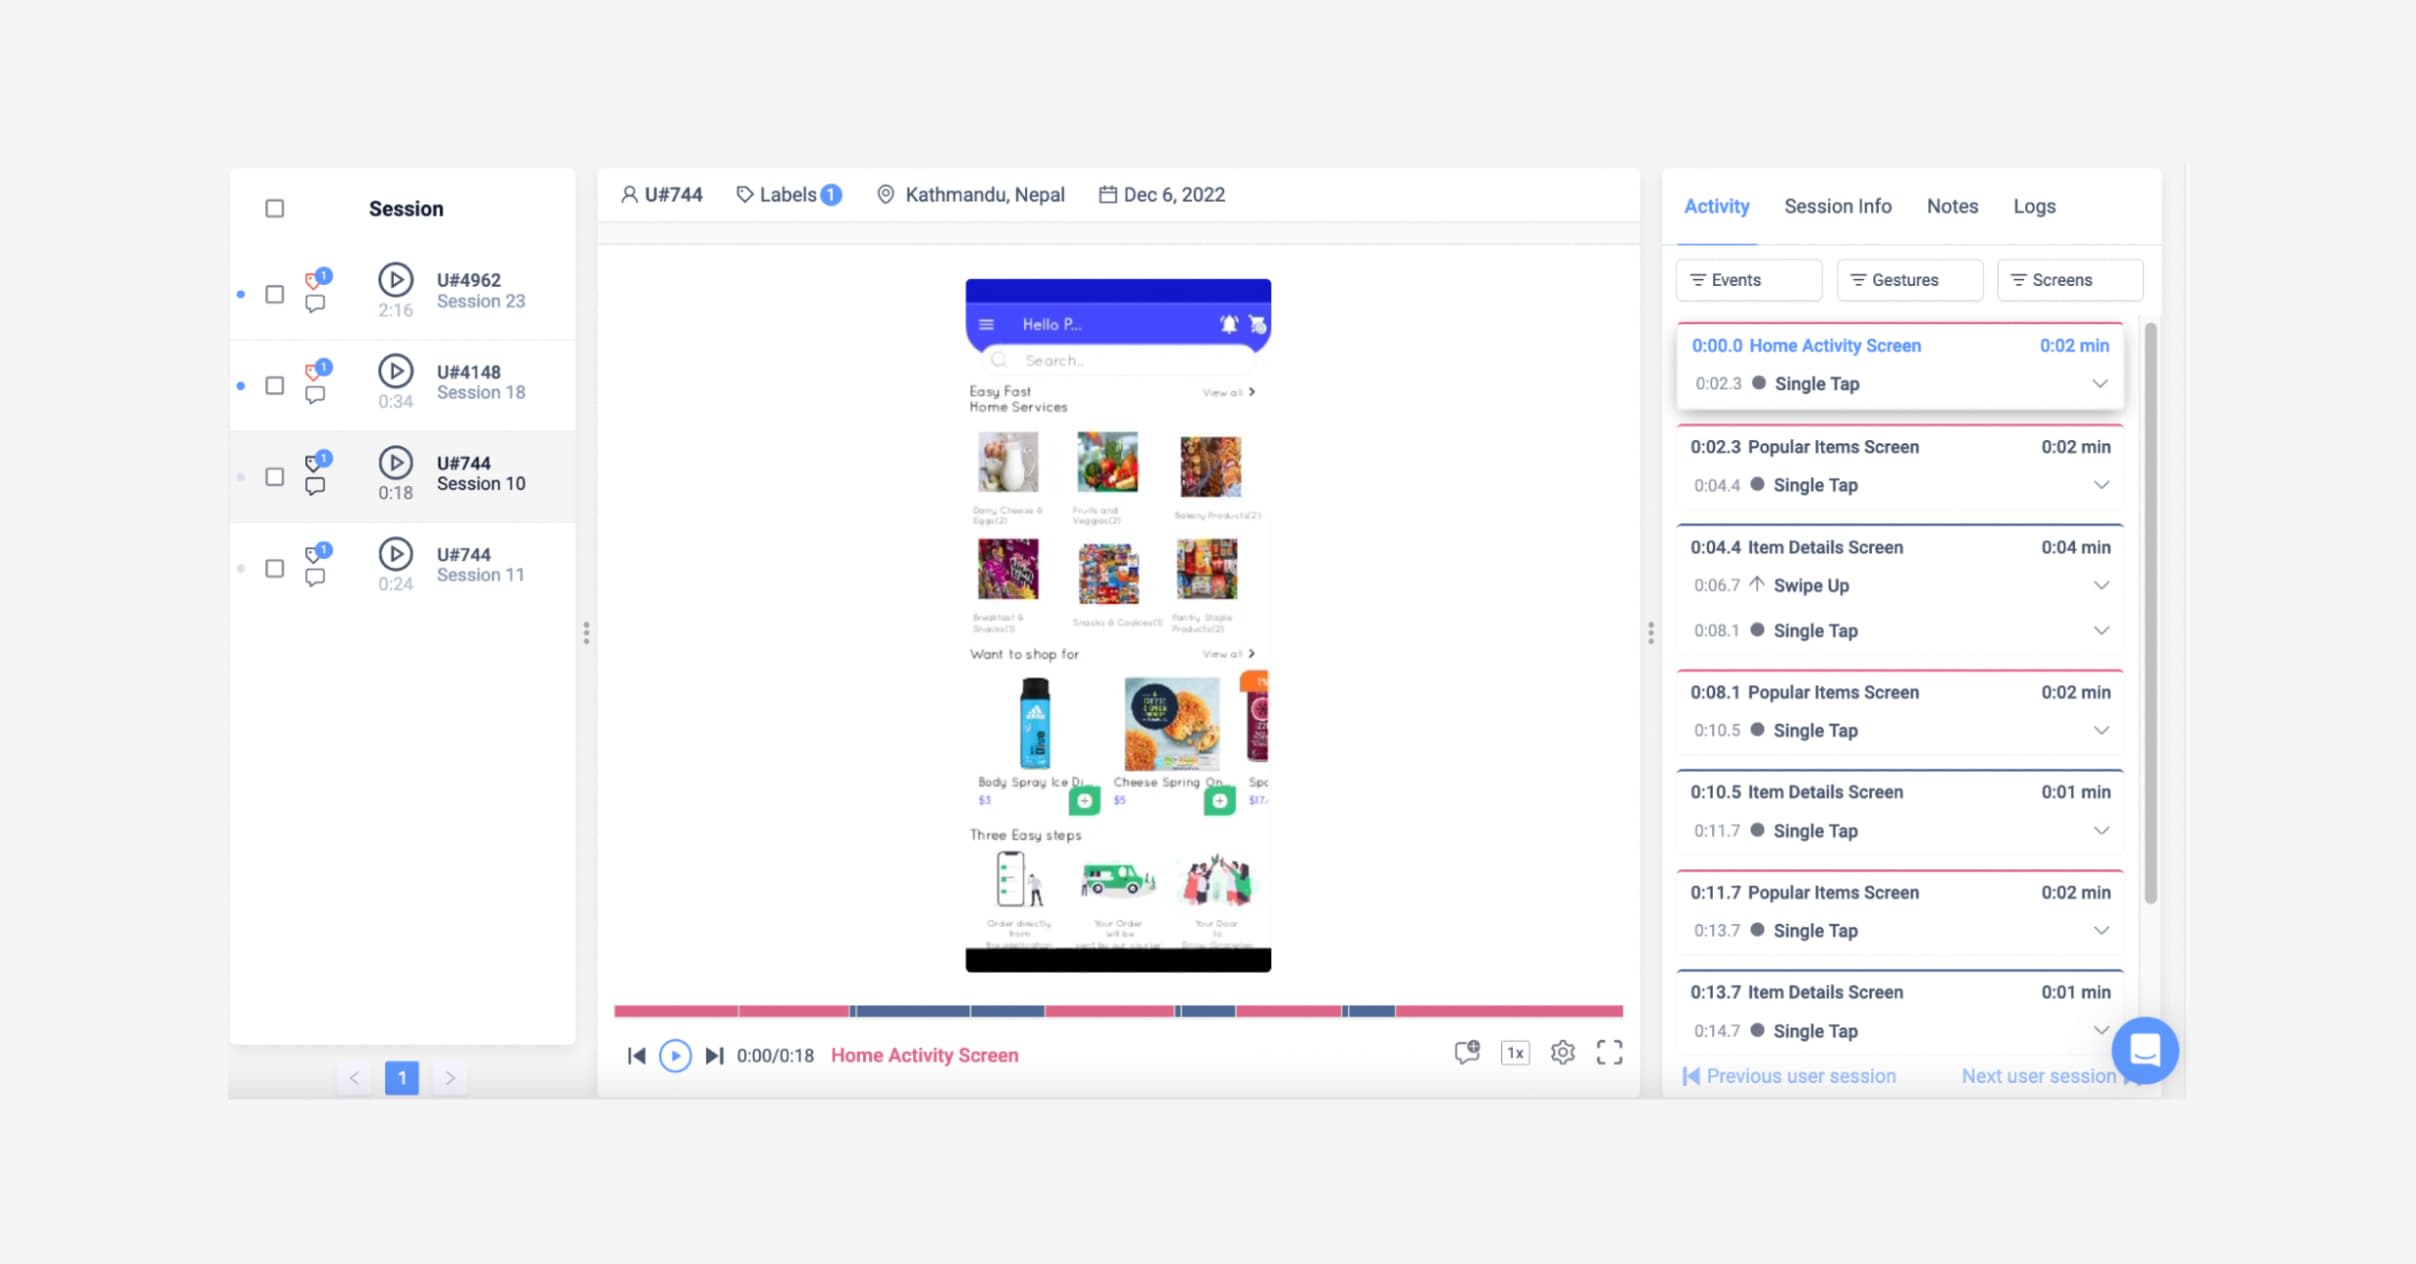
For example, if you have a hunch that users are getting lost when they try to “add_payment”, you can create a dashboard that collects sessions where that UI element is activated. You can then zoom in on specific users to see whether you're onto something.
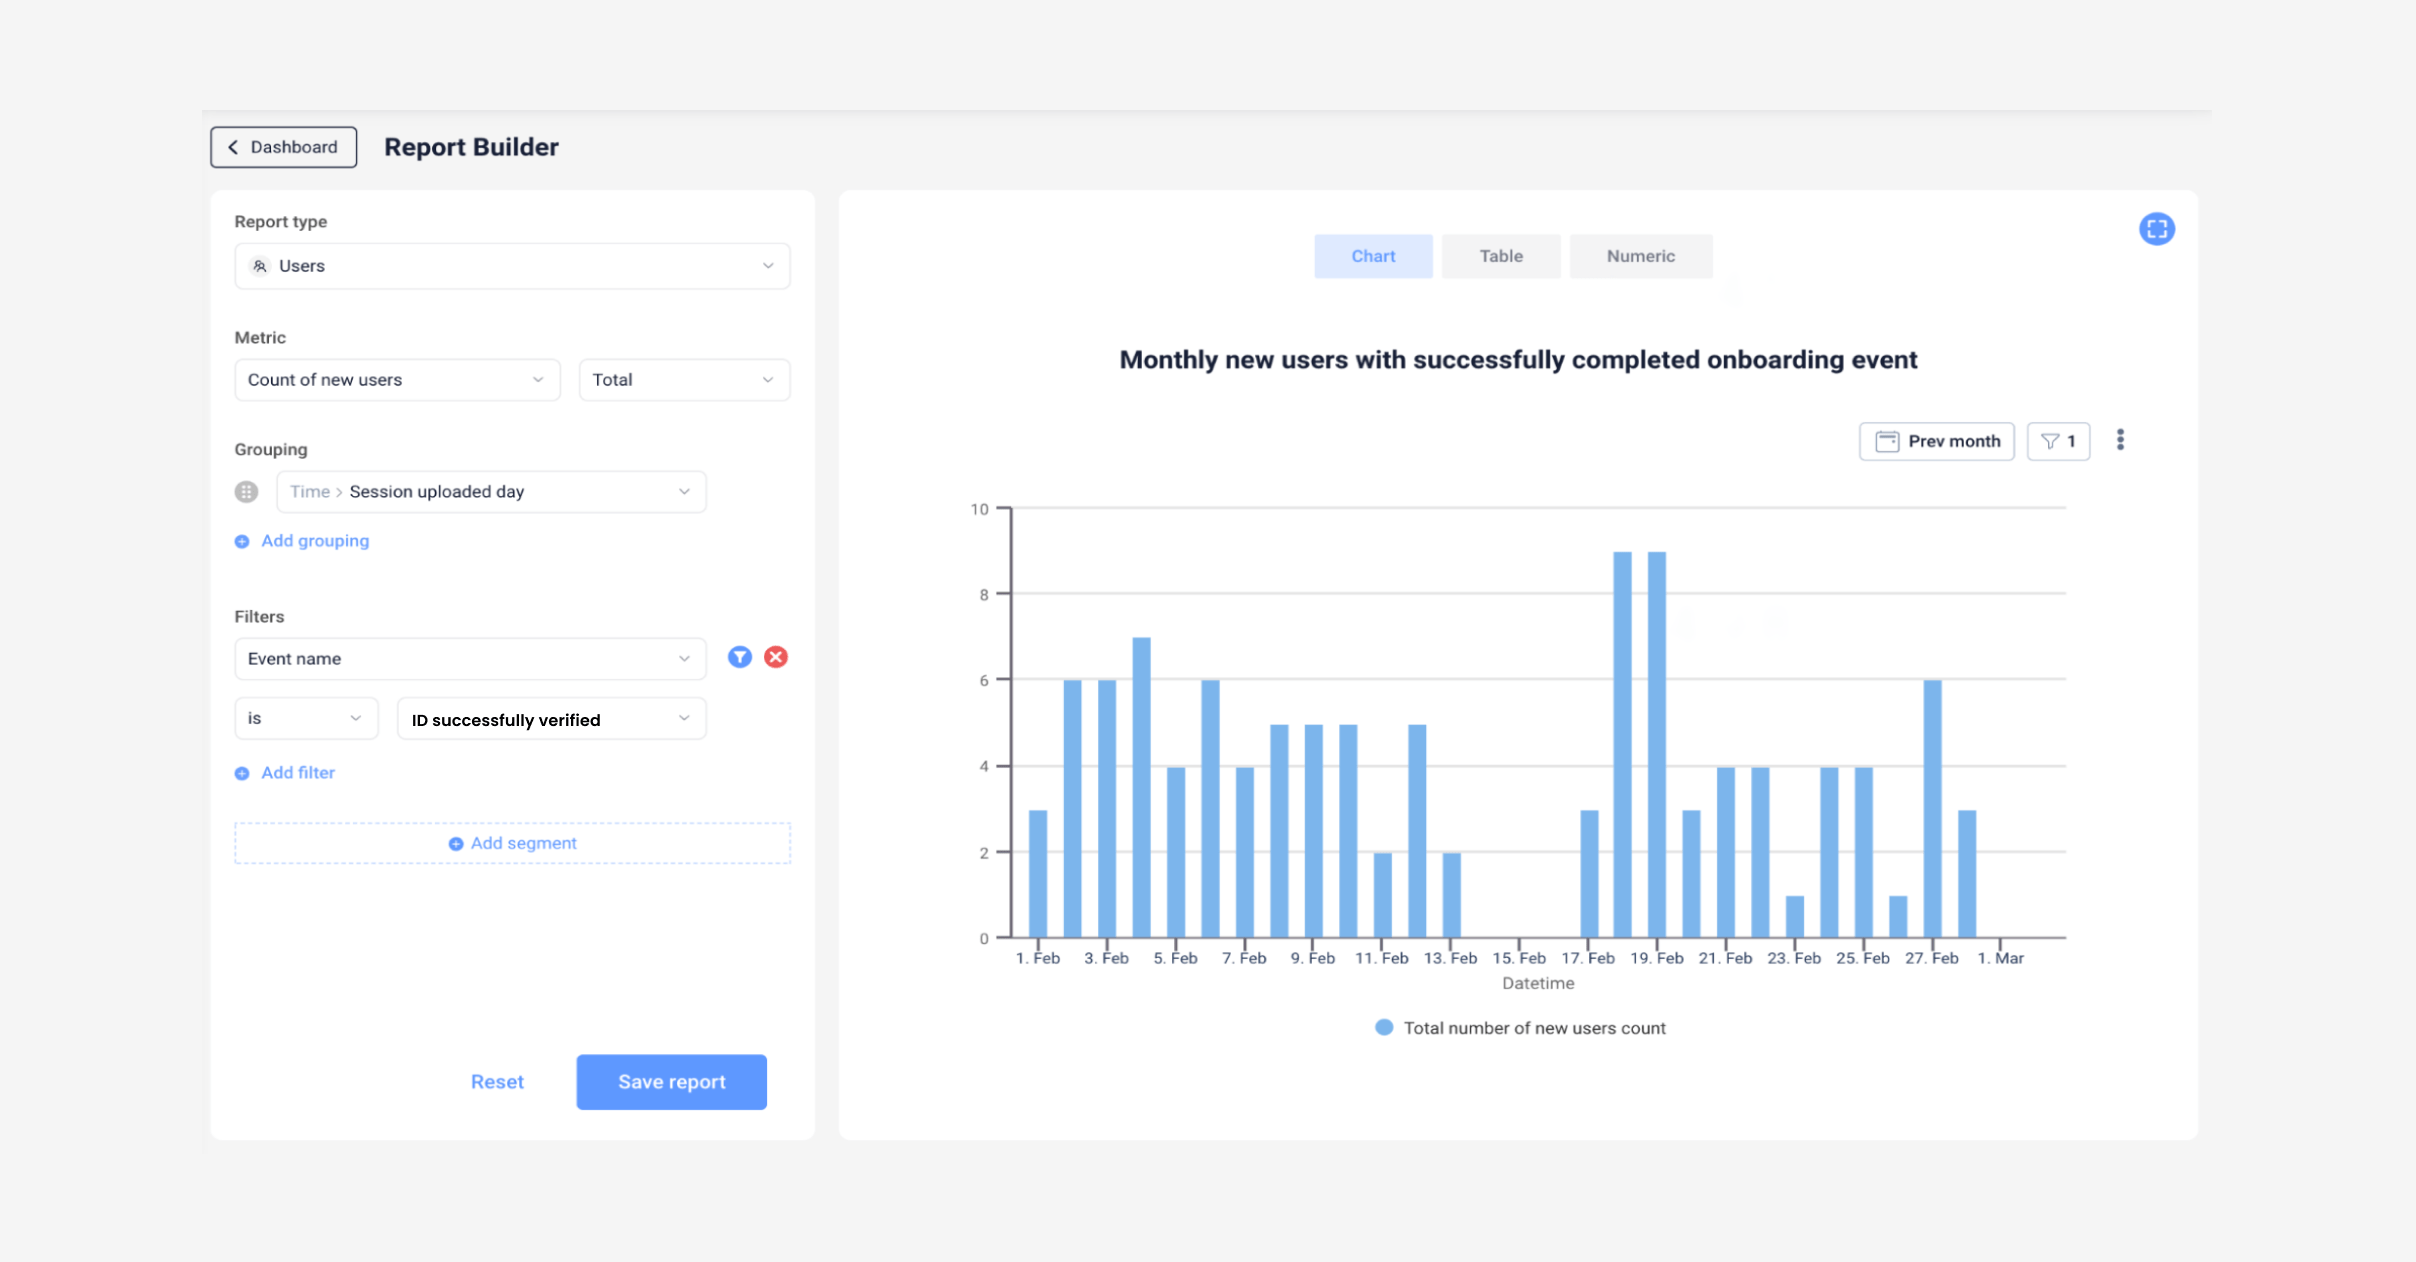
4. Analyze dropouts and non-converters
Pretty much every product has a goal—whether that's winning sales or getting downloads. When someone uses your product and doesn't reach that goal, it's worth investigating.
You can use UXCam to create a dashboard that tracks different attributes of dropouts and non-converters—quantity, change over time, device type, etc.—and figure out what could be causing the issue.


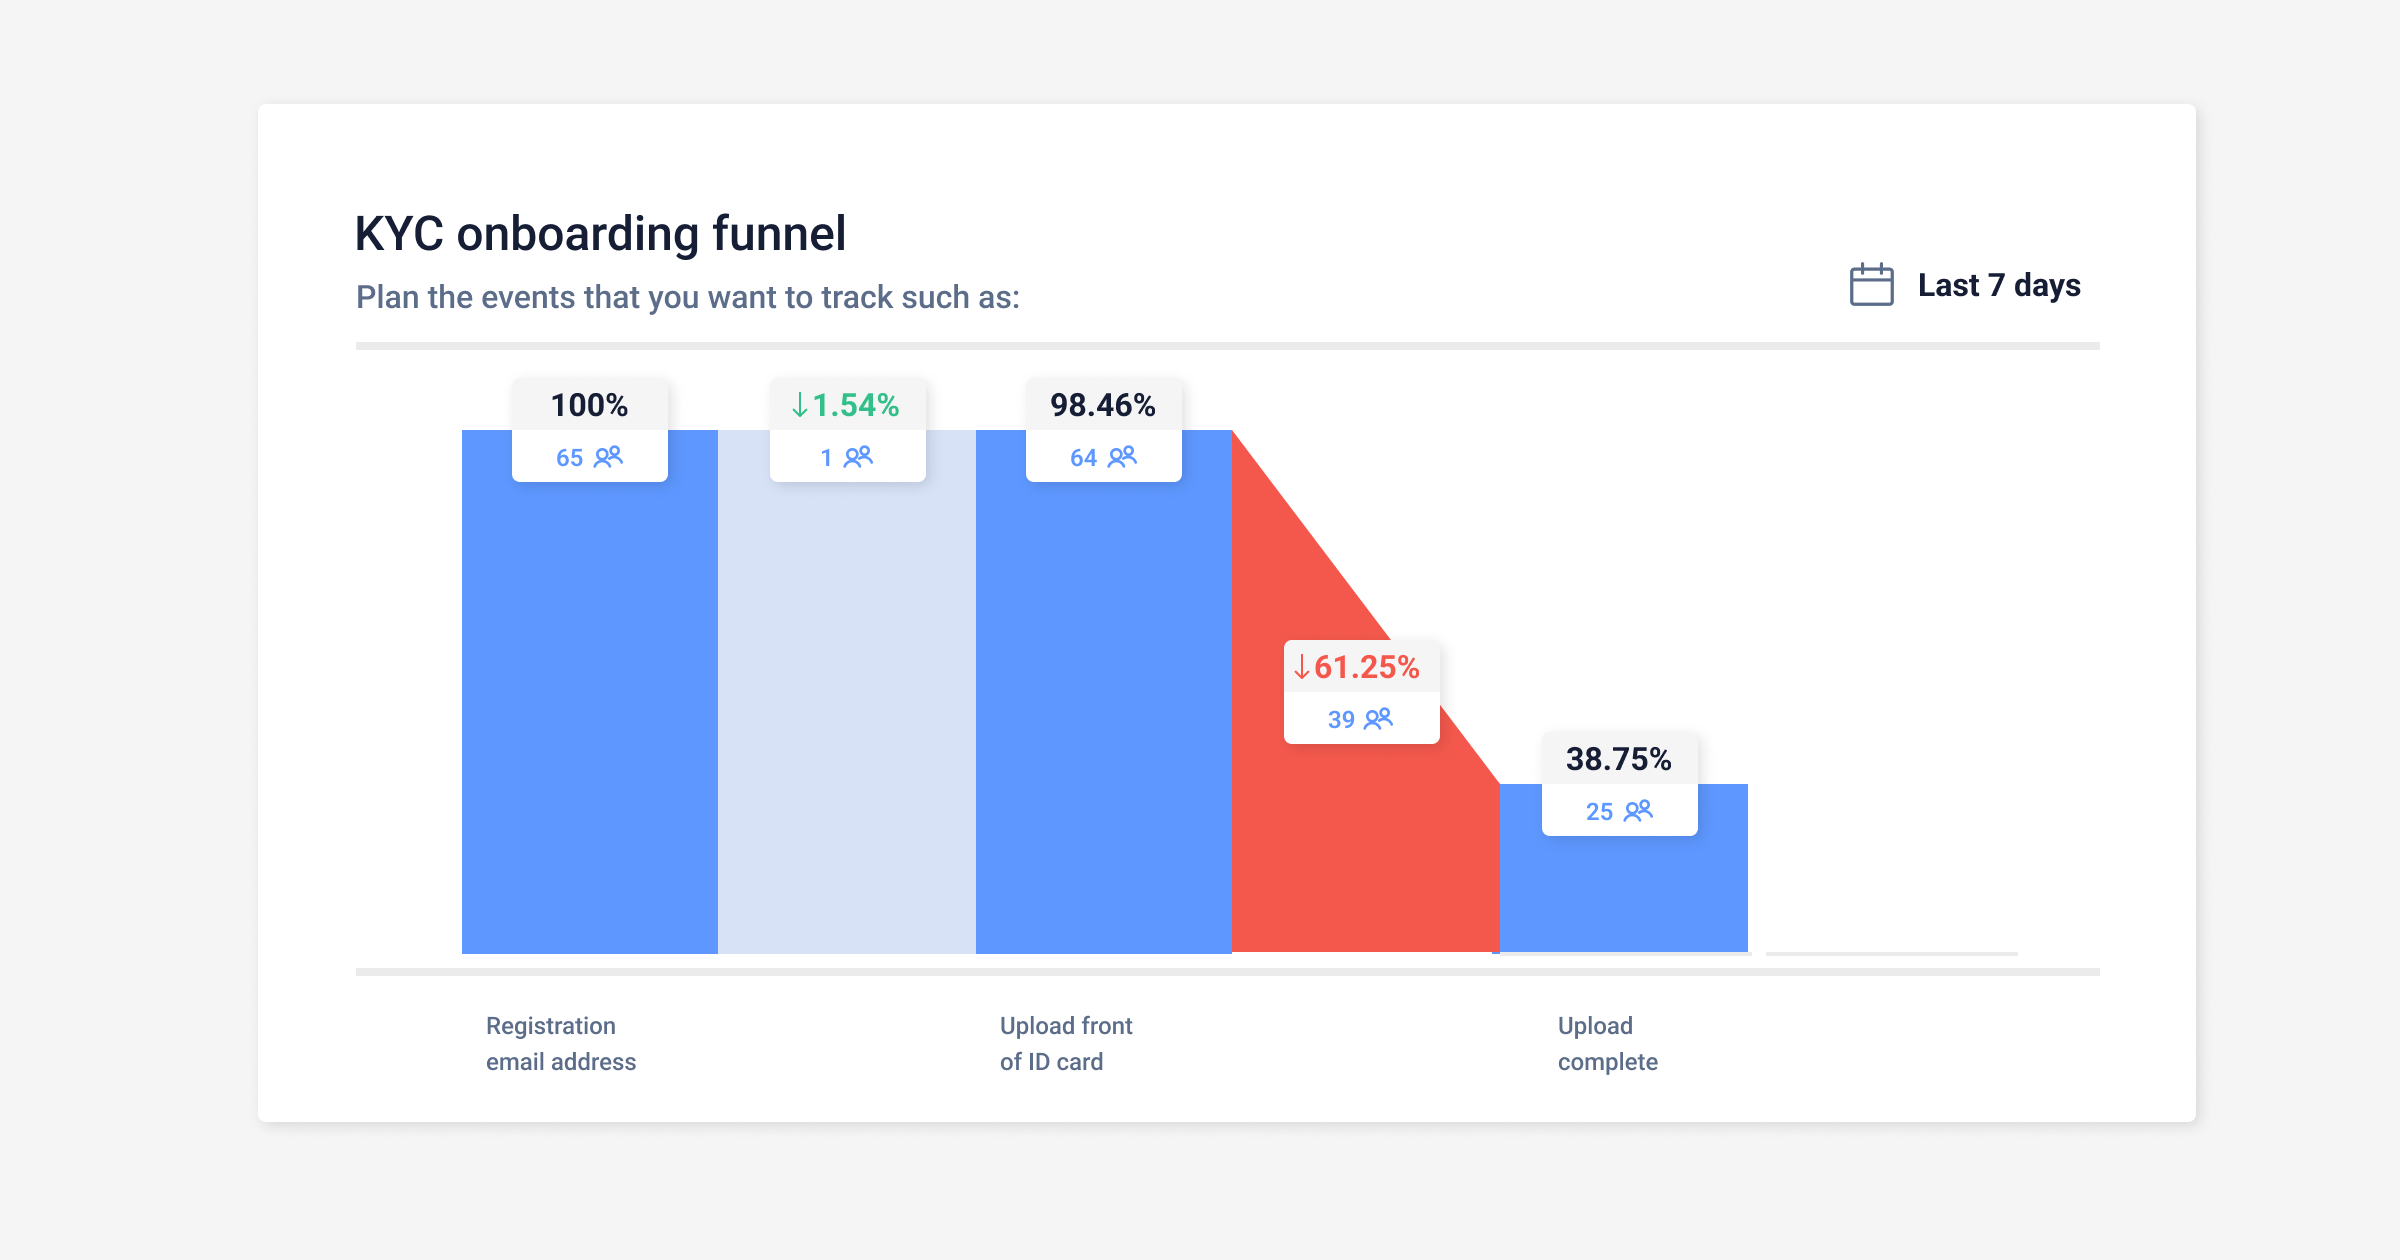
Let's say you noticed a drop in conversions after launching an update. By creating a dashboard for dropouts, you might find that there was an increase in rage taps for this segment that corresponds with the update.
5. Track new feature adoption
When you launch new features, it's important to monitor usage to look for trends and issues relating to adoption.


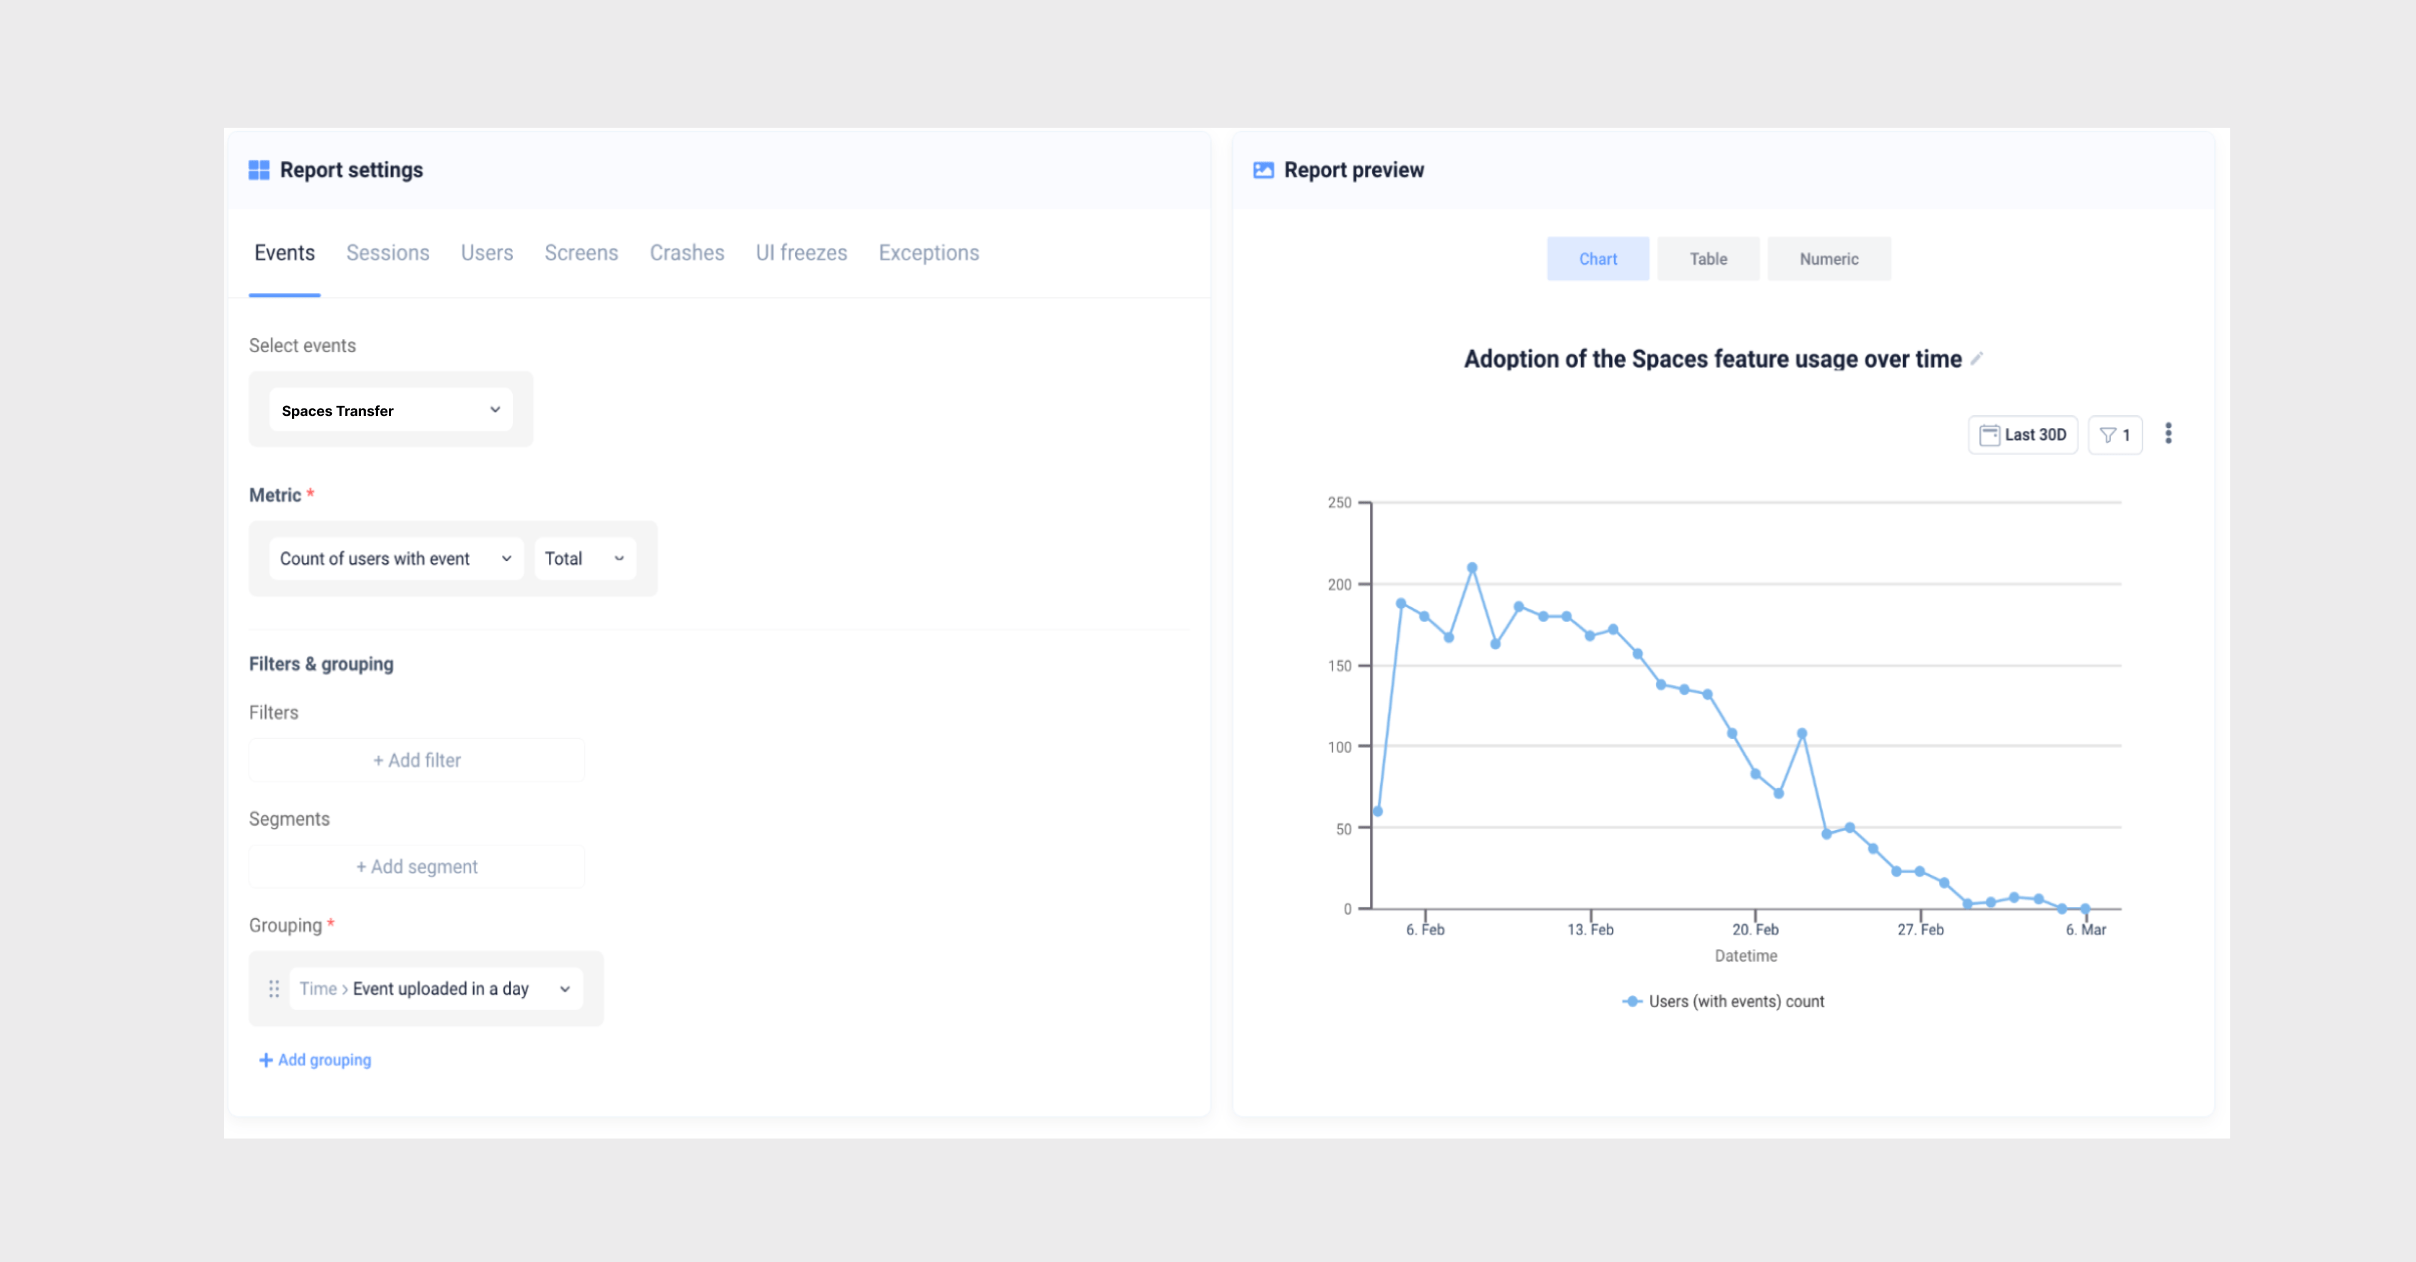
Creating a dashboard is a great way to do this. You can track every interaction with the new feature to see overall trends and individual behaviors.
For instance, let's say you just launched a new alert feature. You could create a dashboard that tracks the number of users who activate the feature, how many times it's activated, and even the days and times that it's used.
You can also zoom in on these sessions to see how users are using the feature in order to optimize it.
6. Isolate beta testing data
There's no need to limit yourself—by integrating UXCam with your beta version to keep its data separate from the live version. You can also create dashboards for the beta version.


If you're trialing a new feature with a select group of beta users, you can create dedicated dashboards to track all the data points we've covered thus far—and more. This makes it much easier to draw meaningful conclusions that aren't muddied with any interference from the main product.
7. Measure the impact of app versions
Every version release brings questions. Did we make the right call? Are users confused? Do our changes actually help?


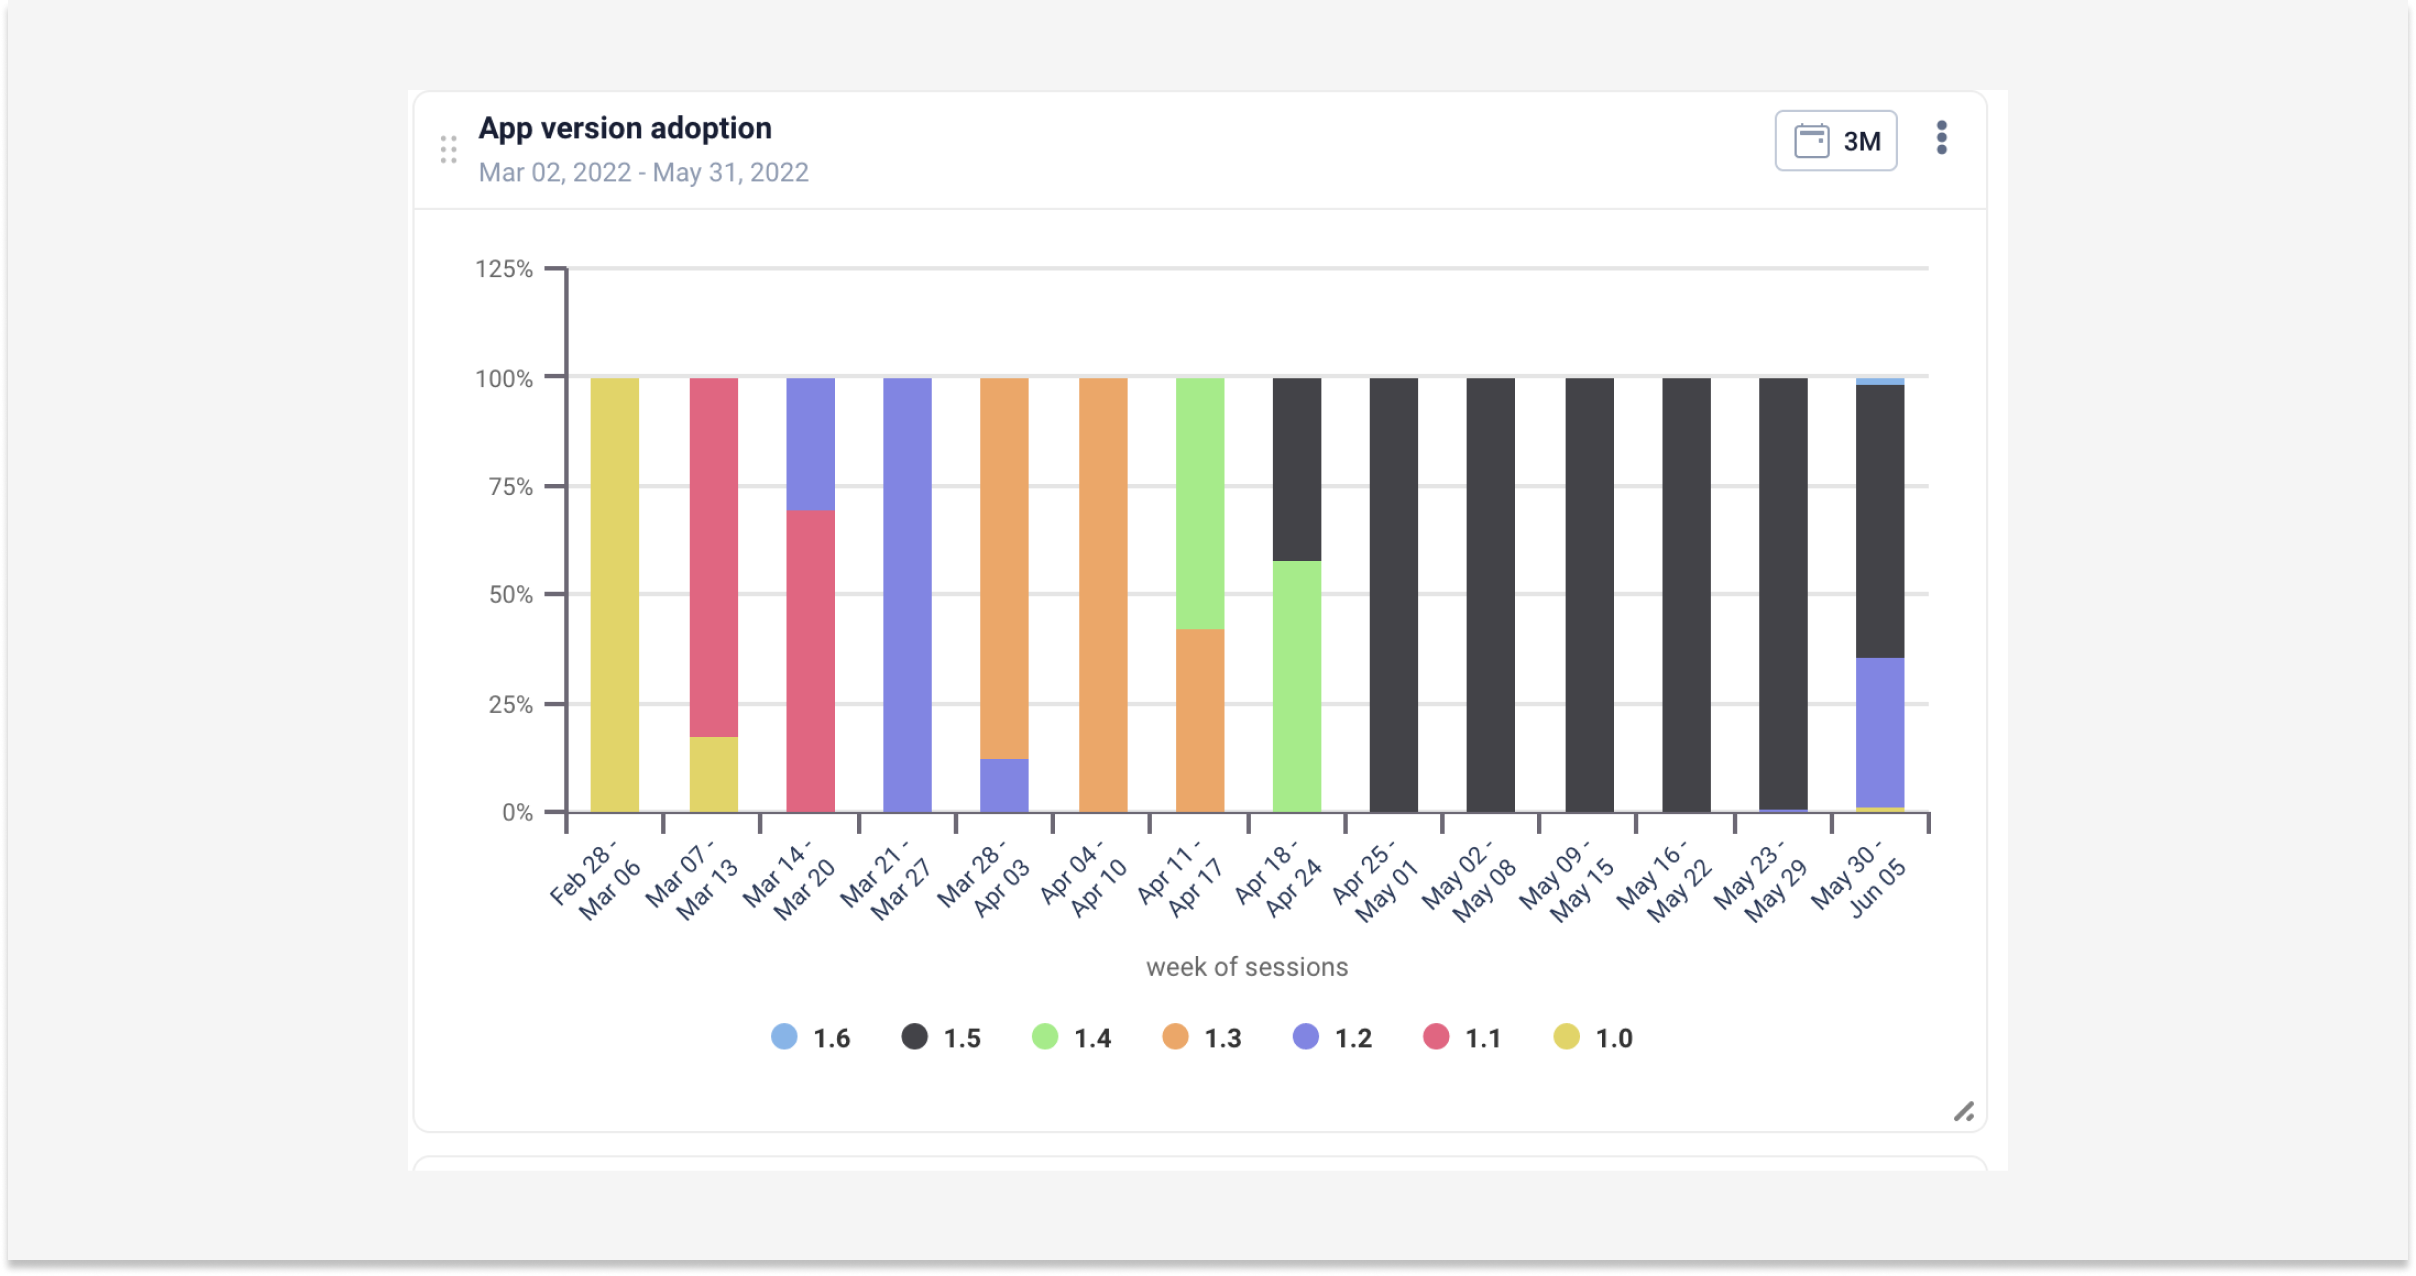
UXCam allows you to compare and contrast app versions through dashboards. You can view charts, graphs, and other visuals that show the differences between versions—including performance, user engagement, and support metrics.
Do more with your product analytics dashboards
Product analytics dashboards exist to make data more accessible. They give you the ability to make smarter product decisions quickly and reliably.
With UXCam, you can fully customize your dashboards to fit any use case and answer any question—just drag and drop some widgets and add some filters.
Don't let your product data sit in a vacuum. Get started with a 14-day free trial and see what UXCam can do.
You might also be interested in these;
How to measure product adoption (metrics, formulas & tools)
5 Best product analytics tools and software
Top 6 LogRocket alternatives for product analytics & monitoring
Product metrics - How to track and apply them effectively
Product insights - Definition, benefits & practical examples
AUTHOR
Tope Longe
Product Analytics Expert
Ardent technophile exploring the world of mobile app product management at UXCam.


Related articles


Product best practices
Why creating a data-driven culture has less to do with data than you think
Kishan Gupta, CEO, shares 5 tips and techniques for fostering a data-driven culture based on his own experiences building and leading...


Kishan Gupta
Co-Founder of UXCam


Product Management
How to Increase Mobile App Retention: Ultimate Guide
Are you looking to improve your customer retention rate? Sticky apps have characteristics that create a sense of inclusiveness for your users, bringing them back more...


Anurag Vuthunuri


Product Management
12 Best Free Product Management Courses in 2026
The free PM course landscape in 2026 is dramatically better than it was three years ago. Top MBA programs offer audited versions on...


Silvanus Alt, PhD
Founder & CEO | UXCam