Top 5 Product Metrics to Track and Measure 2026


Data is the backbone of any successful product strategy. Tracking, analyzing, and actioning product metrics leads to better decisions, happier users, and tons of other benefits—many that we’ll touch on later.
But it isn’t possible to track everything. And even if you could, understanding the what-and-why behind those metrics can be difficult.
In this UXCam guide, we’re pulling back the curtain to show you how our customers use product metrics to inform development decisions and drive sustainable growth. We’ll cover the different types of product metrics, strategies for measuring user engagement, and how to interpret the results.
Let’s dive in.
Summary - Top 5 Product Metrics to track
| Product Metric | Summary |
|---|---|
| Conversion Rate | Percentage of visitors who take a desired action, showing how effectively your product converts potential customers. |
| New Customer Growth Rate | Tracks how quickly your product attracts new customers, indicating user base growth. |
| Churn | Percentage of customers who leave over a specific period; lower churn reflects higher satisfaction and loyalty. |
| Lifetime Value (LTV/CLV) | Total revenue expected from a customer throughout their relationship with your company. |
| Monthly Recurring Revenue (MRR) | Predictable monthly income from subscription-paying customers. |
What are product metrics?
Product metrics are quantitative measures that help evaluate the performance, quality, and value of a product. They can be used to track progress, identify problems, and optimize solutions.
Conversion rates are a great example. You can track conversion rates within your product to uncover all kinds of insights—how users are interacting with features, which areas of the product have higher engagement, and how user activities lead to tangible results.
Product analytics tools like UXCam are used to track product metrics like this (as well as visualize them in useful ways). In the example below, UXCam’s screen flow feature is used to see how users interact with the product.


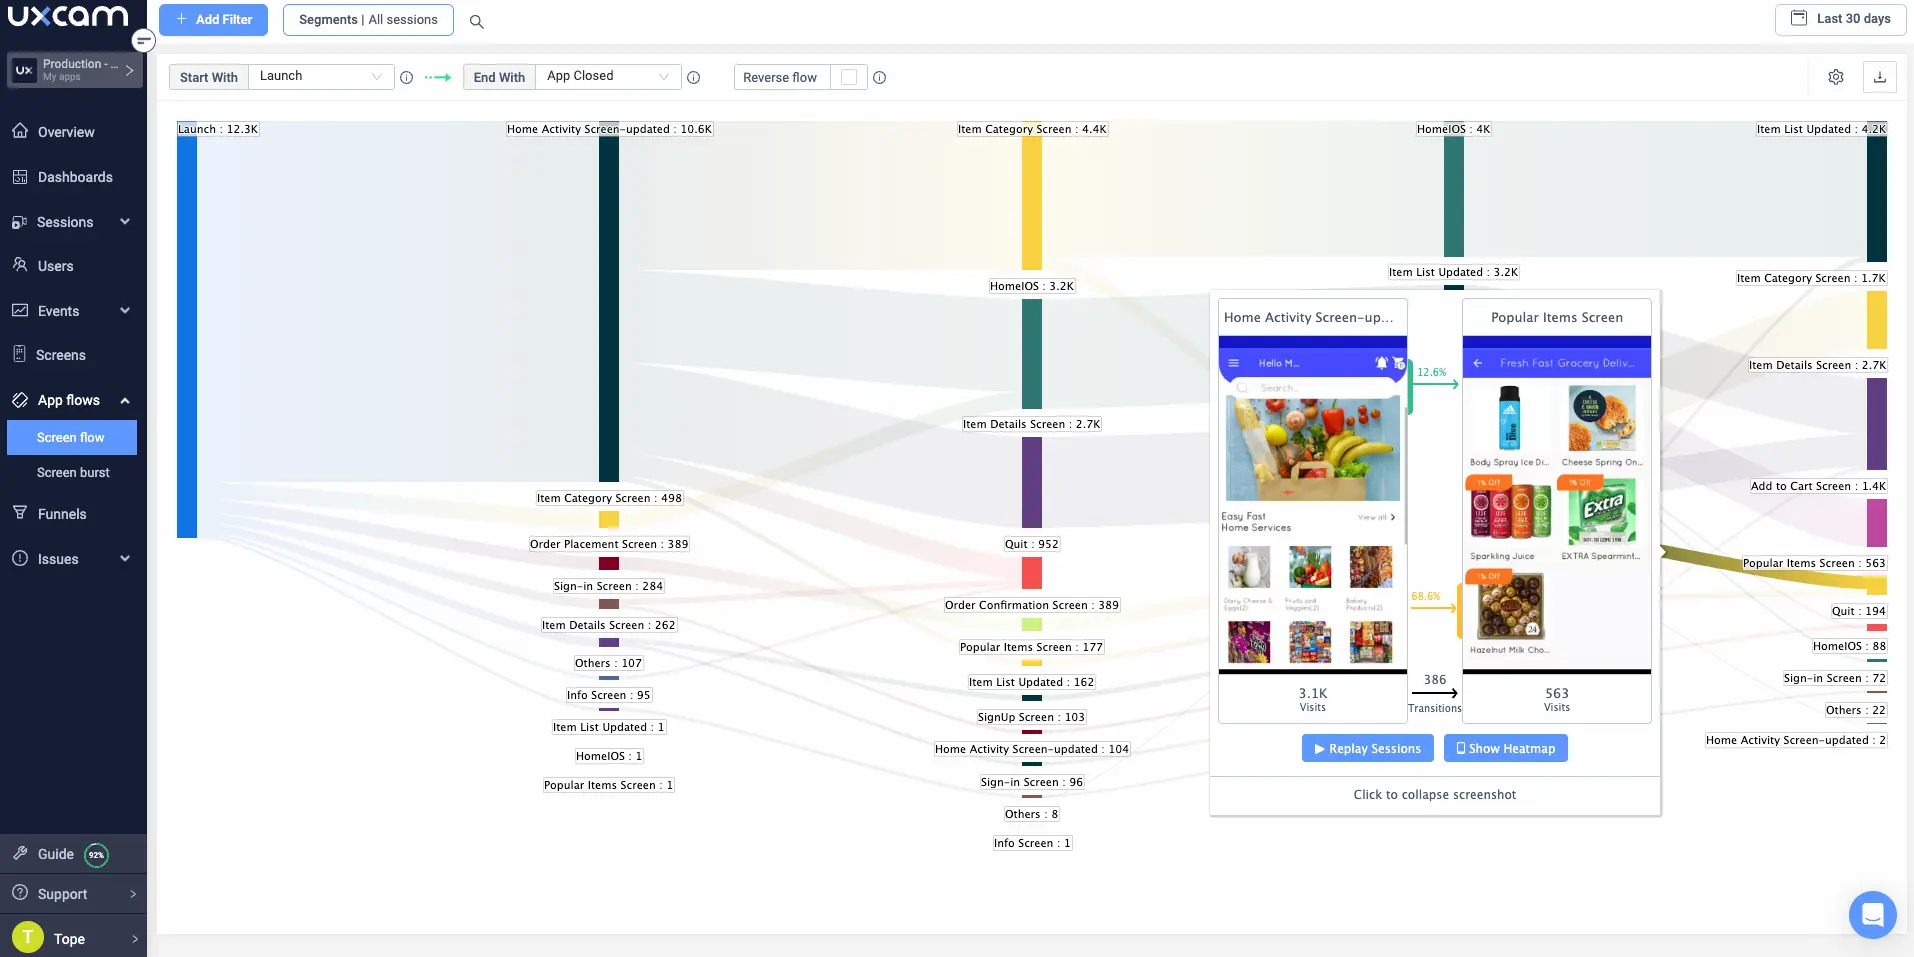
This helps identify areas that need improvement and opportunities to increase engagement.
At the core, product metrics provide data-driven insights into how users are engaging with your product—allowing you to make smarter decisions for better results. By understanding what resonates with users, you can create more compelling experiences and powerful products.
Types of Product Metrics
Different kinds of metrics are designed to offer insights into different areas of your product and business.
Common metric categories include:
Acquisition metrics: Metrics that tell you where your users are coming from, the rate at which new users are signing up, and other related information (e.g., number of clicks, cost per acquisition).
Engagement metrics: This type of metric focus on user activity within the product—like how many active users you have, how often they use your product, which features they like, and more(e.g., time spent in the app, interactions with features).
Retention metrics: Retention metrics help measure customer loyalty and long-term engagement with your product (e.g., frequency of use, average session length)..
Revenue metrics: Revenue metrics tell you how much money is coming from users for particular features or products (e.g., lifetime value, customer acquisition cost).
Customer satisfaction metrics: These metrics measure how satisfied users are with your product or service (e.g., Net Promoter Score, Customer Effort Score).
A well-rounded strategy will draw on a selection of key metrics in all these categories to push development and the business in a positive direction.
Dashboards are especially helpful for this—these tools give you an at-a-glance view of your performance so that you can quickly see which areas are working and which need improvement.
Here’s an example of a dashboard built with UXCam.


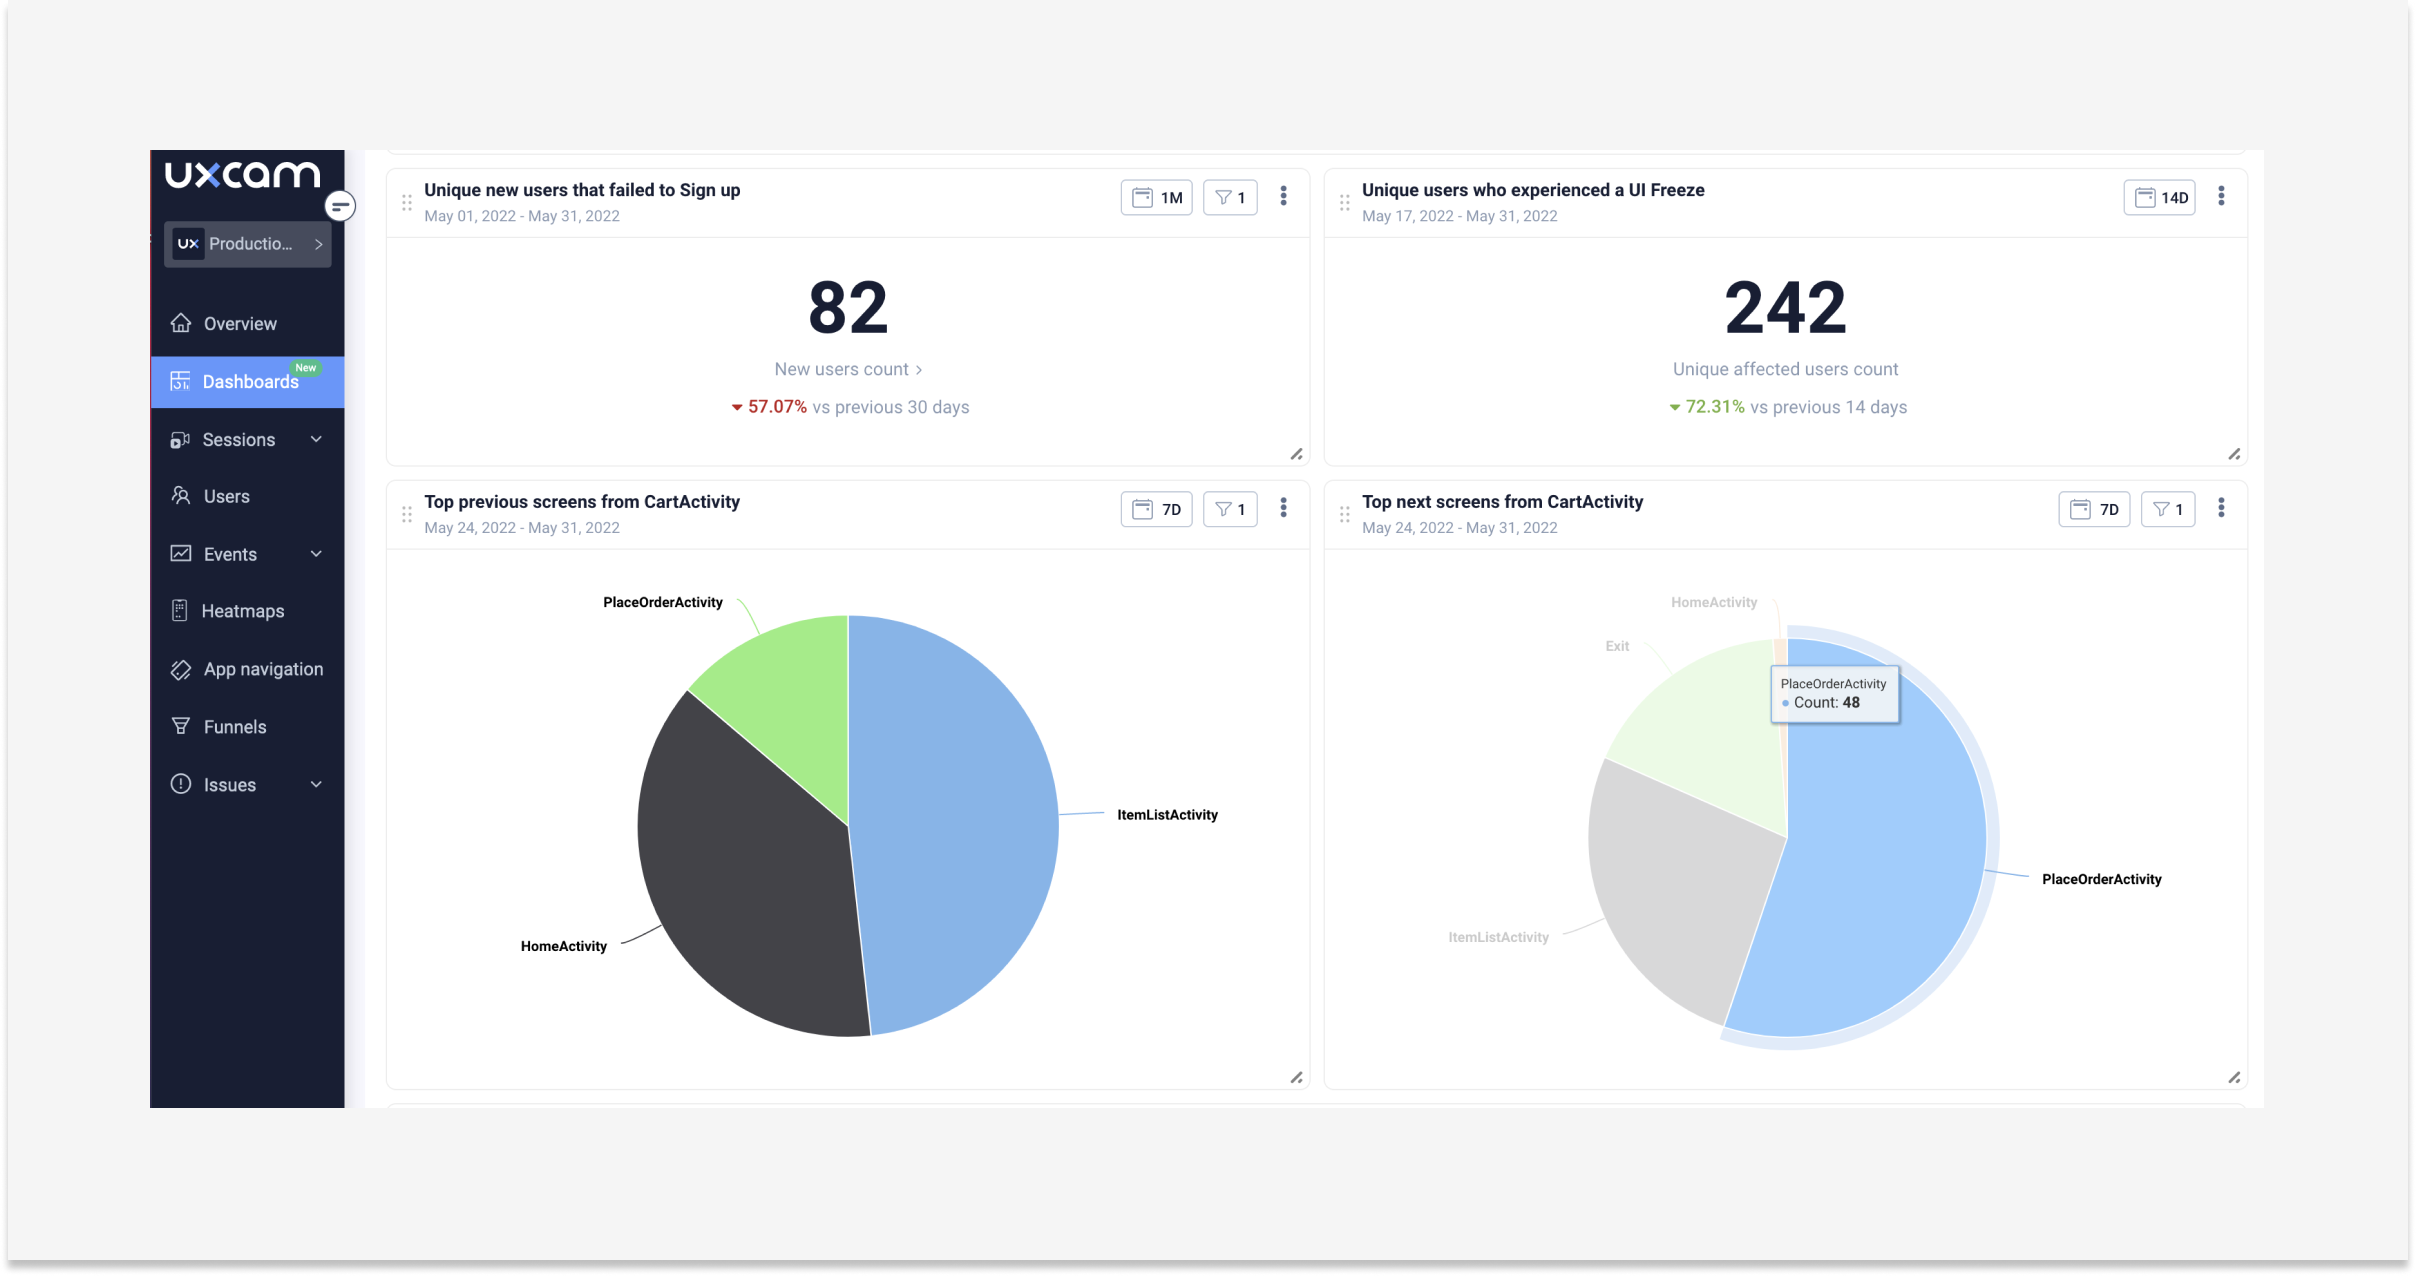
UXCam’s dashboards are modular and highly flexible. You can populate them with custom and pre-built reports, and also integrate with external analytics tools like Google Analytics to make sure you have full visibility into your product or service’s performance.
Why are product performance metrics important?
More informed product decisions
Product metrics offer insights into how users interact with a product, which features are most used, and where users may be experiencing difficulties. This data can guide product development, helping teams prioritize features, fix bugs, and optimize user experience.
Customer experience insights
Product metrics can shed light on user behavior, preferences, and pain points. They can help identify areas where the product excels and where it falls short. These insights can then be used to enhance the product, leading to improved customer satisfaction and loyalty.
Earn executive approval
Product metrics provide tangible evidence of a product’s performance, making it easier to justify resource allocation, secure budget increases, or gain support for new initiatives. By demonstrating the product’s value and potential for growth, product metrics can help align executive and product team goals.
Criteria to consider when choosing product metrics
To select the ideal product metrics for your app, consider three key factors:
Goal alignment: Make sure your chosen metrics align with your team's objectives.
North Star alignment: Connect your product metrics to your North Star metric. Ideally, the product metrics you track should feed into your product’s North Star metric that is used to measure overall success.
Contextualize basic metrics: Some metrics offer deep insights on their own. For example, CAC is an effective way to measure marketing effectiveness. However, many basic metrics need to be contextualized. “Signups” isn’t especially useful without knowing who is signing up, where they’re coming from, etc.
5 Key product analytics metrics to track
1. Conversion rate
Conversion rate is a fundamental product metric that measures the effectiveness of your product in turning potential customers into paying customers.
It's typically calculated as the percentage of users who take a desired action, like making a purchase, signing up for a newsletter, or filling out a contact form. The percentage is typically calculated out of the total number of users who visit your product or entered a specific funnel.
2. New customer growth rate
New customer growth rate is a metric that assesses the rate at which your product is acquiring new customers. It's an essential measure of your product's ability to expand its user base and attract fresh prospects.


You can easily track this metric out-of-the-box with UXCam. Plus, new users are automatically segmented for analysis into their behavior, demographics, conversions, and more.
This helps you better understand the needs and preferences of new customers and create strategies to convert them into paying customers.
3. Churn
Churn measures the rate at which customers stop using your product over a specific period.
Creating a “sticky” product usually means a few things—higher user satisfaction, higher LTV, and lower churn rates.
With UXCam, you can track the features your customers use regularly to understand what makes them stay or go. By examining their behavior, you'll be able to identify areas of improvement to create loyal customers and reduce your overall churn rate.
4. Lifetime value
Lifetime value (LTV or CLV) is a metric that quantifies the total value a customer is expected to generate for your product throughout their relationship with your company.
It involves predicting the revenue a customer will bring over their entire interaction with your product.
5. Monthly Recurring Revenue (MRR)
MRR is a crucial metric for subscription-based products. It measures the predictable, recurring revenue generated from customers who pay for your product on a monthly basis.
How to choose and track product metrics
Step 1 - Define your business goals
As we mentioned earlier, you can’t track everything. Not meaningfully, anyway. So, a good product metric strategy focuses on metrics that will help you achieve goals while giving a backseat to vanity metrics.
To determine the right product metrics to track, start by setting one or more business goals and ask yourself how each metric will help you reach them.
For example, if you want to increase the amount of revenue you generate over a user’s lifetime, you’ll want to track LTV—but also a whole host of related metrics that will help you achieve your goal:
Churn rate: To see how quickly users are dropping off your service.
Monthly active users: To understand the size of your user base.
Average revenue per user (ARPU): To see whether you’re optimizing monetization opportunities.
Feature usage: To see which features lead to upgrades.
…and so on.
Step 2 - Understand your user's journey
Understanding your user's journey is important for selecting the right product metrics.
You need to identify the key touchpoints and actions that users take as they interact with your product. This helps you pinpoint where in the journey you need to measure performance and identify the critical moments that impact user satisfaction and conversion rates.
To continue our example, if your product is especially complicated, your onboarding sequence is probably pretty relevant to your churn rate (and LTV). Tracking onboarding completion rate and satisfaction is a great way of understanding if you’re setting users up for long-term usage.
Step 3 - Use segments
Not all users are the same—and segmenting your metrics can provide deeper insights into how different user groups interact with your product.
You can segment your user base by demographics, usage patterns, geographic locations—there’s no “right way” to go about it. In most cases, it’s worth digging deeper into the data and exploring how different user segments behave.
For example, you might look at non-segmented LTV data and see that you’re falling short of your target. But upon segmenting your data, you might find that a less-tech savvy user segment is dropping off early on and tanking your overall LTV.
UXCam makes it easy to segment your data by any characteristic or trait. With just a few clicks, you can explore how different user segments interact with your product and zero in on insights that lead to better product decisions.
Step 4 - Visualize your data
Visualization is a powerful tool for making sense of complex data. Patterns tend to pop out much more readily when you’re looking at a chart or graph.
We mentioned this earlier, but dashboards are your best friend here.
Use dashboard to build custom visualizations that make it easy to spot trends. You can even set up email notifications to stay on top of changes in user behavior and track progress against goals.
Conclusion
Choosing the right product metrics is essential for measuring and improving the performance of your mobile app. Product metrics help you track your progress towards your business goals, understand your user’s journey, and optimize your user experience.
UXCam is an all-in-one product analytics dashboard that allows you to track, analyze and visualize all of your mobile app’s key performance metrics in one place. We make it easy to quickly build custom visualizations and gain insights on user behavior that can help you optimize your product experience.
Get started for free and put your data to work.
You might also be interested in these;
Product Adoption Dashboard Examples & Key Metrics to Track
How To Measure Product Adoption (Metrics & Tools)
AUTHOR
Tope Longe
Product Analytics Expert
Ardent technophile exploring the world of mobile app product management at UXCam.


Related articles


Product best practices
12 Apps with Great User Onboarding (2026 Examples)
The 12 mobile app onboarding flows I'd study if I were designing one today, with specific callouts for what each does well, common mistakes, and the...


Silvanus Alt, PhD
Founder & CEO | UXCam


Product best practices
Why creating a data-driven culture has less to do with data than you think
Kishan Gupta, CEO, shares 5 tips and techniques for fostering a data-driven culture based on his own experiences building and leading...


Kishan Gupta
Co-Founder of UXCam


Product best practices
Finance apps have a customer support problem, here's how to fix it
Learn about the customer support problem in finance apps and practical solutions to fix it in our latest blog post, and improve user satisfaction and...


Jane Leung
Product Analytics Expert