Product Adoption Dashboard Examples & Key Metrics to Track


Product adoption dashboards visually represent data that’s useful to assess the performance of a product. They can help you identify specific areas of improvement and better understand customer behavior.
Poorly designed and configured dashboards will limit their effectiveness. To help you avoid this, UXCam is here with an in-depth guide to creating effective product adoption dashboards.
Let’s get started.
What is a product adoption dashboard?
A product adoption dashboard is a visual representation of relevant metrics that provide insight into user engagement with a product. They give teams an aggregated view of relevant user activity, along with more in-depth insights on customer behavior, usage trends, feature adoption rates, retention numbers, etc.
Here’s a product analytics dashboard from UXCam to give you an example:


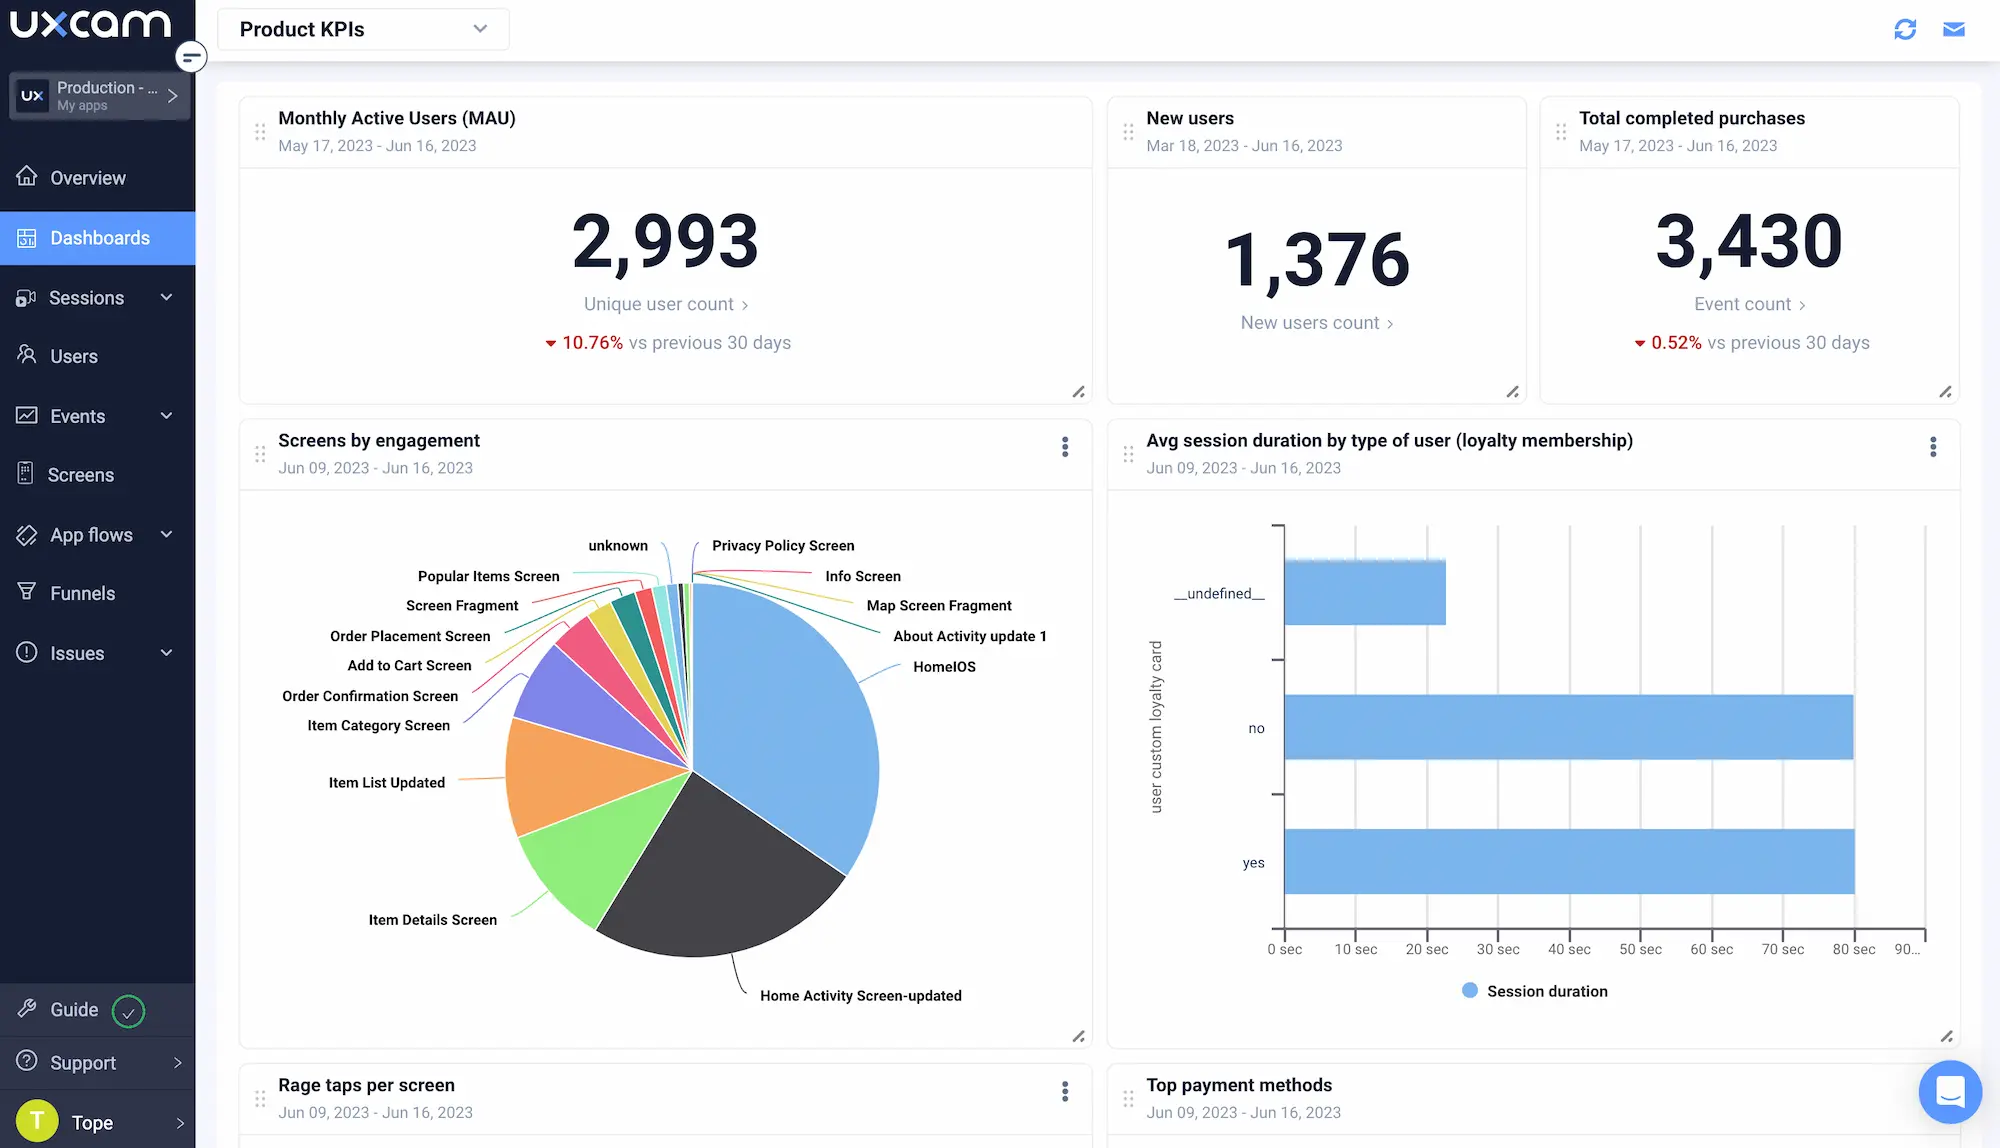
The blocks on the screen each represent a product adoption data point that the team behind the dashboard finds relevant. Up at the top, you have metrics—MAU, new users, and total completed purchases. Below that, you have charts covering different topics—like top-performing screens and usage trends.
Every UXCam dashboard is customizable, so you can add and remove blocks of metrics and charts to fit your team’s needs. The data is also highly interactive, so you can drill down into individual sessions to get a more profound understanding of user behavior.
Benefits of a product usage dashboard
User insights
A product adoption dashboard highlights how your customers are using your app. Teams can monitor adoption with quick access to visual overviews of a range of in-app data.
For example, UXCam allows you to build dashboards featuring the following:
Usage data
Session data
Funnels and dropoffs
All the data you include can be segmented for even more in-depth insights.
Easy performance tracking
Dashboards make it easier to stay on track with product adoption progress by making it more convenient to focus on KPIs. Teams benefit most from dashboards when information is uncluttered, and concise, and enables immediate access to metrics and KPIs.
Supports decision-making
Product adoption dashboards support important business questions like:
How effective is our adoption strategy?
What do we need to do next?
This is where the real-time data it provides is useful to make decisions regarding feature redesigns, new features, and the next steps for more adoption and customer retention.
Saves time and improves productivity
Dashboards help boost productivity by streamlining data analysis, so teams save time manually interpreting data, finding trends, etc. Data can be manipulated to answer questions faster.
They update automatically with a consolidated overview of key metrics and actionable insights. Therefore, teams spend less time maintaining them and more time carrying out more in-depth data analysis.
How to implement a product adoption dashboard
Step 1 - Choose your dashboard tool
The “dashboard tool” you use will more often than not be the platform or software you use to collect product adoption data. Most analytics tools offer some kind of dashboard feature that will let you create (or at least generate) product adoption dashboards.
For example, take UXCam.


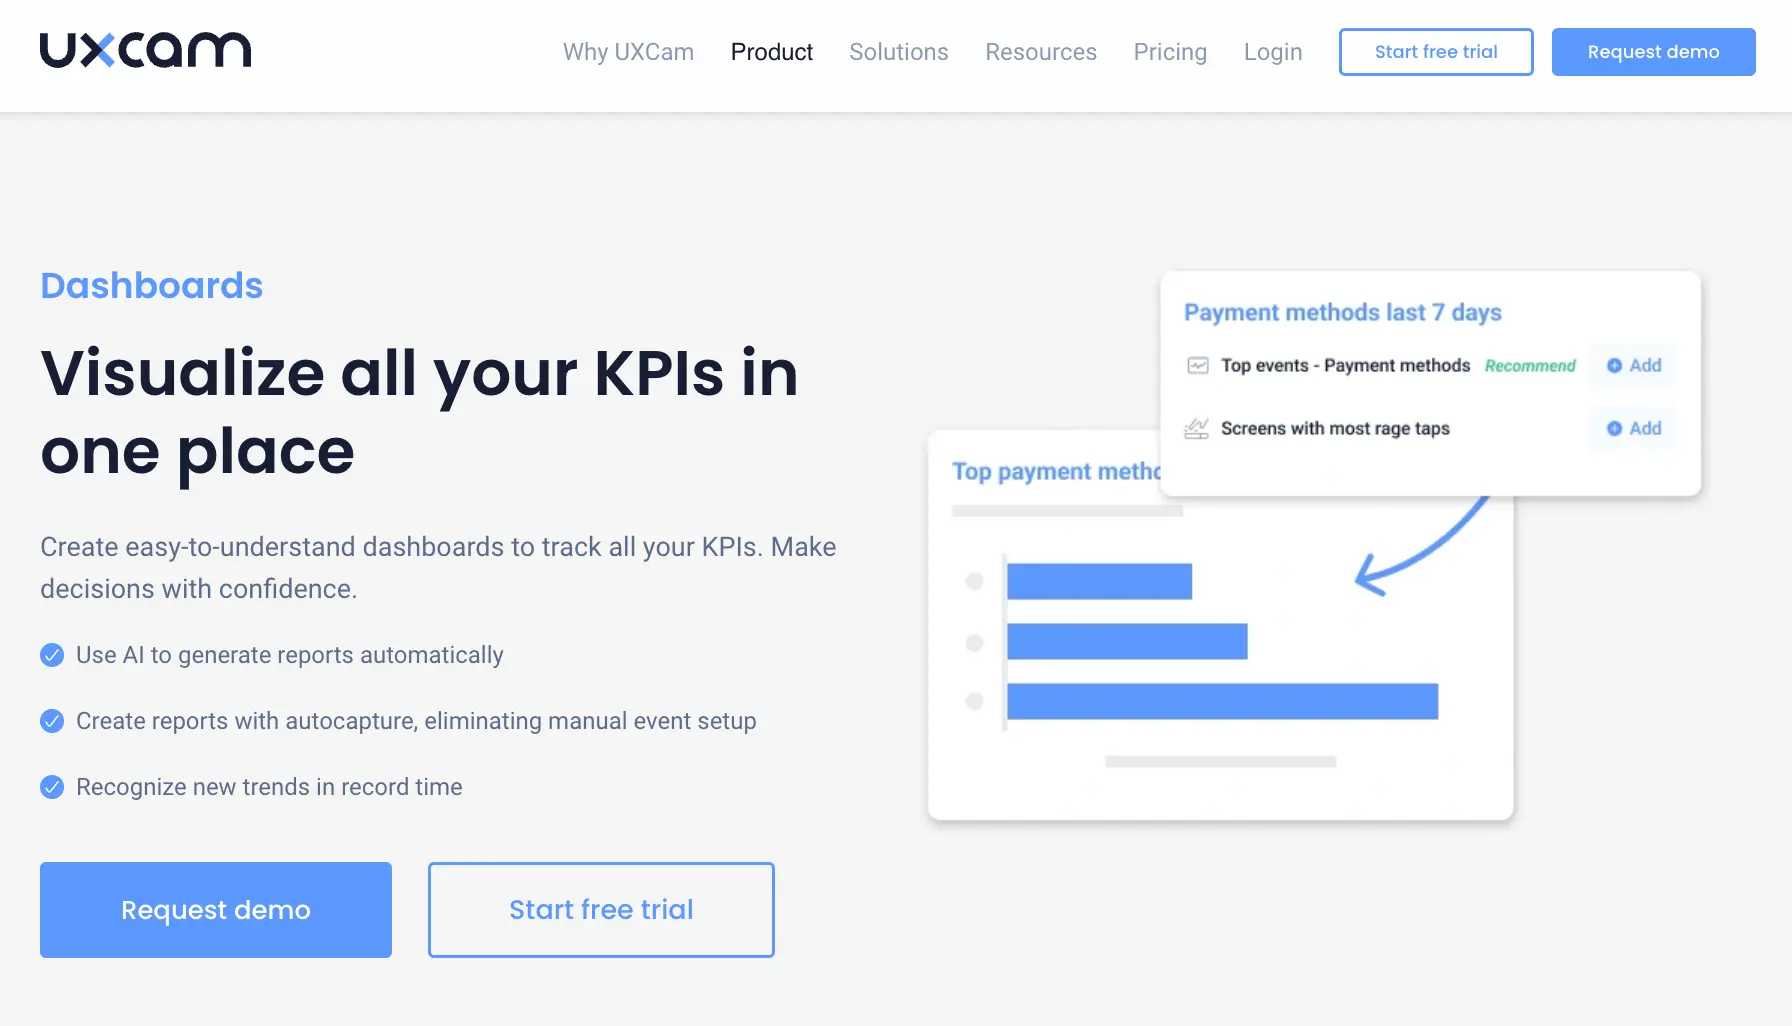
We give mobile product teams the ability to create and customize product adoption dashboards using a range of pre-built and custom reports. Our dashboards are also modular—you can move elements around, resize them, and tailor the layout of your dashboard to match your team’s needs.


Step 2 - Decide on a product adoption goal (and objectives)
Why are you creating a product adoption dashboard in the first place? This is an important question that will largely determine what metrics, reports, charts, and data need to be included.
When you’re setting a goal, think about the bigger picture from the perspective of your organization. For example, maybe your overarching product adoption goal is to win more paying users so that you have the revenue to support your company’s growth.
Next, set a few objectives—actions that you can take to help achieve your goal. For instance, if you want to increase paying users, possible objectives might include:
Figuring out which features drive upgrades
Identifying and fixing conversion roadblocks
Gaining insights into product usage trends
…and so on.
Step 3 - Identify KPIs and metrics
Once you have a goal and objectives, you can match them with the metrics that feed into them. Think logically—what metrics would give you an indication that your goal and objectives are being met?
KPIs and metrics relevant to the above example could include:
Conversion rate
DAU, WAU, and MAU
Average session length
Feature usage frequency
Usually, it’s fairly straightforward to identify a few key KPIs to measure. However, it’s important to identify the right ones. If you miss out on a key metric, your progress towards the goal won’t be accurately reflected in the data.
Take a look at our guide to product adoption metrics and KPIs for more guidance.
Step 4 - Collect data
Now it’s time to start collecting data. Install your analytics tool and start gathering data immediately.
Don’t wait until the perfect setup is ready—start collecting data right away, and then you can refine it as needed. Analytics tools like UXCam use tagless autocapture to automatically track everything that happens in your app, so you’ll retroactively be able to define what’s important and capture relevant data from the beginning.
Step 5 - Design and build the dashboard
Now, it’s time to put everything together.
Start by deciding on the best ways to visualize specific data points (with the goal being easy, at-a-glance insights). Some of the most common charts suitable for dashboards are as follows:
Line charts—ideal for showing change patterns over a period.
Pie charts—ideal for quick scanning and if you need to highlight considerable differences in data, as the bigger slices are noticed first.
Bar charts—ideal for spotting patterns by comparing several items.
Scatter plots—ideal for highlighting the correlation between two variables.
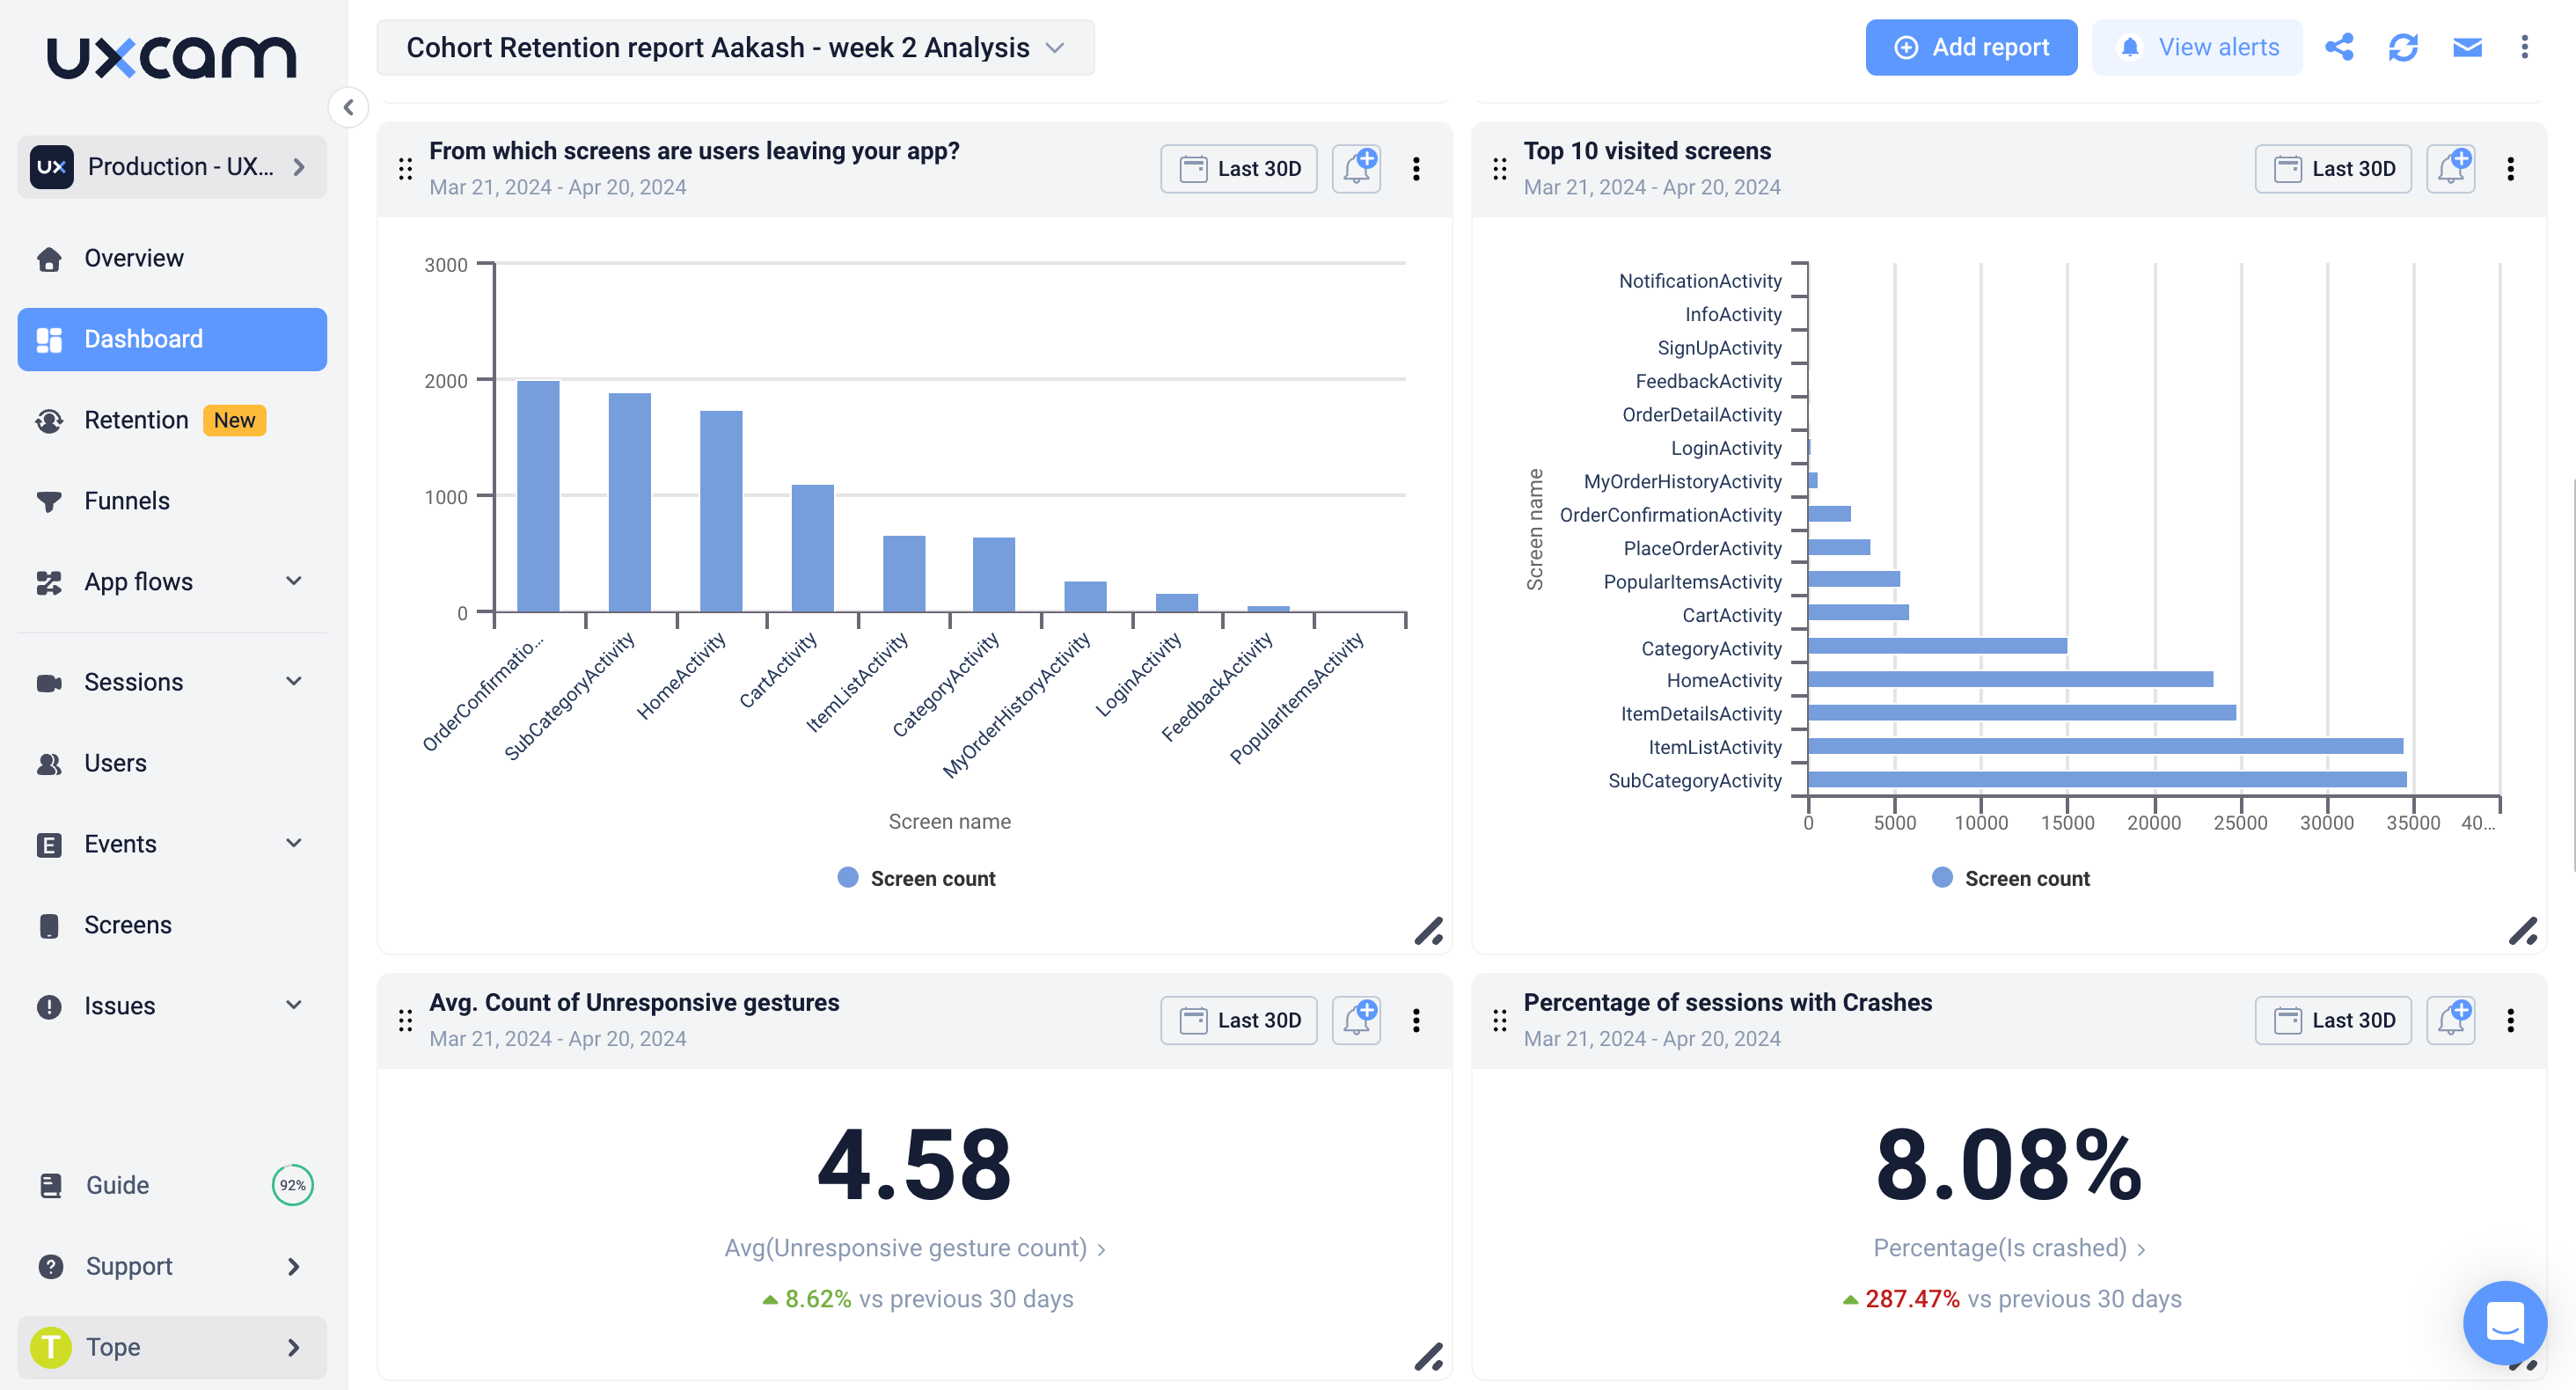
Modular dashboard tools like UXCam allow you to resize and move elements to reflect what your team finds important. We have a massive library of pre-programmed reports (i.e., visual representations of your data) and a drag-and-drop interface to customize elements.
You’re free to segment specific reports or entire dashboards to zoom in on interesting user groups.


Get insight into product adoption with UXCam
Product adoption dashboards are ideal for tracking adoption and having quick access to a real-time overview of what’s happening on your platform at any time.
UXCam delivers the data you need for a solid product adoption strategy. Over 37,000 mobile app brands trust us for precise behavioral analytics that lead their product teams to deep, rewarding insights into their users’ behavior.
Sign up for a free trial today to implement your product adoption dashboard, or request a demo to learn how else we support mobile app product teams.
You might also be interested in these;
How to analyze session recordings
Stages of the product adoption process - An indepth guide
How to measure product adoption (metrics, formulas & tools)
5 Best product adoption software tools to build stickier apps
AUTHOR
Tope Longe
Product Analytics Expert
Ardent technophile exploring the world of mobile app product management at UXCam.


Related articles


Product best practices
12 Apps with Great User Onboarding (2026 Examples)
The 12 mobile app onboarding flows I'd study if I were designing one today, with specific callouts for what each does well, common mistakes, and the...


Silvanus Alt, PhD
Founder & CEO | UXCam


Product best practices
Why creating a data-driven culture has less to do with data than you think
Kishan Gupta, CEO, shares 5 tips and techniques for fostering a data-driven culture based on his own experiences building and leading...


Kishan Gupta
Co-Founder of UXCam


Product best practices
Finance apps have a customer support problem, here's how to fix it
Learn about the customer support problem in finance apps and practical solutions to fix it in our latest blog post, and improve user satisfaction and...


Jane Leung
Product Analytics Expert