8 KPIs CPOs should measure to improve app performance

Every chief product officer (CPO) should have one eye on the needs of the customer and another on the business goals.
While CPOs and PMs track some of the same KPIs, there is a difference. The CPO shouldn’t only be focused on KPIs that reflect the product, for example, engagement, retention, or conversion rates, but also business KPIs that contribute to revenue and growth. In this article we’ll look at 7 KPIs a chief product officer should measure to improve the overall app performance.
One of the biggest differences between a CPO and a regular product manager is that a PM is much more focused on their areas of specific areas of the app to improve, which might just be one feature of the app, or even an element within a feature. Whereas a CPO is concerned about the app's performance overall and focuses on how the product team can contribute to improving business performance.
The responsibilities of a product leader can vary depending on the company and industry. Still, there are some general duties that most product leaders have:
Defining the product vision
Creating and executing a product-led strategy
Gathering and analyzing user behavior data
Managing the product team
Average revenue per user (ARPU)
This metric is useful for determining if the current monetization strategies are working as intended. ARPU helps CPOs analyze growth patterns and compare their success to competitors.
ARPU can be calculated by dividing the total revenue generated during a specific time period by the total number of active users over the same time period.


Formula to calculate ARPU
Measuring active users
To properly calculate ARPU you need to know your monthly active users (MAU) which can be tracked easily in UXCam’s dashboards.


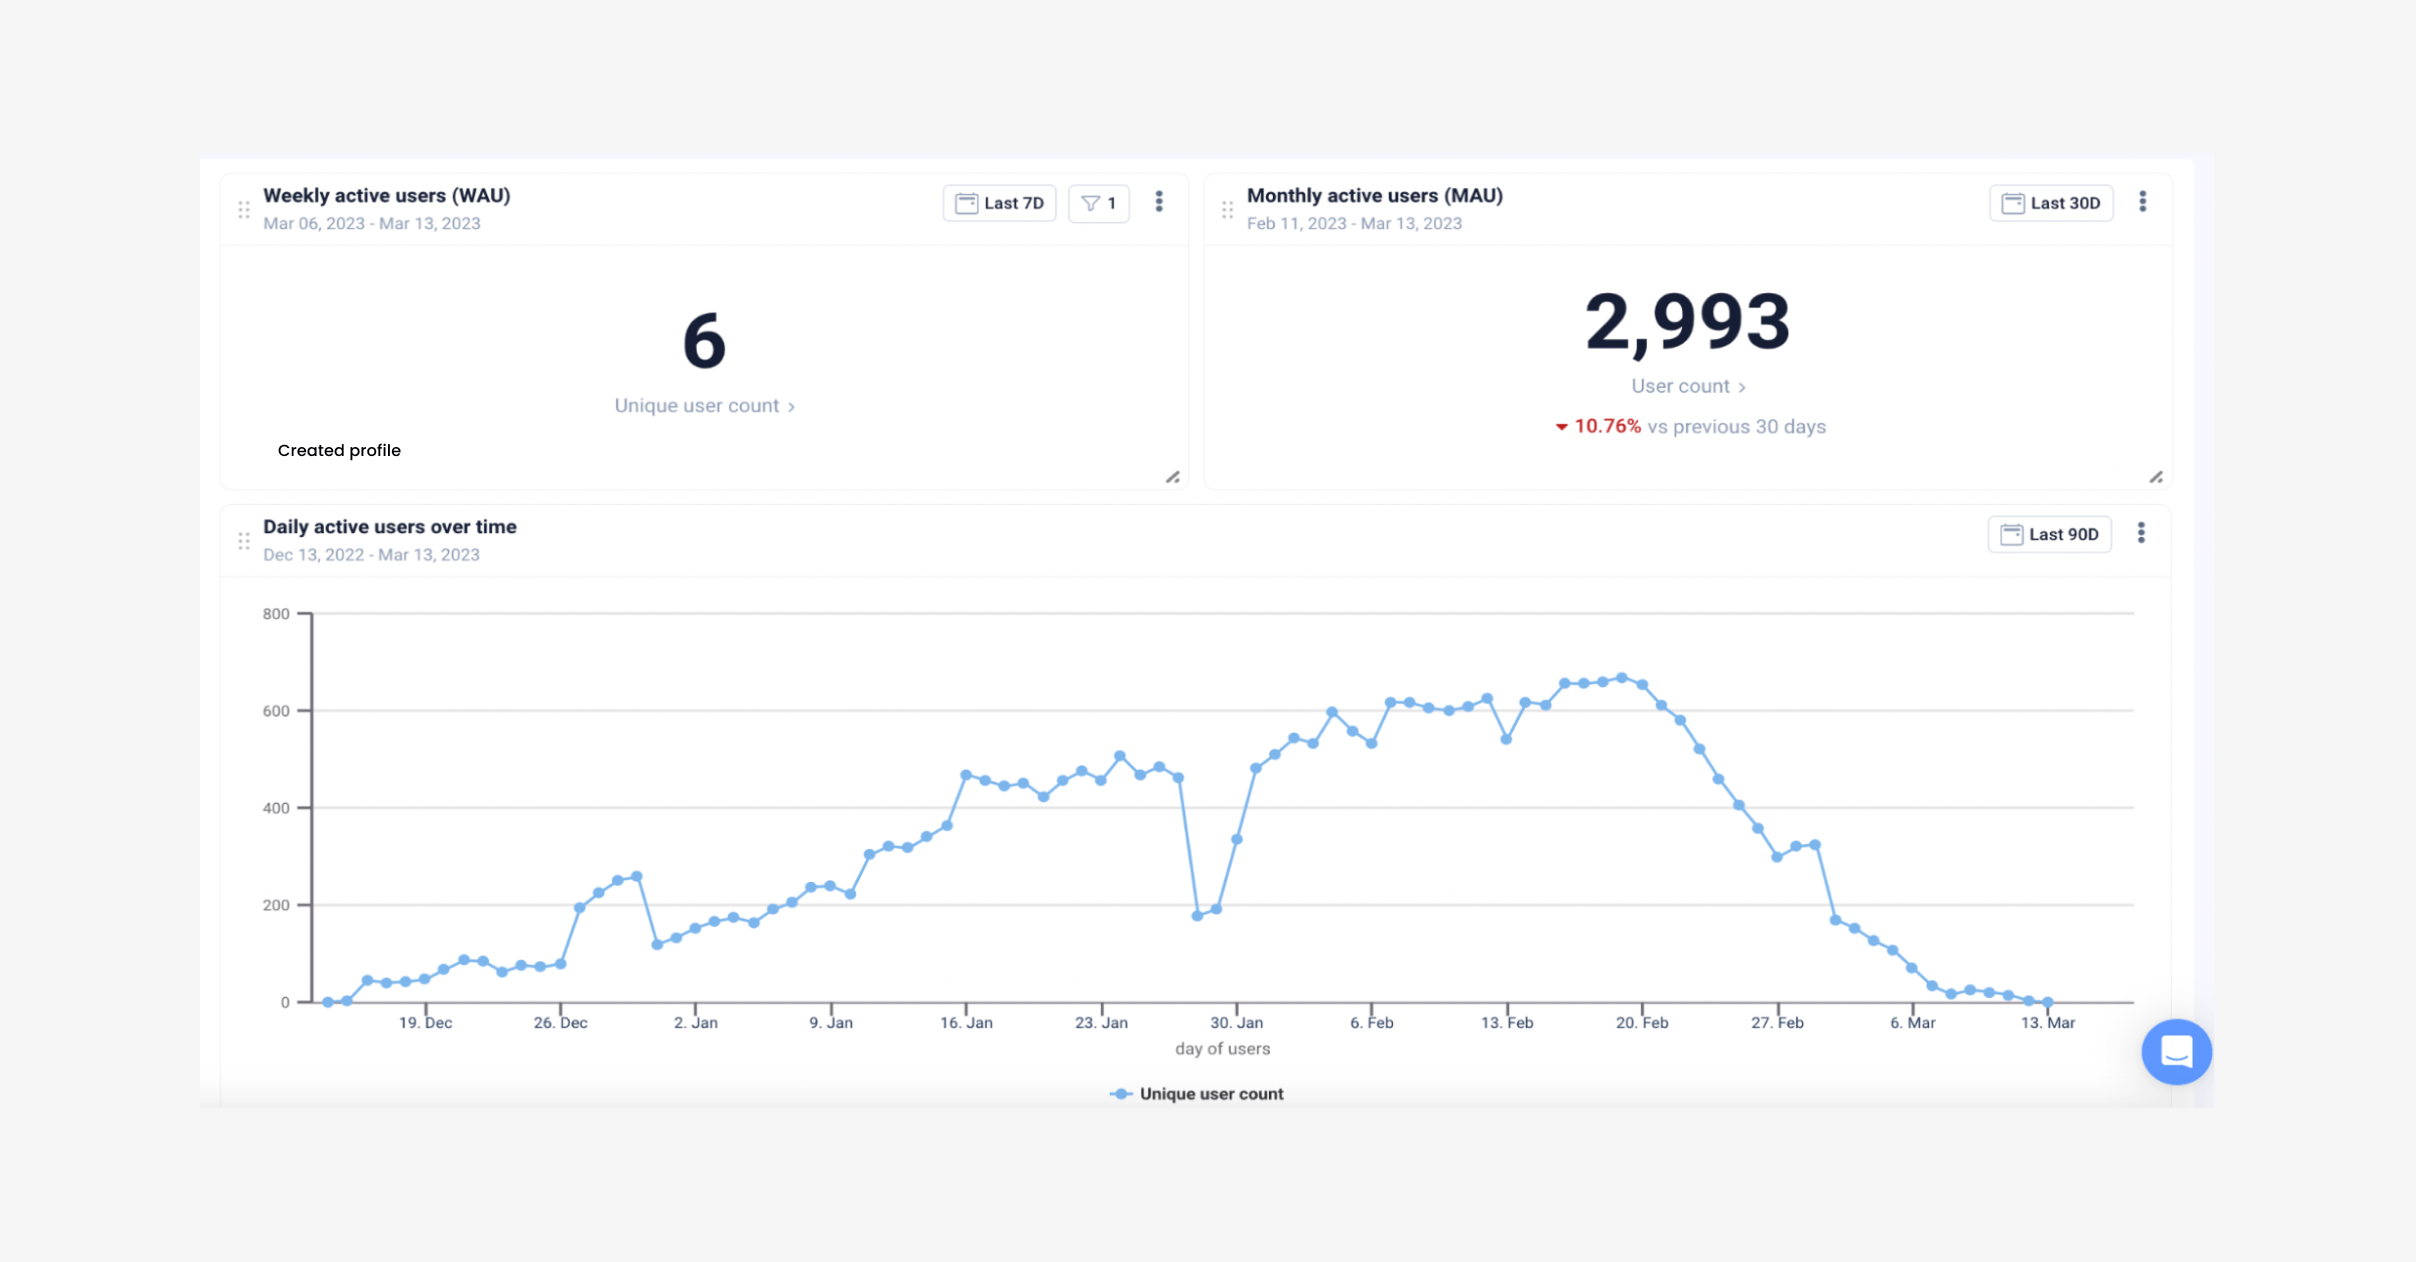
Easily track your daily and monthly active users with UXCam
For an overview of performance KPIs, take a look at our article How to measure mobile app performance
Cost per install (CPI)
Cost per install (CPI) is the price paid by the app developer to the advertiser for every user that installs the app as a direct result of the advertising. You may already be familiar with cost per click (CPC) which is used to measure the price paid for every user who clicks on the ad, but doesn’t necessarily install the app.
CPC is mostly used as a measure for website traffic, whereas CPI is a metric specifically for mobile apps.
To calculate CPI divide the total ad spend over a specified period by the number of new installs from that same period.


Formula for calculating cost per install
CPOs working on fintech apps understand that users generally leave their money in a digital space for a long period of time. It’s unlikely that a user will open up a bank account to close it a month or so later.
As a result, finance apps should be flexible with a higher CPI.
Measuring the number of new installs
To arrive at your CPI amount you need to know how many new installs happened over a certain period of time.
Decide which action to track to determine a new user. When signing up to a digital banking app, or a similar fintech app, users have to go through the know your customer (KYC) process. Once a user has completed this process, we can count them as a successful sign up.
Set up a custom event as ‘ID successfully verified’ to track the number of new users that have finished the KYC process.
Now you can set up a user report in dashboards, with the total count of users that have triggered the event ‘ID successfully verified’ over the past 30 days.


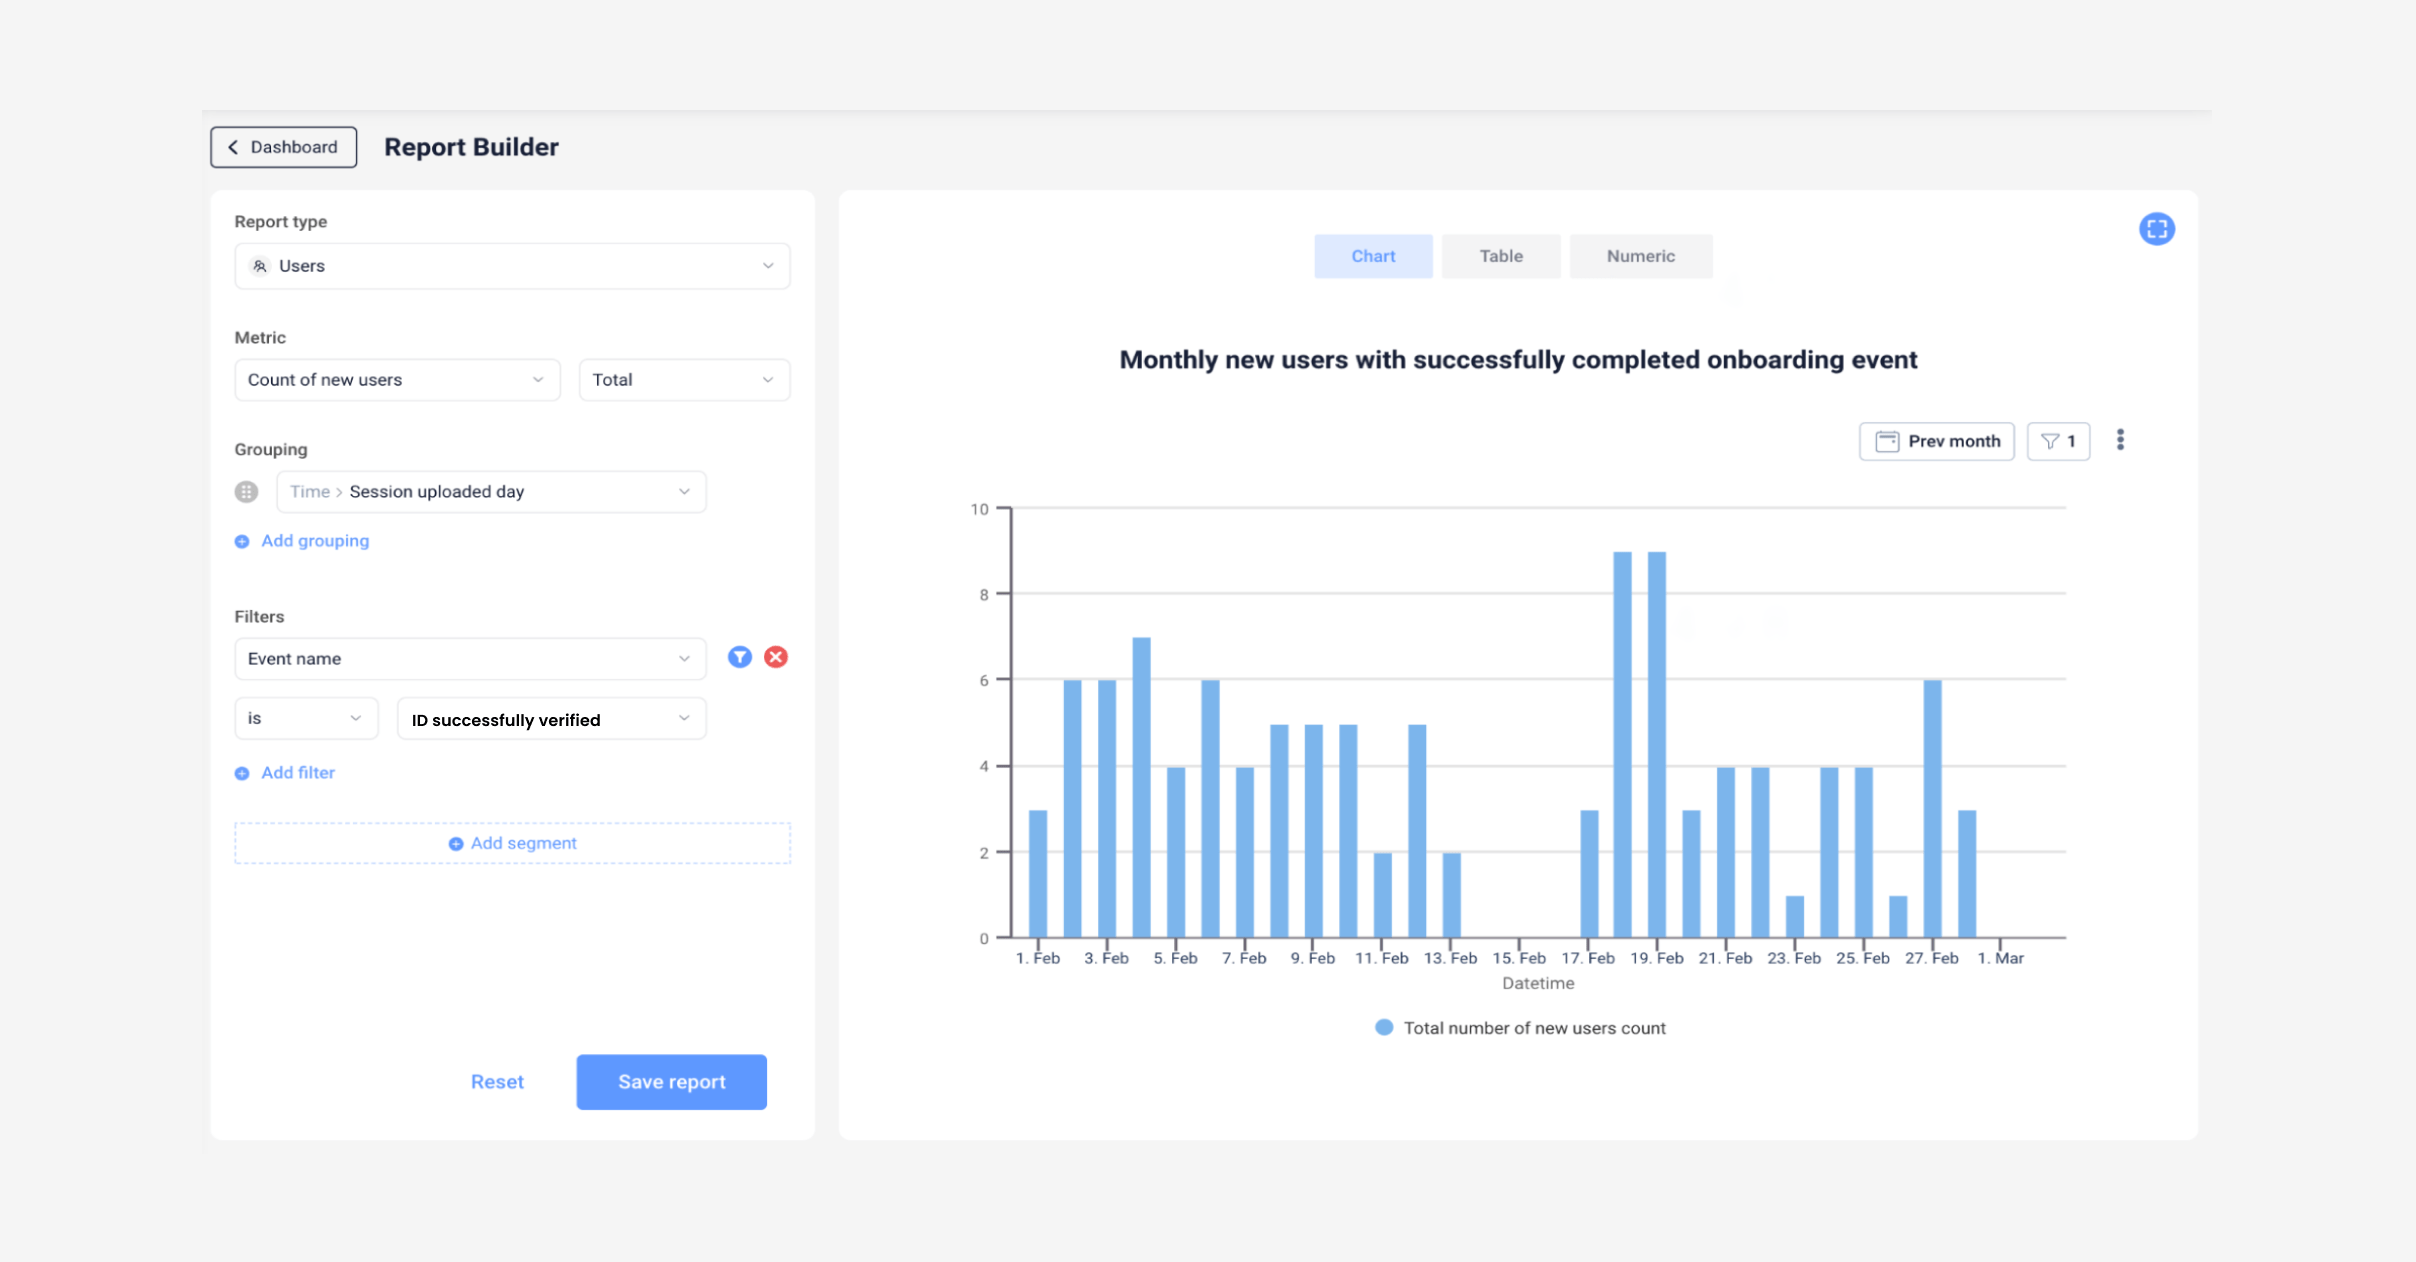
Example of a new user report in UXCam
If you’re looking to improve your KYC process specifically, you can read our dedicated article on reducing KYC abandonment in 3 steps
User retention rate (URR)
This metric measures the percentage of users retained over a specific time period. Retention is expressed as a percentage of users that remain loyal to an app over a specific time frame.
Measuring this KPI is valuable to product leaders as they can see whether loyal users are increasing or decreasing over time.
Learning to calculate customer retention rate is pretty easy to do once you know the formula.


Formula to calculate user retention rate
Segmenting users
Measuring loyal users isn’t the only user set interesting to measure for product leads. UXCam automatically segments your users into sets of:
Loyal users - automatically set in UXCam as users who have returned to the app more than 20 times in the past 6 months. This metric can be adjusted.
New users
Returning users
Users slipping away


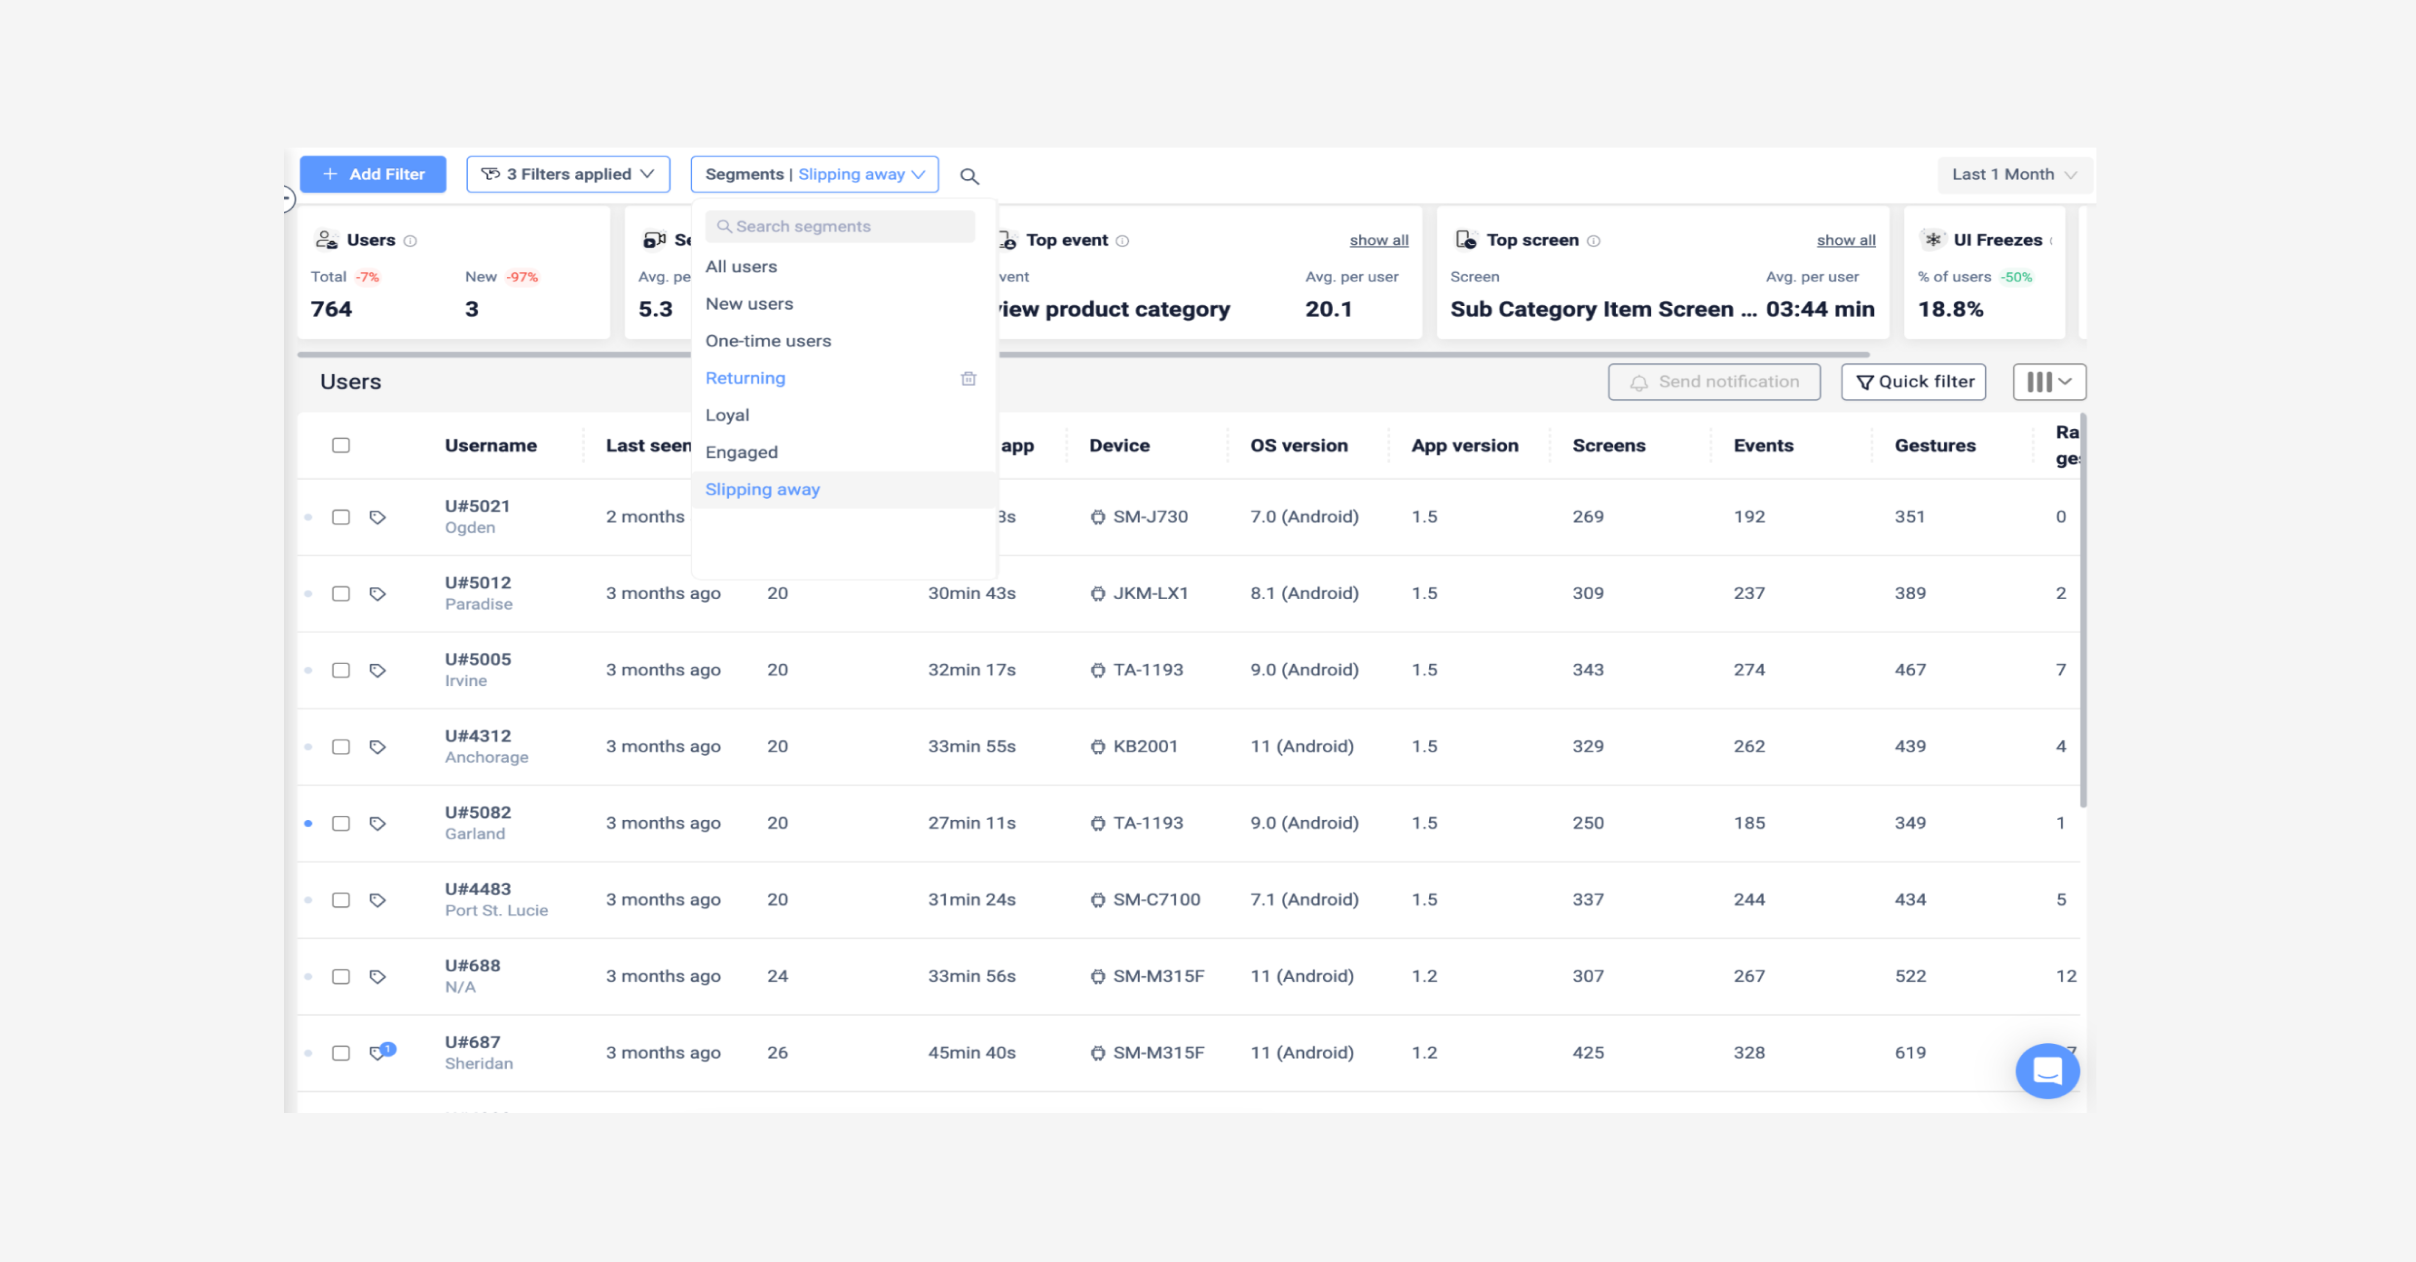
User group filter in UXCam
With this data insight, product leads can strategize techniques for specific user sets. For example, you could attempt to re-engage users slipping away by sending push notifications reminding them of actions that can increase their engagement such as a stock price drop alert or reminding them whether they hit their monthly savings goal.
For a more detailed look at reengaging users take a look through our low-effort high-effort mobile app improvements specifically for fintech.
Adoption rates
This metric is one that the entire product team should be measuring for each feature release that they own or implement. However, it’s especially important to have an overview as the chief product officer of each feature adoption to help prioritize feature releases or improvements.
It’s simple. The more value users gain from your features, the more likely they are to stay with your app.
Measuring feature adoption rates is crucial for fintech companies that need to continually improve their product offerings to stay ahead of the competition. It allows teams to evaluate how well individual features resonate with users.
By analyzing user behavior, mobile app companies can gain insights into how their users are interacting with different features and what they are using them for. This information can be used to make data-driven decisions about which features to prioritize, how to improve them, and where to invest resources.
To measure the feature adoption rate, divide the number of monthly active users of the given feature by the total number of user logins over a specific time frame, and multiply the ratio by 100 to get a percentage.


Formula for calculating feature adoption rates
How to track feature adoption rate
While UXCam automatically tags some data like screens, gestures, and crashes, you’ll need to set up custom events to measure more specific user actions. For example, if you want to measure the adoption rate of a savings space you can set up an event called ‘successfully created space’ to measure how many users have hit the ‘create savings space’ button.
Learn more about event analytics.


Parameters used to measure feature option
In the example report above, you can see a custom event has been created called ‘created savings space’ which measures all the users that successfully went through the savings set up process and hit ‘create new space’. In the graph on the right you can see this trend over time.
If you need ideas for mapping out your events and configuring them, take a look at our help center article.
Session duration
Session duration measures the average amount of time users spend per session on your app. It’s calculated by dividing total time spent across sessions by the total number of sessions.
High session times don’t always mean high engagement. It’s important to look into session replay with longer durations to make sure the users aren’t getting stuck at any area of your app.
It’s important for the CPO to understand whether the app's purpose is to keep users engaged in the app for as long as possible, or to encourage them to return as much as possible. For banking apps lower session duration might actually mean that users are completing what they need to in your app fast, meaning a strong user experience.
Measuring session duration
Average session duration can be calculated in a few clicks with UXCam.
Open up the Dashboards tab on UXCam
Go to “add report”
Type in ‘average session time’ and hit ‘add’
Once it’s added, go to ‘edit report’ to customize your desired parameters.
To get more granular, you can add more filters to measure the average session duration for:
Device properties: App version, device model, OS version
Session properties: Count of events, network type, session length (for sessions above or below certain minutes)
User properties: Country, first seen, last seen, custom properties
UX issues: Sessions with rage taps, UI freezes, or crashed sessions
You can also filter by user segments to see how session duration differs for first time or loyal users.


Example of parameters for average session duration filtering for app version and user segment
Even in the case that users are able to do what they need to in the app quickly, it’s still essential to know how session duration might change over time to analyze crashes that might occur. Session duration will also differ depending on the user's device or app / iOS version.
Find more about session replay here.
Crash rates
A crash is an action that causes an app to stop functioning for any amount of time, even a moment.
This metric is important for CPOs to track as they are usually working cross-functionally between the product team and the development team. Knowing crash rates can indicate more serious issues that can be investigated together.
To measure crash rates, divide the number of crashes by the number of active users over that period and multiply by 100 to get a percentage.


Formula for crash rate
Measuring crashes and UI issues
In UXCam, it’s easier to see crashes and UI issues than working out a formula every time. Navigate to ‘issues - crashes’. This dashboard gives insight into:
The percentage of sessions without crashes
The specific number of crashes that happened over a certain time period
How many users the crashes effected
From this dashboard you can see the trends of crashes and issues over time, and the reason for each crash type. You can then click through each crash reason for a more detailed view of each session with that issue occurrence.


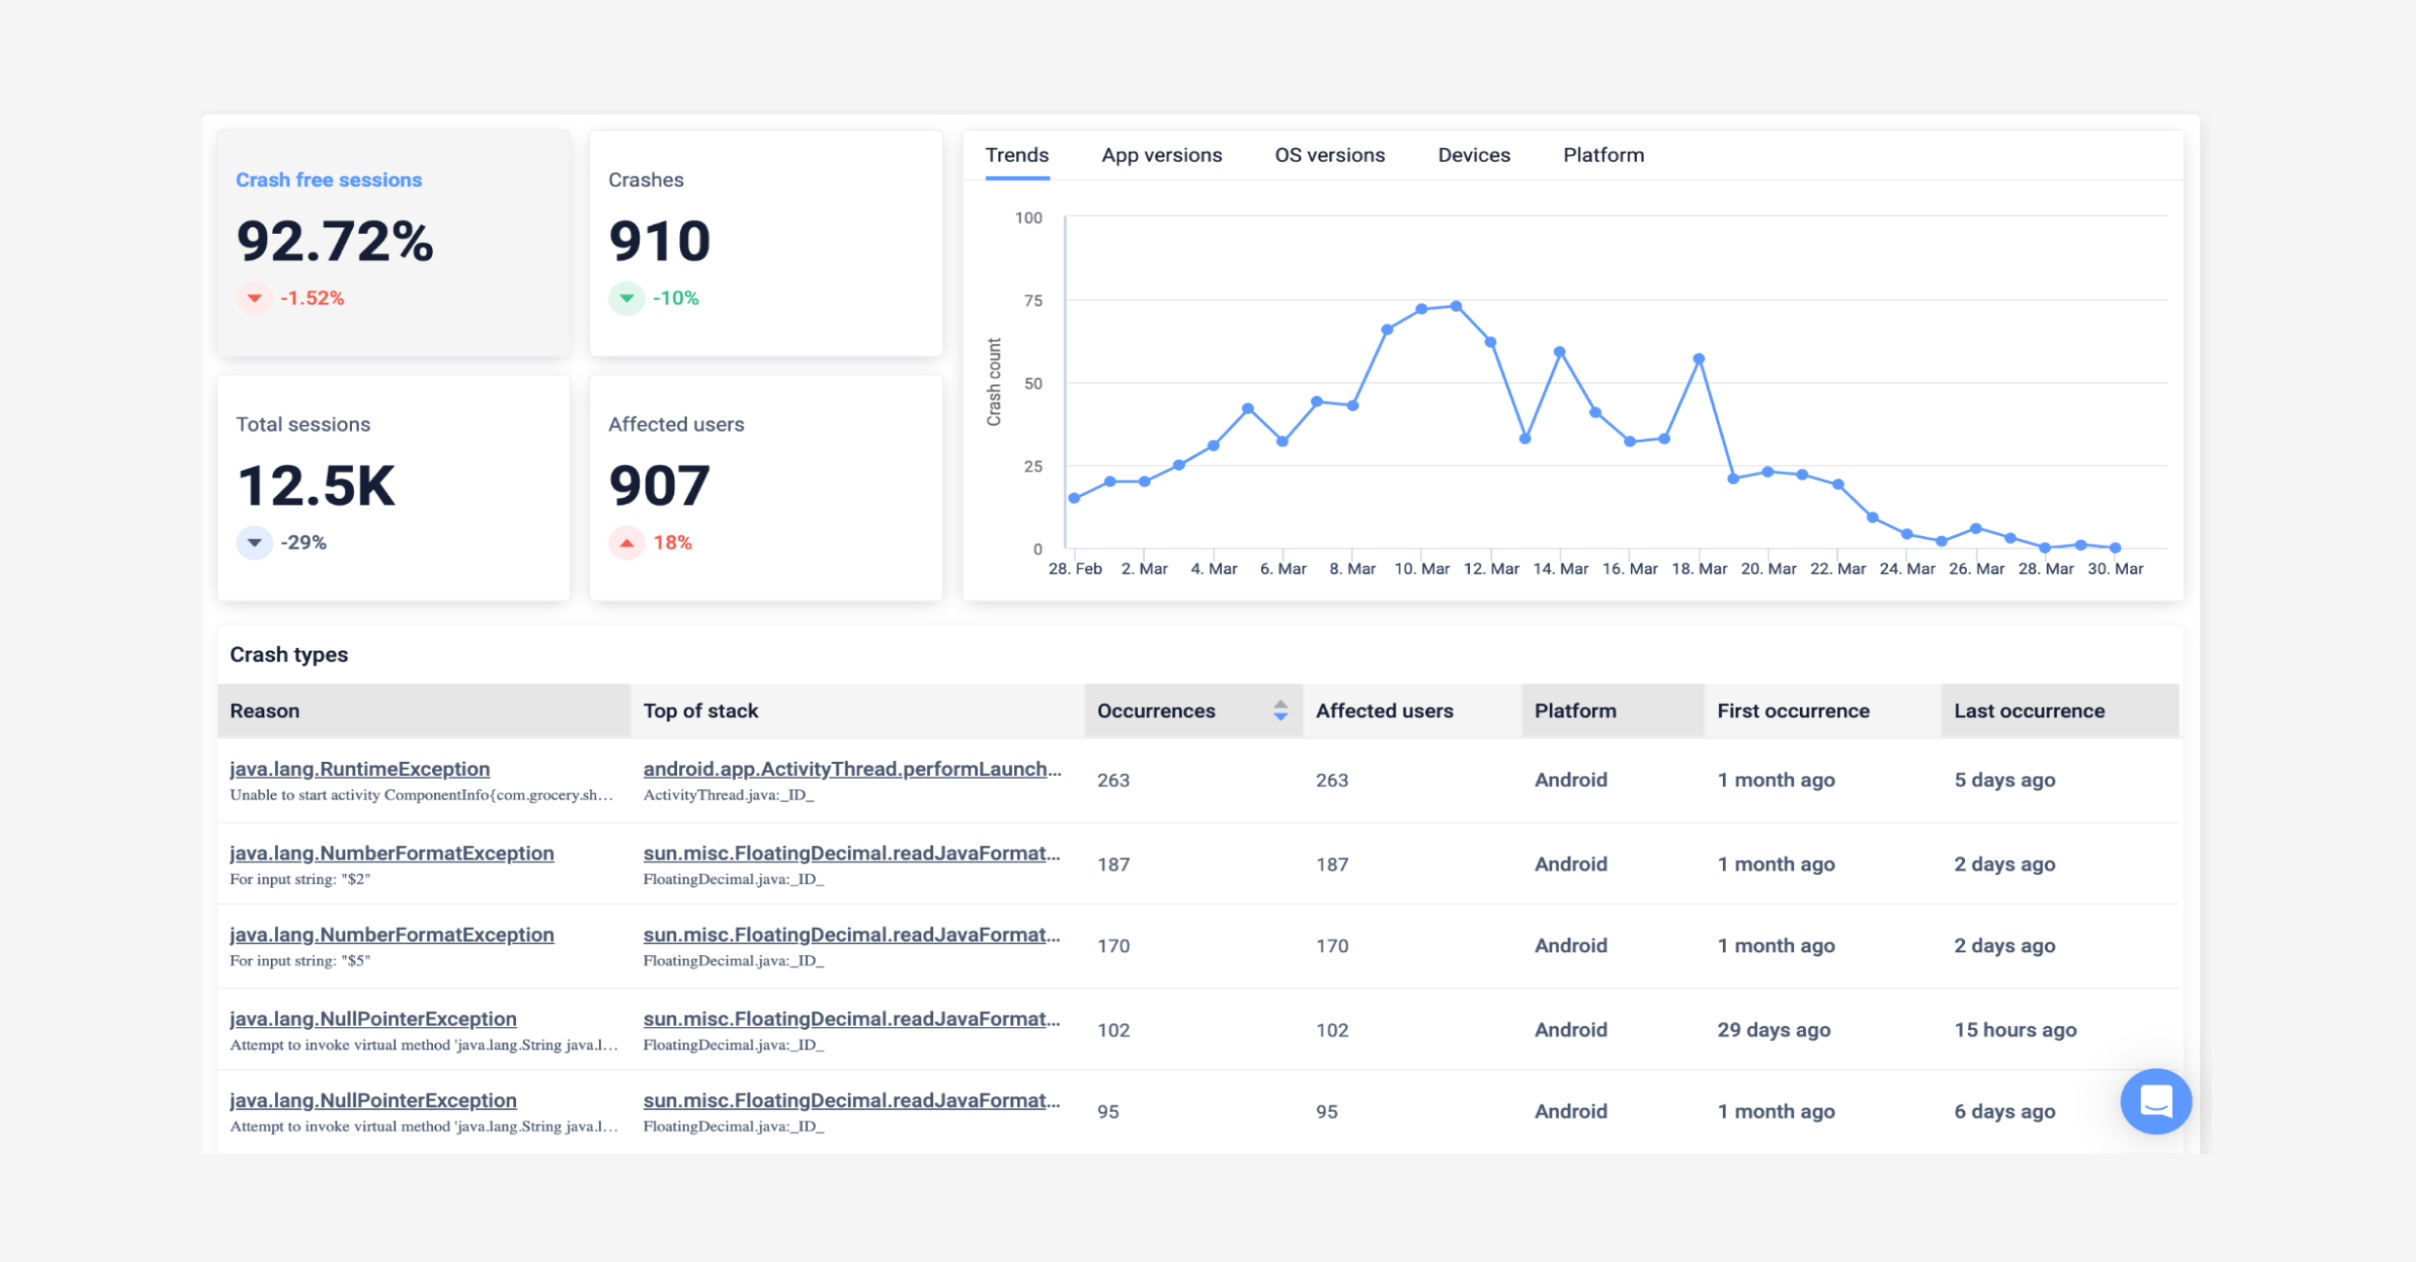
Example of Issues - Crashes in UXCam
This allows developers to see what users were doing just before the crash occurred for a faster time-to-solve. Add a crash report to your dashboard to keep an eye on screens with the most crashes, crash rate per device type or per app version.
Customer success teams can also use sessions in this way to communicate more effectively to users.
If you would like to know more about how incorporating a mobile app analytics platform can support your CS team, read our dedicated article Finance apps have a customer support problem, here’s how to fix it.
User churn rates
Churn can be measured by the number of users who dropped off and have not returned to the app, or by amount of churned revenue from those users that dropped off.
To determine the percentage of revenue that has churned, take all your monthly recurring revenue (MRR) at the beginning of the month and divide it by the monthly recurring revenue you lost that month.
Measuring user churn rates
This is calculated by dividing the number of users who stopped engaging with your app over a specified time period by the average total number of users over that same time period.


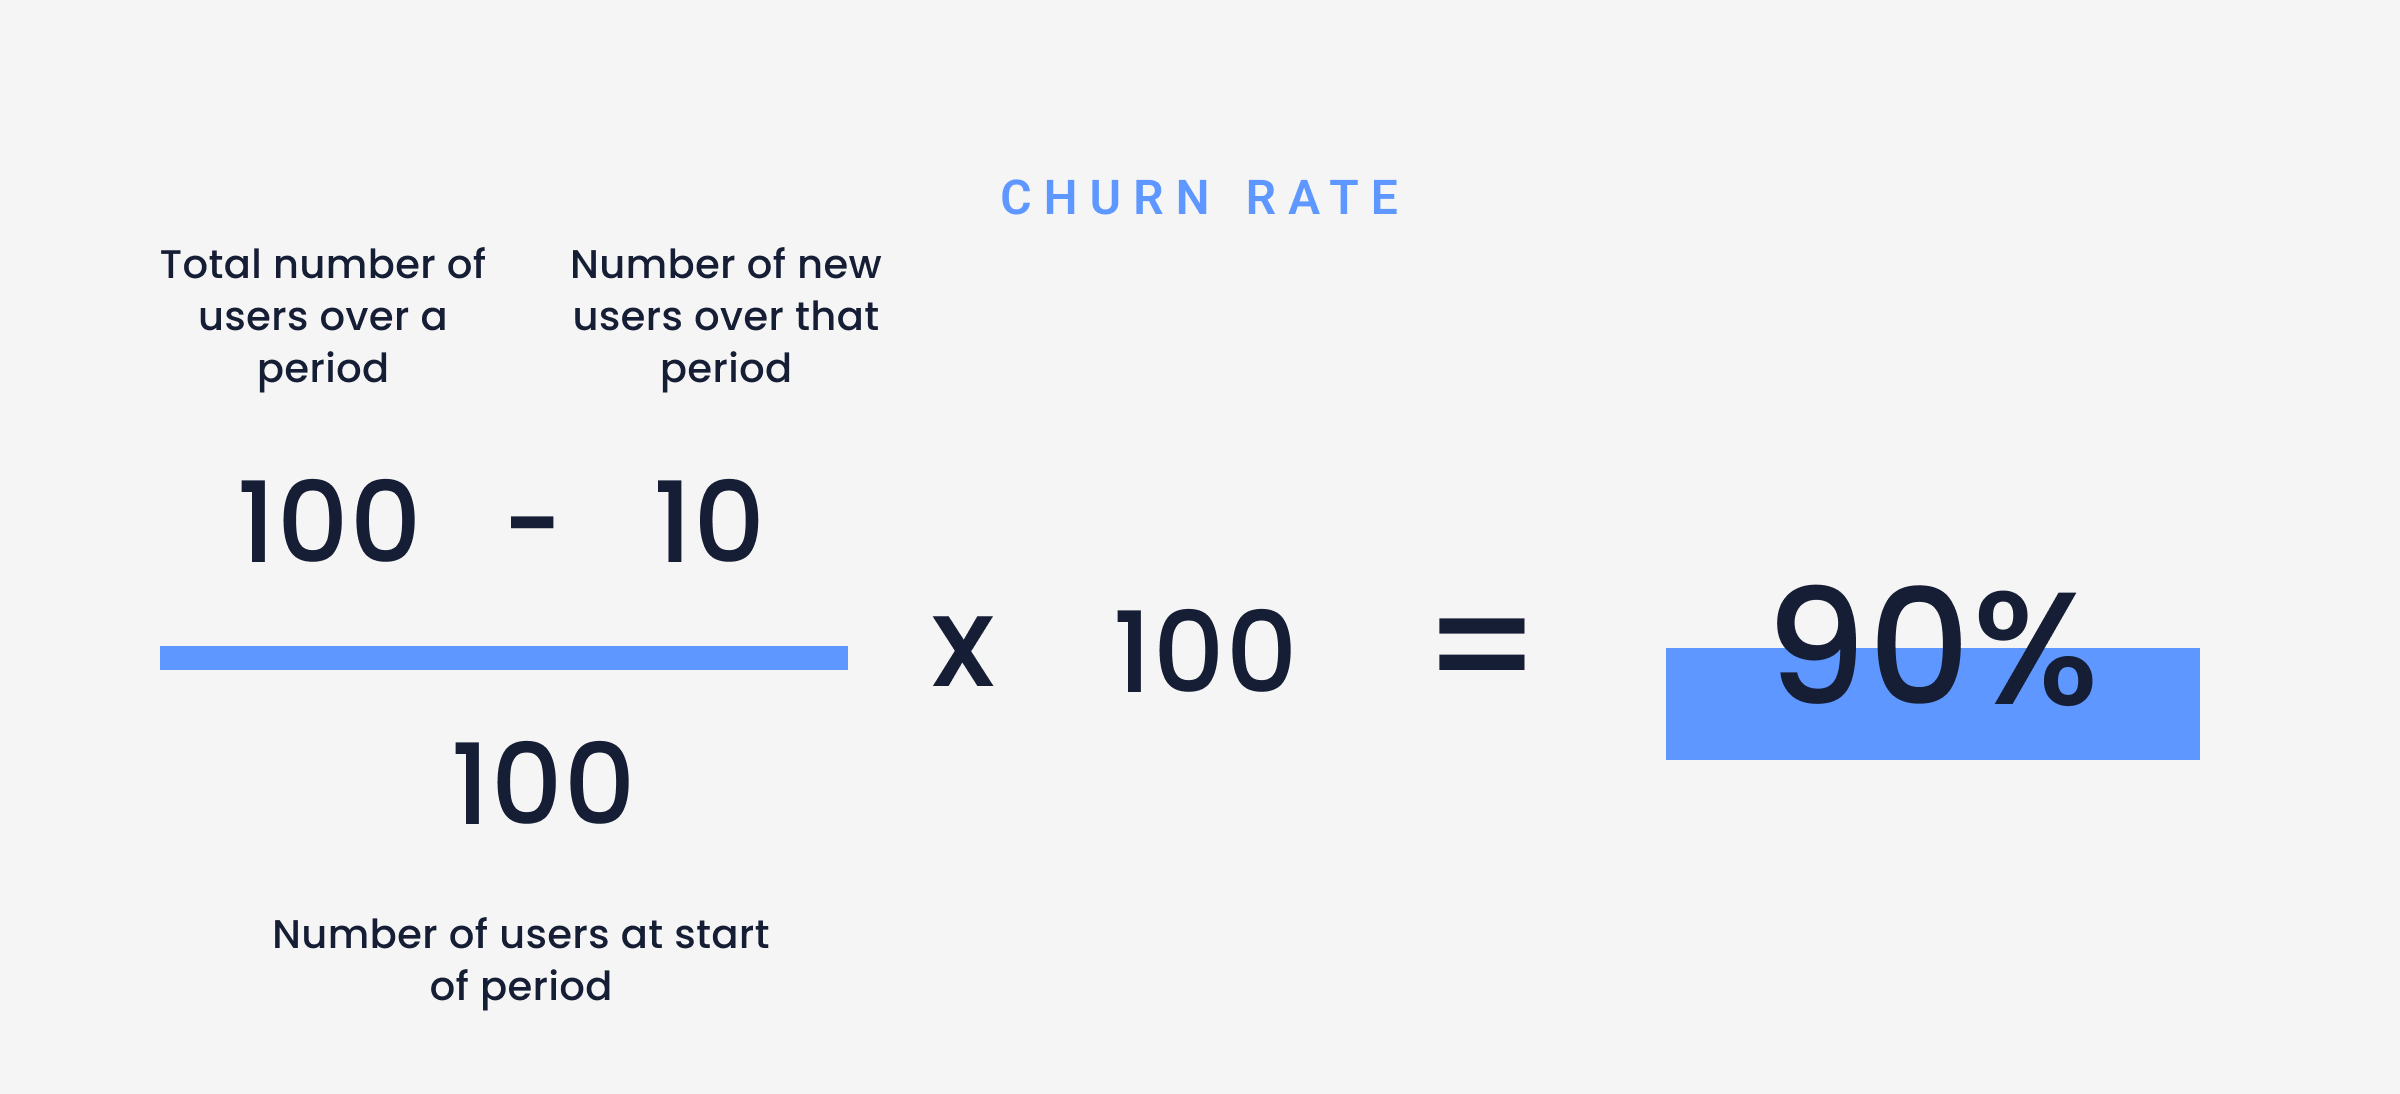
Formula for calculating user churn rates
We suggest monitoring churn monthly to set your average churn rate, identify behavior trends, and understand why and when users are leaving. Leverage this data to test different app improvements to prevent further churn.
There are a few ways you can look into churn rates with UXCam. One way is to set up a user report and add a user property filter for ‘last seen’ before a certain date.


Example of measuring user churn in UXCam
Now you can see the sessions for each user that hasn’t returned to your app, and analyze their behaviors through heatmaps and session replays before they made the decision to churn, giving agile teams the power to hypothesize the reasons why, strategize potential solutions and then test those hypotheses with different user sets.
App stickiness
Stickiness measures how often users are returning to an app because they feel it’s valuable and engaging. Users who find an app sticky will use it routinely in their daily lives.
App stickiness can drive growth by improving user retention and CLTV, and acts as a feedback loop that measures user value, and therefore business value.
This metric is critical to track to know whether your app is creating value. However, keep in mind that some apps, like those in the finance industry, are more likely to have low-frequency usage because users don’t need to login to their bank account every day so your stickiness rate might not give the entire picture.
For financial services apps to get a better idea of their stickiness rates it’s essential to also measure metrics like retention rate and churn to compare your stickiness rate to and get a clearer picture.
For example, if your app has a stickiness rate of only 20%, but your user retention rate is high, and your churn rate is low, you can assume your app is creating value when your users really need it. App stickiness is measured by dividing the number of daily active users by the number of monthly active users.


Formula for stickiness
If you’d like to work specifically on your app stickiness read Building a sticky app: Features that sell themselves.
Measuring app stickiness
Track monthly and daily active users easily in your UXCam dashboard:
Create a user report in dashboards
Search for weekly or monthly active user reports
Hit ‘add to dashboard’
Watch the data roll in
Example of MAU report in UXCam
Then with this data, you can use the formula above to calculate your stickiness percentage. Now you have a good overview of how users feel about your app and can guide decisions as a product leader to improve that metric.
UXCam is a tool that can help fintech apps measure their app performance and improve KPI metrics. By providing detailed insights into user behavior, product teams can better understand how users interact with new features, identify pain points, and optimize the user experience.
UXCam offers features like:
AUTHOR
Hannah Squire
Product Analytics Expert
Hannah is working at UXCam. For the past few years, she’s been working on creating more valuable and useful content for SaaS companies and their users.


Related articles


Product best practices
12 Apps with Great User Onboarding (2026 Examples)
The 12 mobile app onboarding flows I'd study if I were designing one today, with specific callouts for what each does well, common mistakes, and the...


Silvanus Alt, PhD
Founder & CEO | UXCam


Product best practices
Why creating a data-driven culture has less to do with data than you think
Kishan Gupta, CEO, shares 5 tips and techniques for fostering a data-driven culture based on his own experiences building and leading...


Kishan Gupta
Co-Founder of UXCam


Product best practices
Finance apps have a customer support problem, here's how to fix it
Learn about the customer support problem in finance apps and practical solutions to fix it in our latest blog post, and improve user satisfaction and...


Jane Leung
Product Analytics Expert