How to Measure Mobile App Performance: 18 Metrics That Matter (2026)

TABLE OF CONTENTS
- Key takeaways
- The performance metrics catalog
- Bonus: the business-layer metrics
- Setting performance budgets per platform
- APM and RUM tools compared
- Device-class benchmarking
- Catching performance regressions in CI/CD
- Perceived vs Technical Performance
- The performance maturity model
- 10 common mobile performance mistakes
- Understanding app performance metrics together
- How to measure mobile app performance effectively
- Measure mobile app performance with UXCam
Mobile app performance metrics measure how fast, reliable, and engaging a mobile app feels to users. "Performance" actually covers several overlapping layers: technical performance (frame rate, memory, API latency), launch performance (cold start time), reliability (crash-free sessions, ANR rate), business performance (revenue, retention, LTV), and perceived performance (rage taps, UI freezes, navigation friction). Knowing which layer you're measuring is the difference between "we need to make the app faster" and "we need to reduce cold start on Android below 2 seconds on mid-range devices."
I've audited performance measurement setups across dozens of mobile teams, and the pattern is consistent. The teams that ship fastest measure what users feel, not just what their APM dashboard says. This guide covers the performance metrics worth tracking in 2026, how to calculate each, what ranges to aim for, and how to turn a performance dashboard into an actionable improvement loop. The metrics apply to iOS, Android, and hybrid apps equally.
Key takeaways
Mobile app performance is five layers: technical (frame rate, memory), launch (cold start), reliability (crash rate), business (revenue, retention), and perceived (rage taps, friction). Track at least one metric from each.
The single highest-impact performance metric for retention is cold start time. Users decide whether to engage within the first 3 seconds, and cold start above 2.5 seconds measurably hurts first-session retention.
Crash-free user rate below 99% is the threshold where you should be paging someone. Below 97% is an emergency.
Qualitative performance signals (rage taps, UI freezes) often catch issues before quantitative metrics do. A rage-tap spike on a specific screen is a diagnostic lead no dashboard average will surface.
Set performance budgets per device class and enforce them in CI. Mid-range Android is the ceiling for real-world performance, not flagship iPhones.
The performance metrics catalog
The sections below break down 18 signals I track across mobile teams. Each covers what the metric is, why it matters, a healthy target range, and the tooling I use to capture it cleanly.
1. Cold start time (p50 and p95)
Cold start is the time from app launch tap to first fully interactive frame after the OS has terminated the process. I measure it at both p50 (the median user experience) and p95 (the slow tail where churn hides), because a healthy median often masks a brutal long tail.
This is the single most important launch metric, and Google's Android vitals documentation treats it as a first-class reliability signal. Cold starts above 5 seconds are flagged as "excessive" in Play Console, and my own data lines up: first-session retention drops sharply once p95 climbs past 2.5 seconds. I aim for p50 under 1.2s and p95 under 2s on the target device class. Anything above 3s on p95 is a release blocker.
To instrument it, iOS exposes cold start via
's , and Android exposes plus Play Console's startup vitals. Any decent APM, including Firebase Performance, Sentry Mobile, Datadog Mobile RUM, Embrace, and UXCam, captures this automatically.2. Warm start time
Warm start is the time from tap to interactive when the process is still resident in memory but the activity or scene is recreated. It matters more than most teams realize because warm starts dominate daily active usage. A user who opens the app 8 times a day sees 1 cold start and 7 warm starts. If warm start is janky, the app feels broken even if cold start is excellent.
I aim for p95 under 800ms, and anything above 1.5s is noticeable. The same tooling as cold start captures it, separated by launch type, and Firebase's
trace is a clean place to watch it.3. Time to interactive (TTI)
TTI measures the time from screen navigation to the point where the user can actually tap or scroll without jank. It's different from "screen rendered," which only tells you pixels are on glass. A screen can render instantly but still be blocked waiting on a network call or a heavy main-thread task, and TTI is what catches the gap between "looks loaded" and "responds to input."
The target I hold teams to is under 2s on p95 for any primary screen, and under 1s for high-traffic screens like home or feed. To instrument, wrap your navigation handler with a timestamp and emit the "interactive" event once the main-thread backlog drains and any blocking network calls complete. UXCam captures this automatically via its screen-transition measurement.
4. Time to first action
Time to first action measures the time from screen appearance to the user's first meaningful tap or scroll. It's a behavioral signal rather than a technical one, and pairing it with TTI is where it earns its keep. If TTI is 1.2s but time to first action is 4.8s, users are hesitating, and that usually means the UI is unclear rather than slow.
Targets vary by screen type: on a core action screen, under 3s is healthy, while anything over 8s suggests a UX problem rather than a perf problem. UXCam's session analytics surfaces this directly, and Amplitude or Mixpanel can reconstruct it from funnel steps.
5. Frame rate during scrolling
This is the average frames per second while the user is actively scrolling core surfaces like feeds, lists, or product grids. Modern Android and iPhone screens run at 90Hz or 120Hz, so a sub-60fps feed on a 120Hz device feels noticeably off. Scrolling is also the single most-performed gesture in most apps, which means jank here hits every session.
I aim for 58fps+ on 60Hz devices and 90fps+ on 120Hz devices, always measured on mid-range Android rather than a flagship. Android's API and JankStats library handle instrumentation, and on iOS it's
plus animation hitches.6. Jank percentage (slow and frozen frames)
Jank percentage is the share of frames that took longer than 16.67ms (slow) or 700ms (frozen) to render, using Google Play's definitions. Play Console flags apps with slow frames above 25% of sessions or frozen frames above 0.1%, but I hold teams to a tighter bar: slow frames under 10% and frozen frames under 0.05%.
The reason this matters more than raw fps is simple: users don't feel "average fps," they feel the bad frames. A list that runs at 120fps most of the time but stutters for 200ms every scroll feels worse than a steady 60fps.
7. ANR rate (Android)
Application Not Responding, or ANR, is what Android fires when the main thread is blocked for 5+ seconds on a UI event or 10+ seconds on a broadcast receiver. Google Play's Android vitals thresholds put the ceiling at 0.47% user-perceived ANR rate, above which Play surfaces a warning to users in the store.
Firebase Crashlytics, Sentry, Bugsnag, and Google Play Console all report ANRs with the stack captured at the time of freeze, so there's no excuse for flying blind here.
8. Hang rate (iOS)
Hang rate is the iOS equivalent of ANR.
reports hangs when the main thread is unresponsive for 250ms+ (micro-hang) or 2s+ (full hang). I hold the overall hang rate under 0.1% of sessions. Apple's Xcode Organizer flags hangs as a release-quality metric alongside crashes, and via MetricKit is exposed by most mobile APMs.9. Crash-free user rate
Crash-free user rate is simply the percentage of users with zero crashes in the period, calculated as users-without-crashes divided by total users, times 100. I keep this above 99% daily. The reason it's retention-critical rather than just a reliability metric: users who hit a crash in session one churn at roughly 3x the rate of users who don't.


10. Crash-free session rate
Crash-free session rate is sessions-without-a-crash divided by total sessions, times 100, and I target above 99.5%. It gives a subtly different view than crash-free users. A single user can have many crash-free sessions plus one crashed session, so the session metric separates "how often do crashes happen" from "what share of users ever hit one." You want to watch both.
11. Memory peak usage and low-memory terminations
Memory peak is the maximum RAM used by the app during a typical session, and low-memory terminations are the rate of OS-level memory kills (jetsam on iOS, OOM kills on Android). For most consumer apps, I aim for peak memory under 200MB and low-memory terminations under 0.2% of sessions on entry-level devices.
This matters because memory spikes cause crashes and foreground terminations on low-memory devices, which are the majority of the global install base. iOS jetsam kills are particularly insidious because they're invisible to crash reporting: the OS kills the process cleanly, and
is the only way to see them. On Android, and Firebase Performance do the job; on iOS, plus Xcode Instruments allocations.12. Battery drain per session
Battery drain measures milliamp-hours consumed per minute of foreground use, normalized across device classes. Battery is the silent retention killer. Users rarely complain specifically about battery, but they uninstall apps they blame for drain. Android's Battery Historian and iOS's
plus give the raw data.My targets: under 4% battery per 30-minute session on reference devices, and background drain under 0.5% per hour when idle.
13. Network error rate
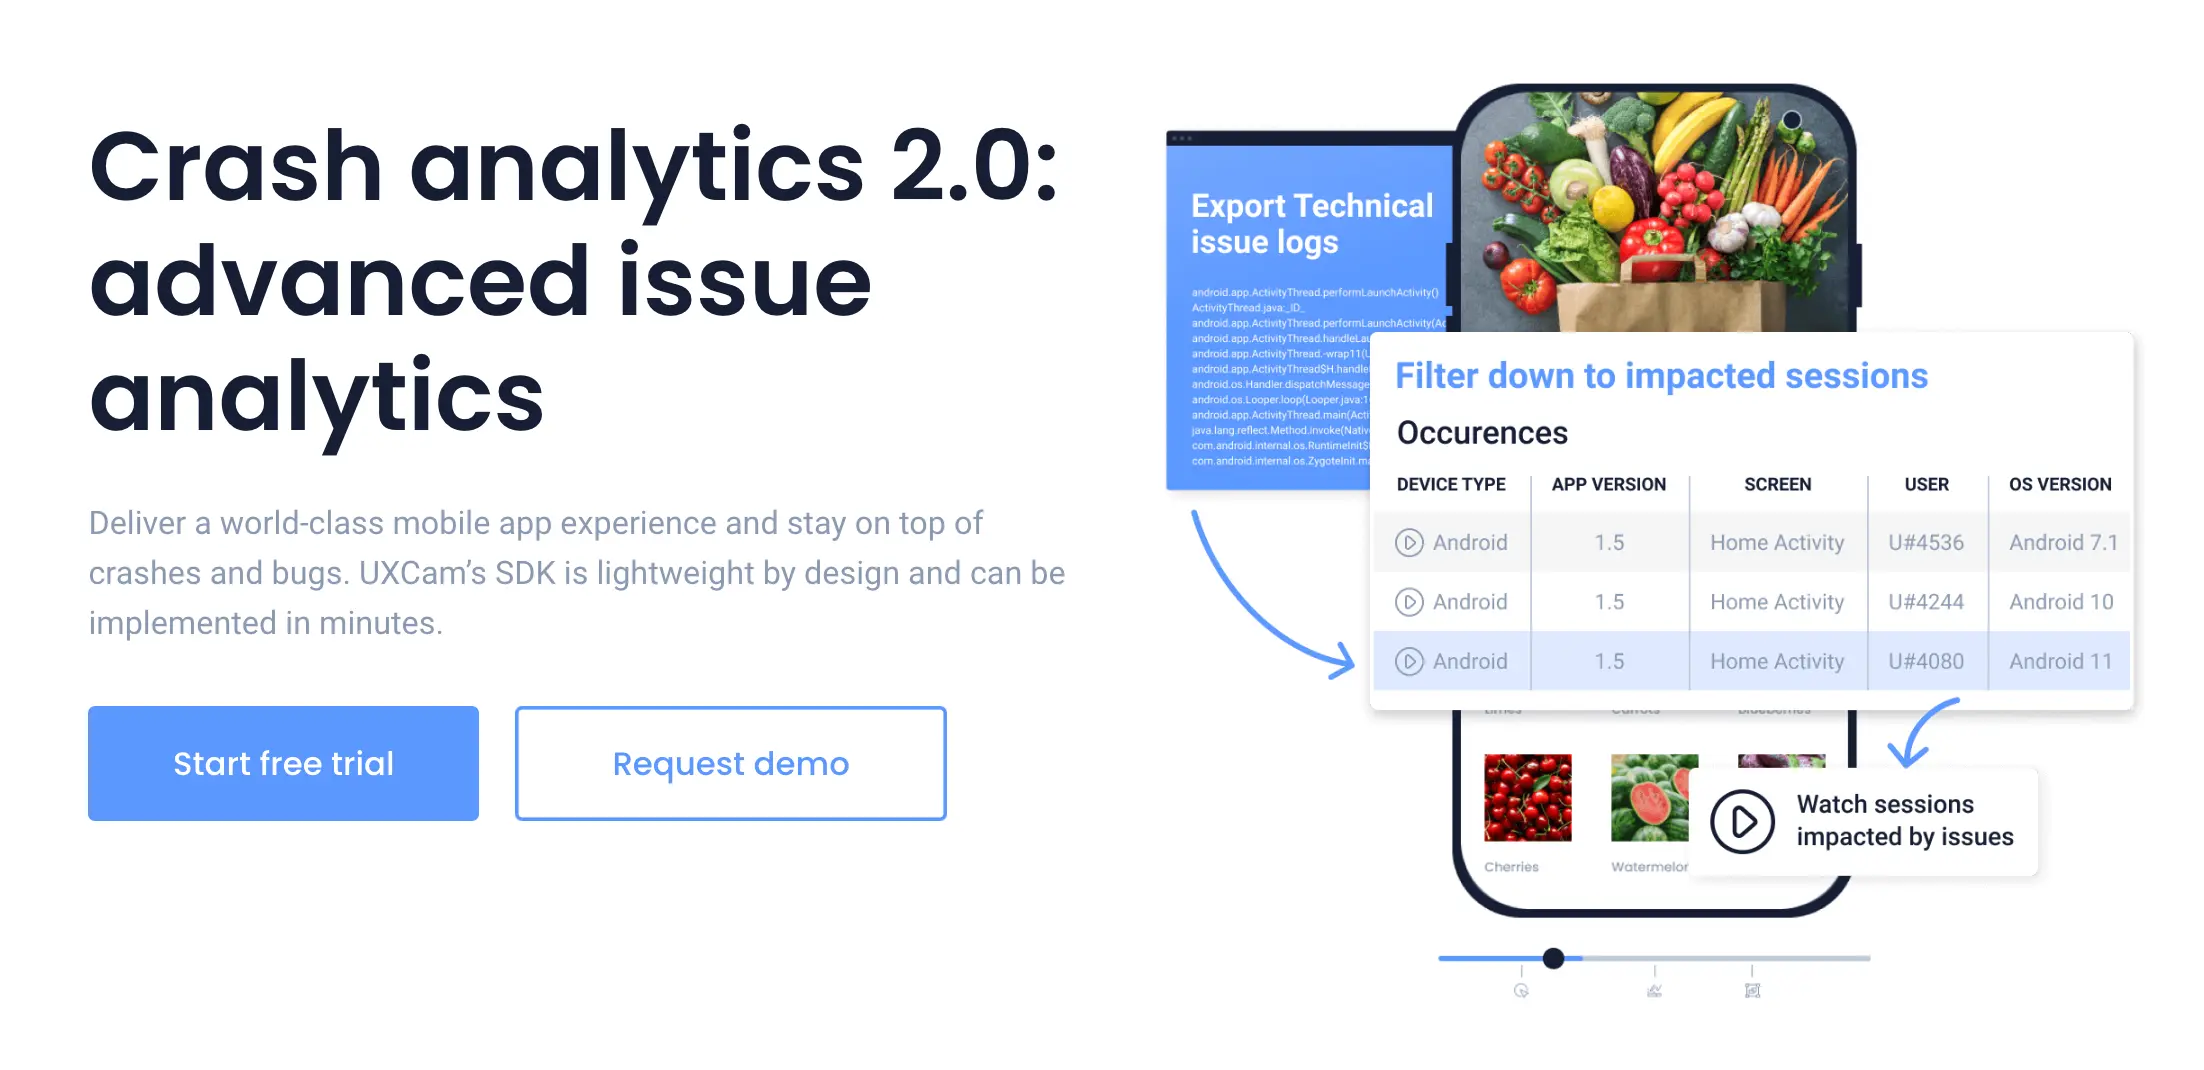
Network error rate is the percentage of HTTP calls that return 4xx, 5xx, timeout, or DNS failure. Every failed request is a feature that didn't work for a user, and session replay paired with network error logs shows exactly what the user tried to do and what they saw instead.
I keep combined 5xx and timeouts under 1%, with 4xx under 5% and mostly attributable to auth expiry. Firebase Performance network monitoring, Datadog RUM, New Relic Mobile, and UXCam network capture all surface this.
14. API latency (p50, p95, p99)
API latency is the time from the app firing a request to receiving a usable response, measured client-side rather than server-side. Server-side dashboards almost always look healthier than client-side because they miss network transit and DNS. Measure where the user actually experiences the call.
My targets: p95 under 500ms for primary API calls and p99 under 1.5s. Backend latency compounds: a 200ms database query plus 200ms network plus 200ms client rendering feels slow by the time the user sees anything.
15. Asset download size and launch payload
This is the bytes downloaded on first launch plus bytes per typical session. I aim for first-launch payload under 15MB on cellular and per-session payload under 2MB for content apps (higher for media).
Payload is a proxy for performance on slow networks. In markets where 3G is still common, a 40MB first-launch download is a funnel leak. Android App Bundles and iOS on-demand resources let you defer non-critical assets until they're actually needed.
16. Cache hit rate
Cache hit rate is the percentage of data requests served from local cache rather than network. Above 60% is healthy for content that doesn't need to be real-time, and image caches should sit above 85%.
A cache miss is a user waiting on network, and every cache hit is a perceived-performance win. Libraries like Coil on Android and Kingfisher on iOS expose hit-rate telemetry natively.
17. Rage-tap rate
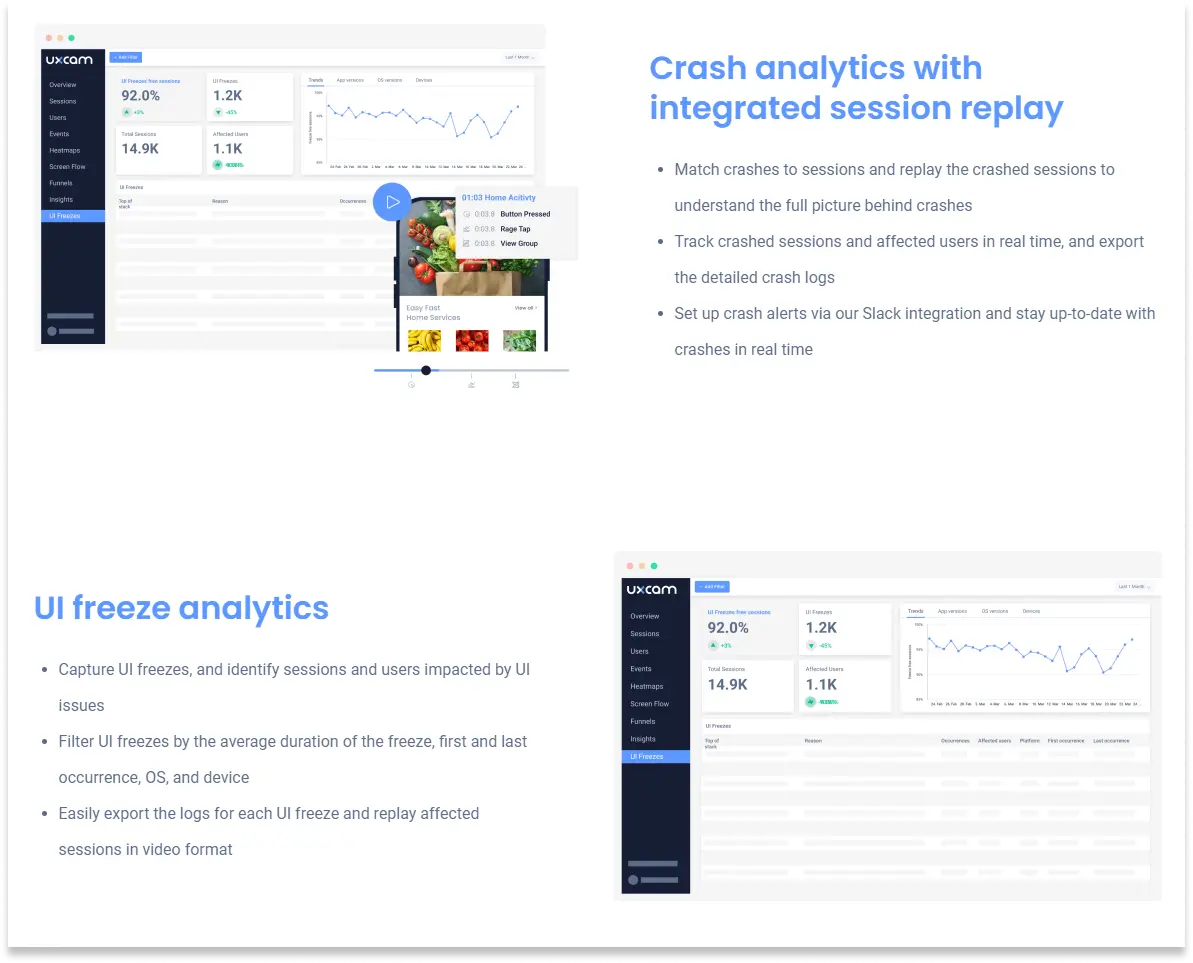
Rage-tap rate is the share of sessions with at least one rage-tap event, calculated as rage-sessions divided by total sessions, times 100. A rage tap is 4+ taps in a second on the same UI element, indicating frustration with an unresponsive or misunderstood interaction. UXCam's Issue Analytics surfaces these automatically and ranks them by business impact.
A rage-tap spike on a specific button is one of the fastest diagnostic leads in mobile performance work. The user expected something to happen and it didn't; the question is why.
18. UI-freeze rate
UI-freeze rate is the percentage of sessions with at least one UI freeze longer than 2 seconds. UI freezes are moments where the app stops responding to input briefly. They rarely crash the app, so crash reporting misses them entirely. Session replay catches them obviously. I target below 1%.
Bonus: the business-layer metrics
Performance ladders up to business outcomes, and these three metrics round out the picture.
App retention (day-1, day-7, day-30)


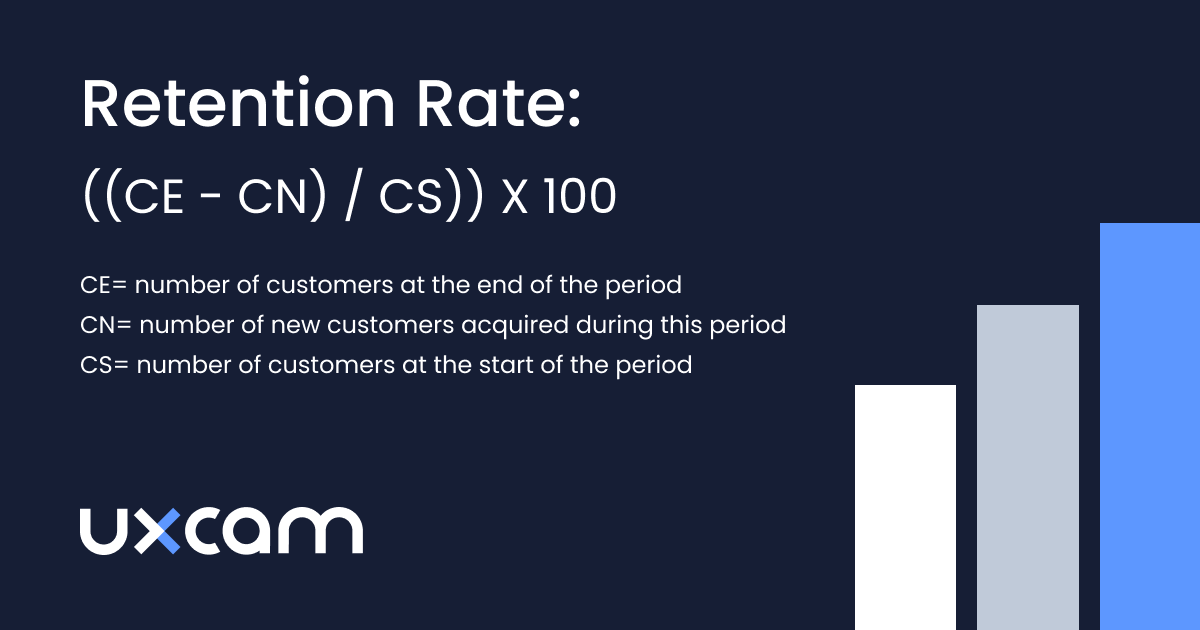
Retention is users-from-cohort-X-still-active-on-day-N divided by total-users-in-cohort-X, times 100. It's the ultimate downstream signal of performance quality. Users don't come back to apps that feel broken. For detailed ranges by category, see the mobile app retention benchmarks guide.
Session length and session depth
Session length is average time per session, and session depth is average screens or actions per session. Both are engagement signals with direct performance implications. When session length drops, a performance regression is often the cause.


CAC and ROAS
Customer acquisition cost is acquisition spend divided by new users acquired in the same period. Return on ad spend is revenue generated divided by ad spend. If CAC rises without a corresponding LTV increase, acquisition efficiency is regressing. If ROAS drops below 3:1, the marketing channel is underwater.
Setting performance budgets per platform
A performance budget is a hard threshold that a release cannot cross without explicit sign-off. Without budgets, every sprint erodes performance by a few milliseconds and nobody notices until the app feels sluggish six months later.
I set budgets per device class, because "the app is fast" on an iPhone 15 Pro means very little when 40% of users are on a Redmi Note from 2021.
iOS budgets (recent iPhones, iOS 17+)
Cold start p95: 1.2s
Warm start p95: 500ms
TTI for primary screens: 1s
Hang rate: under 0.05%
Memory peak: 180MB
Crash-free sessions: 99.7%
Apple's Human Interface Guidelines implicitly define responsiveness. Interactions should feel immediate, which internally translates to under 400ms from tap to visible feedback.
Mid-range Android budgets (Samsung A-series, Pixel 6a, Redmi Note 12)
Cold start p95: 2s
Warm start p95: 900ms
TTI: 2s
ANR rate: under 0.47% (Play Console threshold)
Frozen frames: under 0.1% of sessions
Memory peak: 220MB
Crash-free sessions: 99.5%
Low-end Android budgets (Android Go, <3GB RAM)
Cold start p95: 3.5s (realistic, not aspirational)
Memory peak: 120MB
Low-memory kill rate: under 1% of sessions
Network payload per session: under 1.5MB
Web mobile (PWA or mobile web companion)
Use Core Web Vitals as the baseline: LCP under 2.5s, INP under 200ms, CLS under 0.1. These are Google's public search-ranking thresholds and a reasonable floor for any mobile web surface.
APM and RUM tools compared
There is no single tool that does everything well. Most mature teams run one APM, one crash reporter (sometimes the same tool), and one behavioral platform like UXCam.
Firebase Performance Monitoring is free and integrated with Crashlytics, making it a good baseline for cold start, network calls, and custom traces. Historical retention is limited and alerting is weak, so it works best as a starter APM or a second opinion next to a paid tool.
Sentry is strong on crashes and errors with a growing performance story around transactions and profiling. The developer experience and SDK are clean, but it can get expensive at scale because pricing is event-based.
Datadog Mobile RUM is enterprise-grade and ties mobile telemetry to backend APM in the same account. It's expensive, and best when you're already standardized on Datadog for server observability.
New Relic Mobile is similarly positioned but with user-based rather than event-based pricing. Crash and network capture are solid, though the UI feels dated compared to newer tools.
Embrace is mobile-only, built by former Scopely engineers, and goes deep on session-level reliability. It's strong on the "why did this user's session degrade" question, and a good choice if mobile is your primary surface and you want depth over breadth.
Bugsnag handles crash reporting with stability scoring. It's now owned by SmartBear, and it's simple and reliable, though less ambitious on performance than Sentry or Datadog.
Instabug combines in-app bug reporting with performance and crash monitoring. It's popular in emerging markets, and the in-app feedback flow is its differentiator.
UXCam is a product intelligence platform covering session replay, heatmaps, and issue analytics. It captures crash context, rage taps, UI freezes, screen-level TTI, and network errors automatically, with Tara AI sitting on top to surface anomalies in plain language. I use it alongside a technical APM, not as a replacement. The replay is the thing: a crash ticket with the replay attached gets fixed 3x faster than one without.
Device-class benchmarking
Aggregate performance metrics lie. If 55% of your users are on iOS and the app is fast there, the overall p95 looks fine even if Android is catastrophic.
Why mid-range Android should drive your ceiling
Globally, the median Android device has 4GB of RAM, a 2020-era Snapdragon or Mediatek chipset, and 64GB of storage. If your app is built and tested only on Pixel 8 Pros and iPhone 15s, every release will quietly degrade the experience for the majority of your install base.
I set the performance ceiling using a Samsung Galaxy A24, Redmi Note 12, or equivalent. If it's smooth there, it'll be smooth everywhere.
Sampling strategy
Don't weight performance metrics by session count alone. Weight by strategic importance: the top 5 devices by active users (usually 40-50% of your base), the top device in each of your top 3 revenue markets, a reference low-end device (Android Go or equivalent), and the latest flagship of each OS for forward compatibility. That's usually 8-10 reference devices, and any regression on any of them should be surfaced in your release report.
Synthetic device labs
For pre-release testing, cloud device labs let you run automated scripts across hundreds of devices. Firebase Test Lab is integrated with Google's ecosystem and strong on Android but limited on iOS. BrowserStack App Live has a large device inventory and a good UI for manual testing. LambdaTest is competitively priced with strong CI integration. AWS Device Farm is a fit if you're already in AWS.
Real-user data still beats synthetic for post-release measurement, but synthetic catches the obvious regressions before they ship.
Catching performance regressions in CI/CD
The cheapest time to fix a performance regression is before it merges. The most expensive is after it ships to 100% of users.
Pre-merge performance budgets
Run a lightweight perf suite on every PR: cold start on a reference emulator, memory peak after a scripted 2-minute session, binary size delta. If any budget is exceeded, block the merge or require a label like
. Emerge Tools handles binary size and startup time regressions, Reassure covers React Native, and Firebase Test Lab Benchmark works for Android.Flamegraph capture on regressions
When a regression is detected, automatically capture a systrace or Instruments profile from the CI run. A flamegraph attached to the failing build turns a two-day investigation into a 10-minute one.
Staged rollouts
Don't push new releases to 100% immediately. The standard practice is to go 1% on day 1 while watching crash-free rate and ANR live, 10% on day 3 if metrics are within budget, 50% by day 7, and 100% by day 10. Both App Store Connect phased release and Play Console staged rollouts make this trivial. The moment a metric breaches budget, halt and investigate.
Perceived vs Technical Performance
Technical performance is a measurement; perceived performance is an emotion. They correlate, but not cleanly. A user who waits 800ms with a skeleton screen feels the app is fast. A user who waits 400ms staring at a blank white screen feels it's broken. The second case has better technical metrics and worse perceived performance.
Techniques that improve perception without changing latency
Skeleton screens show the shape of content before content arrives. Facebook pioneered the pattern, and it makes slow networks feel acceptable. Optimistic UI commits the user's action visually before the server confirms, rolling back with a toast if it fails; Twitter's like button is the canonical example. Progressive loading renders the cheap parts first (text, layout) and streams in expensive parts (images, personalized modules). Haptic confirmation uses a subtle haptic on tap to confirm the action registered even if the screen hasn't updated, and iOS's
and Android's make this trivial. Predictive prefetch fetches the likely next screen's data while the user is still on the current screen.How session replay surfaces the gap
Technical metrics tell you the API returned in 300ms. Session replay shows the user tapping, waiting, tapping again, tapping a third time because nothing visibly changed. That's a perceived-performance problem you'd never find in an APM dashboard, and it's why pairing UXCam with a technical APM works better than either alone.
The performance maturity model
Most teams sit at stage 1 or 2. Very few reach stage 4. Knowing which stage you're at tells you what to work on next.
Stage 0: No instrumentation. Crashes come from Apple Review or user tweets. Performance discussions are vibes-based, and "the app feels slow" is a valid bug report. Most early-stage startups live here.
Stage 1: Basic crash reporting. Firebase Crashlytics or Sentry is installed, and someone watches crash-free rate occasionally. No cold-start or ANR tracking yet. Performance regressions are noticed in hindsight.
Stage 2: APM installed, dashboards exist. A performance dashboard exists, cold start and crashes and network latency are tracked, but nobody looks at it weekly. Regressions are noticed when someone complains. Most mid-stage companies sit here.
Stage 3: Performance owned by a team. A performance team or dedicated engineer owns the dashboards, sets budgets, and reviews releases. Regressions are caught within days, session replay is paired with metrics, and users see tangible quarterly improvements. This is where the big reliability wins happen.
Stage 4: Perf budgets enforced in CI, owned by every team. Every feature team owns the performance of their surface, budgets are enforced in CI, and regressions block merges. Every release has a perf review alongside the product review. Performance is a first-class product pillar, not an engineering concern. Apps at this stage (Lyft, Airbnb, Uber's mobile teams) publish engineering blog posts about their practice.
10 common mobile performance mistakes
These are patterns I see repeatedly during audits.
Starting too many SDKs on cold start. Analytics, ads, feature flags, crash reporter, session replay, push, A/B testing, and auth SDK all initialized synchronously in
. Defer everything that isn't needed before first frame.Synchronous network on the main thread. Even one blocking call on the UI thread causes an ANR on slow networks. Use coroutines, structured concurrency, or Swift async/await.
Oversized launch bitmaps. A 4MB PNG splash screen decoded on main thread adds 600ms to cold start on mid-range Android. Use vector drawables and the Android 12 splash screen API.
Unbounded image caching. Loading a 4K image into a 400px ImageView without downsampling burns memory. Every image library has resize options; use them.
Ignoring low-memory devices. Testing only on your personal flagship phone. The 2GB-RAM device is 30% of your users and 60% of your 1-star reviews.
No retry or backoff on network failures. A flaky connection turns into a permanent error because the app doesn't retry. Use exponential backoff with jitter.
Blocking the first screen on an auth refresh call. If the refresh fails, the user sees a loading spinner forever. Render from cache, refresh in background.
Emitting too many analytics events. Batching 200 events per minute with no compression burns battery and bandwidth. Use the SDK's batching window, not per-event HTTP.
Layout thrashing in lists. RecyclerView or SwiftUI List recomputing expensive layouts on every scroll frame. Profile with Layout Inspector or Instruments.
Ignoring the app size creep. Every new library adds megabytes, and a 200MB app has meaningfully lower install conversion than a 40MB app. Audit with Android Studio APK Analyzer and App Thinning.
Understanding app performance metrics together
Each metric answers a different question. Cold start, frame rate, memory, and API latency tell you how fast the app is. Crash-free rate, ANR rate, and UI-freeze rate tell you how reliable it is. Rage-tap rate and session replay observations tell you how the app actually feels to users. Retention, session length, and DAU/MAU tell you whether users are coming back. CAC, ROAS, and LTV:CAC tell you whether the business is efficient.
The best performance dashboards pick 2-3 metrics from each category so you have a complete picture in 10-12 numbers.
How to measure mobile app performance effectively
Start by installing an analytics SDK that captures these metrics automatically. UXCam, Firebase Analytics plus Performance, Sentry, or Mixpanel all work. Manual instrumentation takes weeks and catches a fraction of what auto-capture does.


Then segment by device class, OS version, and geography, because aggregate metrics hide real patterns. A 95th-percentile cold start that looks great overall might hide terrible performance on the 30% of users on mid-range Android.
Review the dashboard weekly with the product team. Performance isn't just an engineering metric: product decisions about which screen to make default, which feature to add, how much onboarding to show all affect performance directly. Set alerts for regressions so that when crash-free rate drops below threshold or cold start goes above target, someone gets paged. Silent regressions compound faster than anyone expects.
Finally, pair quantitative metrics with session replay. Numbers tell you something moved; replays tell you what users were actually experiencing. UXCam's session replay plus Tara AI make this workflow automatic.
Measure mobile app performance with UXCam
UXCam is a product intelligence and product analytics platform that automatically captures every user interaction on mobile apps and websites, with no manual event tagging. Cold start time, crash-free rate, session length, rage-tap rate, UI-freeze rate, and all the other metrics on this list are tracked out of the box. Issue Analytics surfaces performance problems in real time and ranks them by how many users are affected, and Tara, UXCam's AI analyst, processes sessions to recommend specific fixes, giving teams evidence-based insights and the evidence to convince stakeholders.
Inspire Fitness used this workflow to boost time-in-app by 460% and reduce rage taps by 56%. PlaceMakers identified a performance problem, tested a fix, and validated the result in 3 days. UXCam's SDK has been refined for 9+ years, sits under 300KB, uses less than 5% CPU, and is installed in 37,000+ products.
Request a demo to see it for your app.
Frequently asked questions
What are mobile app performance metrics?
Mobile app performance metrics are the quantitative signals that measure how fast, reliable, and engaging a mobile app feels to users. They span five layers: technical performance (frame rate, memory), launch performance (cold start), reliability (crash-free rate), business performance (retention, CAC), and perceived performance (rage taps, UI freezes). Tracking at least one metric from each layer gives you a complete picture of the app's health.
How do you measure mobile app performance?
Install an analytics SDK that captures the metrics automatically, such as UXCam, Firebase Performance, or Sentry. Segment by device class, OS version, and geography to find patterns that aggregate data hides, and review weekly with product and engineering. Pair quantitative metrics with session replay to understand what users actually experience, and set alerts for regressions on critical metrics like crash-free rate and cold start.
What's a good cold start time for a mobile app?
A p95 below 2 seconds is good, below 1.5 is excellent, and above 3 seconds hurts first-session retention measurably. Track the 95th percentile, not the median, because users on slower devices and networks are the most vulnerable to churn. Those users are usually the worst-served by your app, so fixing their experience matters disproportionately.
What's the difference between mobile app performance and mobile app analytics?
Mobile app performance is a subset of mobile app analytics. Performance covers technical and perceived speed, reliability, and the user experience of the app working well. Analytics covers the broader set of metrics including engagement, retention, revenue, and acquisition. All performance metrics are analytics metrics, but not all analytics metrics are about performance.
Which mobile app performance metric is most important?
Cold start time for early retention, crash-free user rate for reliability, and rage-tap rate for perceived performance. If I had to pick one overall, it's crash-free user rate, because a crash in a user's first session roughly triples their churn probability. Everything else in the performance stack matters less if you have fundamental reliability issues.
How often should I measure mobile app performance?
A daily glance at crash-free rate and alert status, a weekly review of the full performance dashboard with the team, and a monthly retrospective on trends and release impact. Performance measurement is ongoing, not a one-time audit. Teams that review weekly catch regressions hours or days after they ship, rather than weeks later when support tickets start accumulating.
What tools measure mobile app performance?
UXCam handles the full product intelligence picture with session replay, automatic performance tracking, and Tara AI. Firebase Performance Monitoring is free and good on iOS and Android. Sentry covers crashes plus some performance, Datadog Mobile RUM handles enterprise integration, and Embrace offers mobile-specific reliability depth. Most teams combine a technical APM tool with a behavioral tool like UXCam.
How do I interpret mobile app performance data?
Segment everything by device class first. A p95 that looks fine overall often hides terrible mid-range Android performance. Cross-reference quantitative metrics with session replays, and watch what users experience rather than just what metrics show. Set alerts on key thresholds so regressions don't compound silently. The interpretation gets easier once you've seen the metrics move a few times through releases; patterns emerge.
What performance targets are realistic for a new app?
For a v1 release, aim for cold start p95 under 2.5s on mid-range Android, crash-free sessions above 99%, and ANR rate under 0.5%. Don't benchmark against Facebook or Spotify, which have hundreds of engineers working on performance. Benchmark against comparable apps in your category using Play Console's peer benchmarks instead.
How do I prioritize performance work against feature work?
Treat performance debt like technical debt: allocate 15-20% of each sprint to it when metrics are healthy, and 50%+ when they're breaching budget. When crash-free rate drops below 99% or cold start regresses by 20%, performance becomes p0 and feature work pauses. Tie performance wins to business metrics like retention and conversion to make the case for allocation.
How do I write a mobile app performance SLA?
Define the metric, the percentile, the threshold, the measurement window, and the consequence. For example: "Cold start p95 on Samsung A54 under 2s, measured weekly across 10,000+ sessions. Breach triggers a p1 incident and halts rollout of the next release." Internal SLAs are more useful than customer-facing ones because they drive behavior without creating legal exposure.
What are the privacy implications of collecting performance data?
Cold start, frame rate, memory, and crash data are not PII and generally don't require consent beyond your standard privacy policy. Session replay is more sensitive because it can capture screen content. Use SDK features that mask sensitive fields (UXCam, Sentry, and Datadog all support this), exclude PII-bearing screens from capture, and disclose replay in your privacy policy. In the EU, treat session replay as subject to GDPR consent.
Should I build a custom performance monitoring system?
Almost never. Building an APM that handles symbolication, session stitching, network capture across iOS and Android, and aggregation at scale takes a team of 5+ engineers years. The commercial tools (Firebase, Sentry, Datadog, UXCam) have solved this. Spend the time on your actual product.
How does performance affect app store ranking?
Directly on Google Play via Android vitals, where ANR rate, crash rate, slow frames, and frozen frames feed into discoverability. Indirectly on both stores via reviews and retention, which both correlate strongly with performance. Apps with a 4.5+ rating get 4x the organic installs of 3.5-rated apps, and performance complaints are a top-3 driver of 1-star reviews.
What's the single biggest lever for improving perceived performance?
Skeleton screens and optimistic UI, combined. Show structure immediately on navigation, commit user actions visually before the server responds, and roll back gracefully on failure. You can have mediocre technical metrics and excellent perceived performance if these two patterns are in place, and that's what users actually experience.
AUTHOR
Silvanus Alt, PhD
Founder & CEO | UXCam
Silvanus Alt, PhD, is the Co-Founder & CEO of UXCam and a expert in AI-powered product intelligence. Trained at the Max Planck Institute for the Physics of Complex Systems, he built Tara, the AI Product Analyst that not only analyzes user behavior but recommends clear next steps for better products.


TABLE OF CONTENTS
- Key takeaways
- The performance metrics catalog
- Bonus: the business-layer metrics
- Setting performance budgets per platform
- APM and RUM tools compared
- Device-class benchmarking
- Catching performance regressions in CI/CD
- Perceived vs Technical Performance
- The performance maturity model
- 10 common mobile performance mistakes
- Understanding app performance metrics together
- How to measure mobile app performance effectively
- Measure mobile app performance with UXCam


Related articles


Conversion Analysis
React Native Crash Reporting + Best Tools and Techniques
Learn how to improve your mobile app's stability with effective React Native crash reporting. Explore the top techniques and tools for monitoring and managing...


Tope Longe
Product Analytics Expert


Conversion Analysis
Flutter Performance Monitoring - Best Tools and Techniques
In this article, we'll introduce you to the top Flutter performance monitoring tools and demonstrate how UXCam can help you monitor your app's performance with...
Tope Longe
Product Analytics Expert


Conversion Analysis
How to measure, analyze, and reduce app churn
All the user acquisition in the world won't matter if you've got a high churn rate on your app. If you want to know why users are uninstalling or unsubscribing, tools like screen flow, heatmaps, and screen recordings can get users loving — instead of leaving your...
Tope Longe
Product Analytics Expert