The only 10 slides you need to present session replay findings

TABLE OF CONTENTS
- Slide 1: Start with a numbers story
- Slide 2: Show the consequences of no action
- Slide 3: State your hypothesis
- Slide 4: Get back to the funnel, start with segments
- Slide 5: Observation 1 - Walk through the biggest pain point
- Slide 6: Observation 2 - Emphasize the user frustrations
- Slide 7: Observation 3 - Show urgency
- Slide 8: Show initiative with an action plan
- Slide 9: Implementation plan
- Slide 10: Wrap up and feedback
So you just discovered a user pain point through session replays and want to use it to convince your team that you need to make big changes.
But.. you play the video to a few team members and skeptics come out of the woodwork:
- Okay, but that's just three users...very subjective
- Doesn't represent the entire user base
- Can we see the hard numbers on this?
We know it's tough to show qualitative data on its own.
That's why today, we're helping you share your session replay insights with 10 slide examples and tips.
If you are new to session replay, you can get prepared with our literature on how to analyze session replay first, before diving into these 10 slides.
Slide 1: Start with a numbers story
This first slide is for the skeptics who want to see the quant data first.
Session replays are connected to funnels and heatmap data, so you can actually use those to lead the audience to your videos.
Quantitative data is where your story should begin. e.g. there's a drop in conversions or you picked up an anomaly in your sign up to activation rates.
In a hypothetical ecommerce shopping app example, we're kicking off our slide by highlighting an alarmingly high 'homepage exit rate" report.


(You can create reports like these on our customizable dashboards.)
Begin by setting the stage:
"I want to start by drawing your attention to a concerning trend. Our homepage's exit rate has increased by a staggering 7% compared to the previous month."
Provide context: "This isn't just a minor blip; it's a significant shift that requires our immediate attention. We also received a couple of negative Google Play reviews about our home screen the last month"
Highlight the potential consequences:"Such a high exit rate not only means that users are leaving our app prematurely, but it also directly impacts our revenue potential and user engagement."
You can display this data in a customizable dashboard. If you're not sure what kind of KPIs stakeholders care about, check out these KPI dashboard examples used by real product managers, designers, and engineers.
Slide 2: Show the consequences of no action
In our hypothetical ecommerce app example, there are a few issues: Users aren't using the search bar, they are leaving the homepage and they aren't tapping on the product categories.
In our example below we show 2 different versions of the ecommerce app. The first before the homepage update and ads (1.5) , and the one after (1.2)
Make the consequence visual and impactful with a conversion funnel.


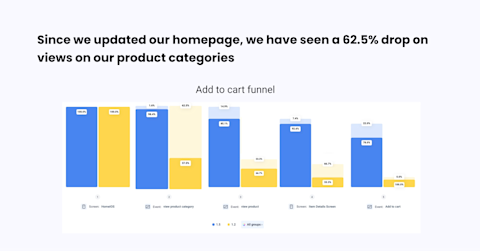
Engage your audience: "Let's dive into the numbers to understand the impact of our recent homepage changes."
Paint a picture: "Imagine our homepage as the gateway to a shopping journey. Users land here, but what happens next is critical."
Clarify the issue: "Since the homepage update and new ads, we've noticed a troubling 62.5% drop in users proceeding to view product categories. This drop cascades into lower conversion rates and therefore, sales."
Slide 3: State your hypothesis
Now set yourself up for bat with a measurable hypothesis.


Writing a hypothesis:
1. Clearly define the independent and dependent variables - Start by identifying the specific change or feature you want to test (independent variable) and the expected user behavior or outcome (dependent variable).
- For example: "If we remove cluttered elements from the homepage, then we expect to see users engaging more"
2. State the expected outcome and measurement metric: - In the second sentence, clearly express your hypothesis in terms of the expected outcome and the metric you will use to measure it.
- For instance: "We hypothesize that by simplifying the homepage design and reducing the number of ads, we can decrease the exit rate by at least 10% and increase the number of users proceeding to view product categories by 20%, ultimately boosting conversion rates and sales."
Slide 4: Get back to the funnel, start with segments
This slide serves as a bridge between the hypothesis and the detailed observations that follow. It highlights the methodical process you used to gather insights and prepares the audience for the specific observations you will present next.
If you have a tool like UXCam, you can navigate directly to the drop offs from the funnels..
Save your drop offs as a segment and begin to filter down till you identified the issue. From here, you can explain the process to your audience.
Begin to build reports based on the segment saved till you identified the issue.


Give some context: "Now, let's delve deeper into how we conducted a detailed analysis to validate our hypothesis and gain valuable insights into user behavior."
Explain how you filtered down from the list of drop off: To do this, we segmented the ”View product” drop offs and filtered sessions for UX/UI or technical issues."
Explain how you narrowed down your sessions to watch
:
"By segmenting our users and filtering sessions, we were able to isolate specific problem areas in the user journey."
Summarize your segments and samples:
"It looks like the majority of users who are on the latest version of the app are exiting the homepage immediately"
Slide 5: Observation 1 - Walk through the biggest pain point
Now that everyone knows how you filtered down to your top videos, it's time to press play.


Set up the session replay: Now, let's see exactly what the user does when they land on the home screen.
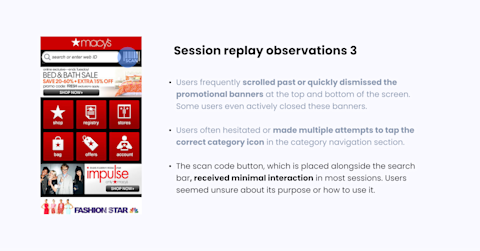
Share a user story:"Imagine a user lands on our home screen, excited to shop. However, they quickly scroll past or try to find an 'x' to close the promotional banners at the top and bottom. This is a common occurrence."
Explain the impact: This experience not only lowers the effectiveness of our promotions but also negatively impacts engagement with the product categories, which contributes to the exit rate
Slide 6: Observation 2 - Emphasize the user frustrations
We recommend showing a few videos with the same user behavior.
Those users can be diverse - from different countries and with different amounts of experience with the app.
Talk through the journey: "This user just wants to browse our shoes, but they are tapping around areas of the app that aren't interactive. This can be detected by UXCam's unresponsive gestures. We believe that the button design just isn't interactive."


Share a relatable scenario: "Think about when you visit a store, and you can't find the aisle you're looking for. It's frustrating, right? Our users face a similar frustration online."
Explain the significance: "Users hesitating or struggling to find the right category on our homepage can lead to frustration and drop-offs, impacting our view product and conversion rates."
Slide 7: Observation 3 - Show urgency
When highlighting a confusing element, share how many users in your total segment experienced the issue. You can even deep dive further by segmenting the different types of app versions, platform, OS, or regions these users came from.


Be fair to the original design: "Now I know we originally put this here to make it easier for users to get product info..."
Paint a picture: "But imagine our homepage is a physical store, and we have an unlabeled scanner near the entrance. However, most customers walk past it, unsure of what it's for."
Highlight the issue:"This is similar to our users' behavior. The scan code button near the search bar receives minimal interaction. Users are unclear about its purpose, which affects their experience."
Slide 8: Show initiative with an action plan
We know there will be a lot of questions. So, this slide is really just a blank slate ready for discussion.
Your team will have to discuss what is feasible to execute, but at least here you can share your opinion of what you would do.
Use a prioritization matrix to think about which of your prepared changes you want to do first.


A prioritization plan helps focus efforts on high-impact, low-effort changes initially to address the most critical issues.
Slide 9: Implementation plan
Depending on how the discussions go, you may not even get to this slide, but specific action items provide a clear path forward for optimizing your app.
This allows for immediate, short-term, and long-term improvements.


Immediate Action:"We will start working on high-priority recommendations within the next two weeks, aiming for rapid implementation."
Short-Term Focus: "Simultaneously, we will allocate resources to medium-priority recommendations to ensure continuous improvements."
Long-Term Strategy: "We'll initiate the planning phase for low-priority recommendations, with a focus on research and strategy development."
Slide 10: Wrap up and feedback
Summarize Key Takeaways:
Before concluding, briefly summarize the key points and insights presented in your presentation.
Highlight the main findings, recommendations, or strategies discussed.
Ensure that your audience leaves with a clear understanding of the most important aspects of your presentation.
Leave time to ask for feedback
Whew, alright, we hope that you found these slides helpful. If you'd like the Figma of these slides, just reply to this email and let me know.
All the features mentioned in the slides are free to use with our 14 day free trial, and are available to all paying customers on all plans.
AUTHOR
Jane Leung
Product Analytics Expert
Jane is the director of content at UXCam. She's been helping businesses drive value to their customers through content for the past 10 years. The former content manager, copywriter, and journalist specializes in researching content that helps customers better understand their painpoints and solutions.


TABLE OF CONTENTS
- Slide 1: Start with a numbers story
- Slide 2: Show the consequences of no action
- Slide 3: State your hypothesis
- Slide 4: Get back to the funnel, start with segments
- Slide 5: Observation 1 - Walk through the biggest pain point
- Slide 6: Observation 2 - Emphasize the user frustrations
- Slide 7: Observation 3 - Show urgency
- Slide 8: Show initiative with an action plan
- Slide 9: Implementation plan
- Slide 10: Wrap up and feedback


Related articles


App Analytics
The Hotjar for mobile apps: UXCam
Hotjar doesn't support mobile apps. Learn why mobile and web analytics are fundamentally different, what changed after the Contentsquare acquisition, and the best mobile-first...


Jonas Kurzweg
Product Analytics Expert


Session Replay
Session Recordings: The Complete Guide to Capturing Real User Behavior
Session recordings show exactly how users interact with your product. Learn how they work, which tools to pick, and how Tara AI turns replay into an...


Silvanus Alt, PhD
Founder & CEO | UXCam


Session Replay
10 Best Session Replay Software and Tools 2026
Discover the 10 best session replay tools to analyze user behavior, optimize UX, boost conversions, and enhance web and mobile app...


Tope Longe
Product Analytics Expert