

In short, heat maps measure visual intensity and represent data graphically using an overlay of colors. They make it easier for teams to see the UI elements users focus on the most and least. Thanks to the color variation, the granularity is easier to understand.
Heat maps are one of the best ways to learn how your users interact with your app, and they support logical design decisions when results are combined with other data, such as UXCam’s behavior analytics. There are several heat maps specifically for mobile apps, and today, we’ll discuss some of the information you can get from them and heat map examples.
What are heat maps?
Heat maps are quantitative visual representations of numerical data using color to depict different data points. They represent data like average temperatures and population density, and many are commonly used to show behavior on web pages or apps.


Heat maps show where users focus the most and least on pages using a warm-to-cool color scheme. Hot and cold spots where colors vary in hue or intensity. Red (warm) areas represent high engagement and are where users focus the most, while blue (cool) areas indicate low engagement —where users focus the least.
Some heat maps translate where users have tapped and how far they’ve scrolled down a page. The results of eye-tracking tests for usability research are also heat mapped.
Benefits of heat maps for mobile apps
The primary users of heat maps include product managers, UX designers, and marketing teams.
For UX, heat maps highlight where users get frustrated or cannot find the needed resource. Marketers can learn more about the places to position CTAs and featured products. While for product managers, heat mapping is beneficial when the product is a web app. They’ll learn essential usage patterns to help increase revenue.
Here are some of the critical questions heat maps help you to answer or at least understand better:
What prevents users from converting? Perhaps they don’t have the information they need to convert. This could point to an onboarding issue. Or maybe the conversion path isn’t clear enough due to poor usability.
What elements confuse? Heat maps instantly highlight the problem areas on your screens. For example, when users try to click on non-interactive aspects of your design. If this is typical behavior, consider whether the element is necessary.
How can the design be improved? When you know what the issues are, you can begin to work on a redesign to address them.
What parts of the design work well? For example, if you see a cluster of high activity placed over a CTA, you’ll know that your design successfully pushes users further along the funnel.
Heat maps are great, but they need context
For instance, if your heat maps indicate one of your CTAs receives only a few or zero taps, now what? You’ll need additional information to understand why. Luckily, this is where UXCam's powerful analytic features and functionality step in to fill in the knowledge gaps and deliver the whole story.


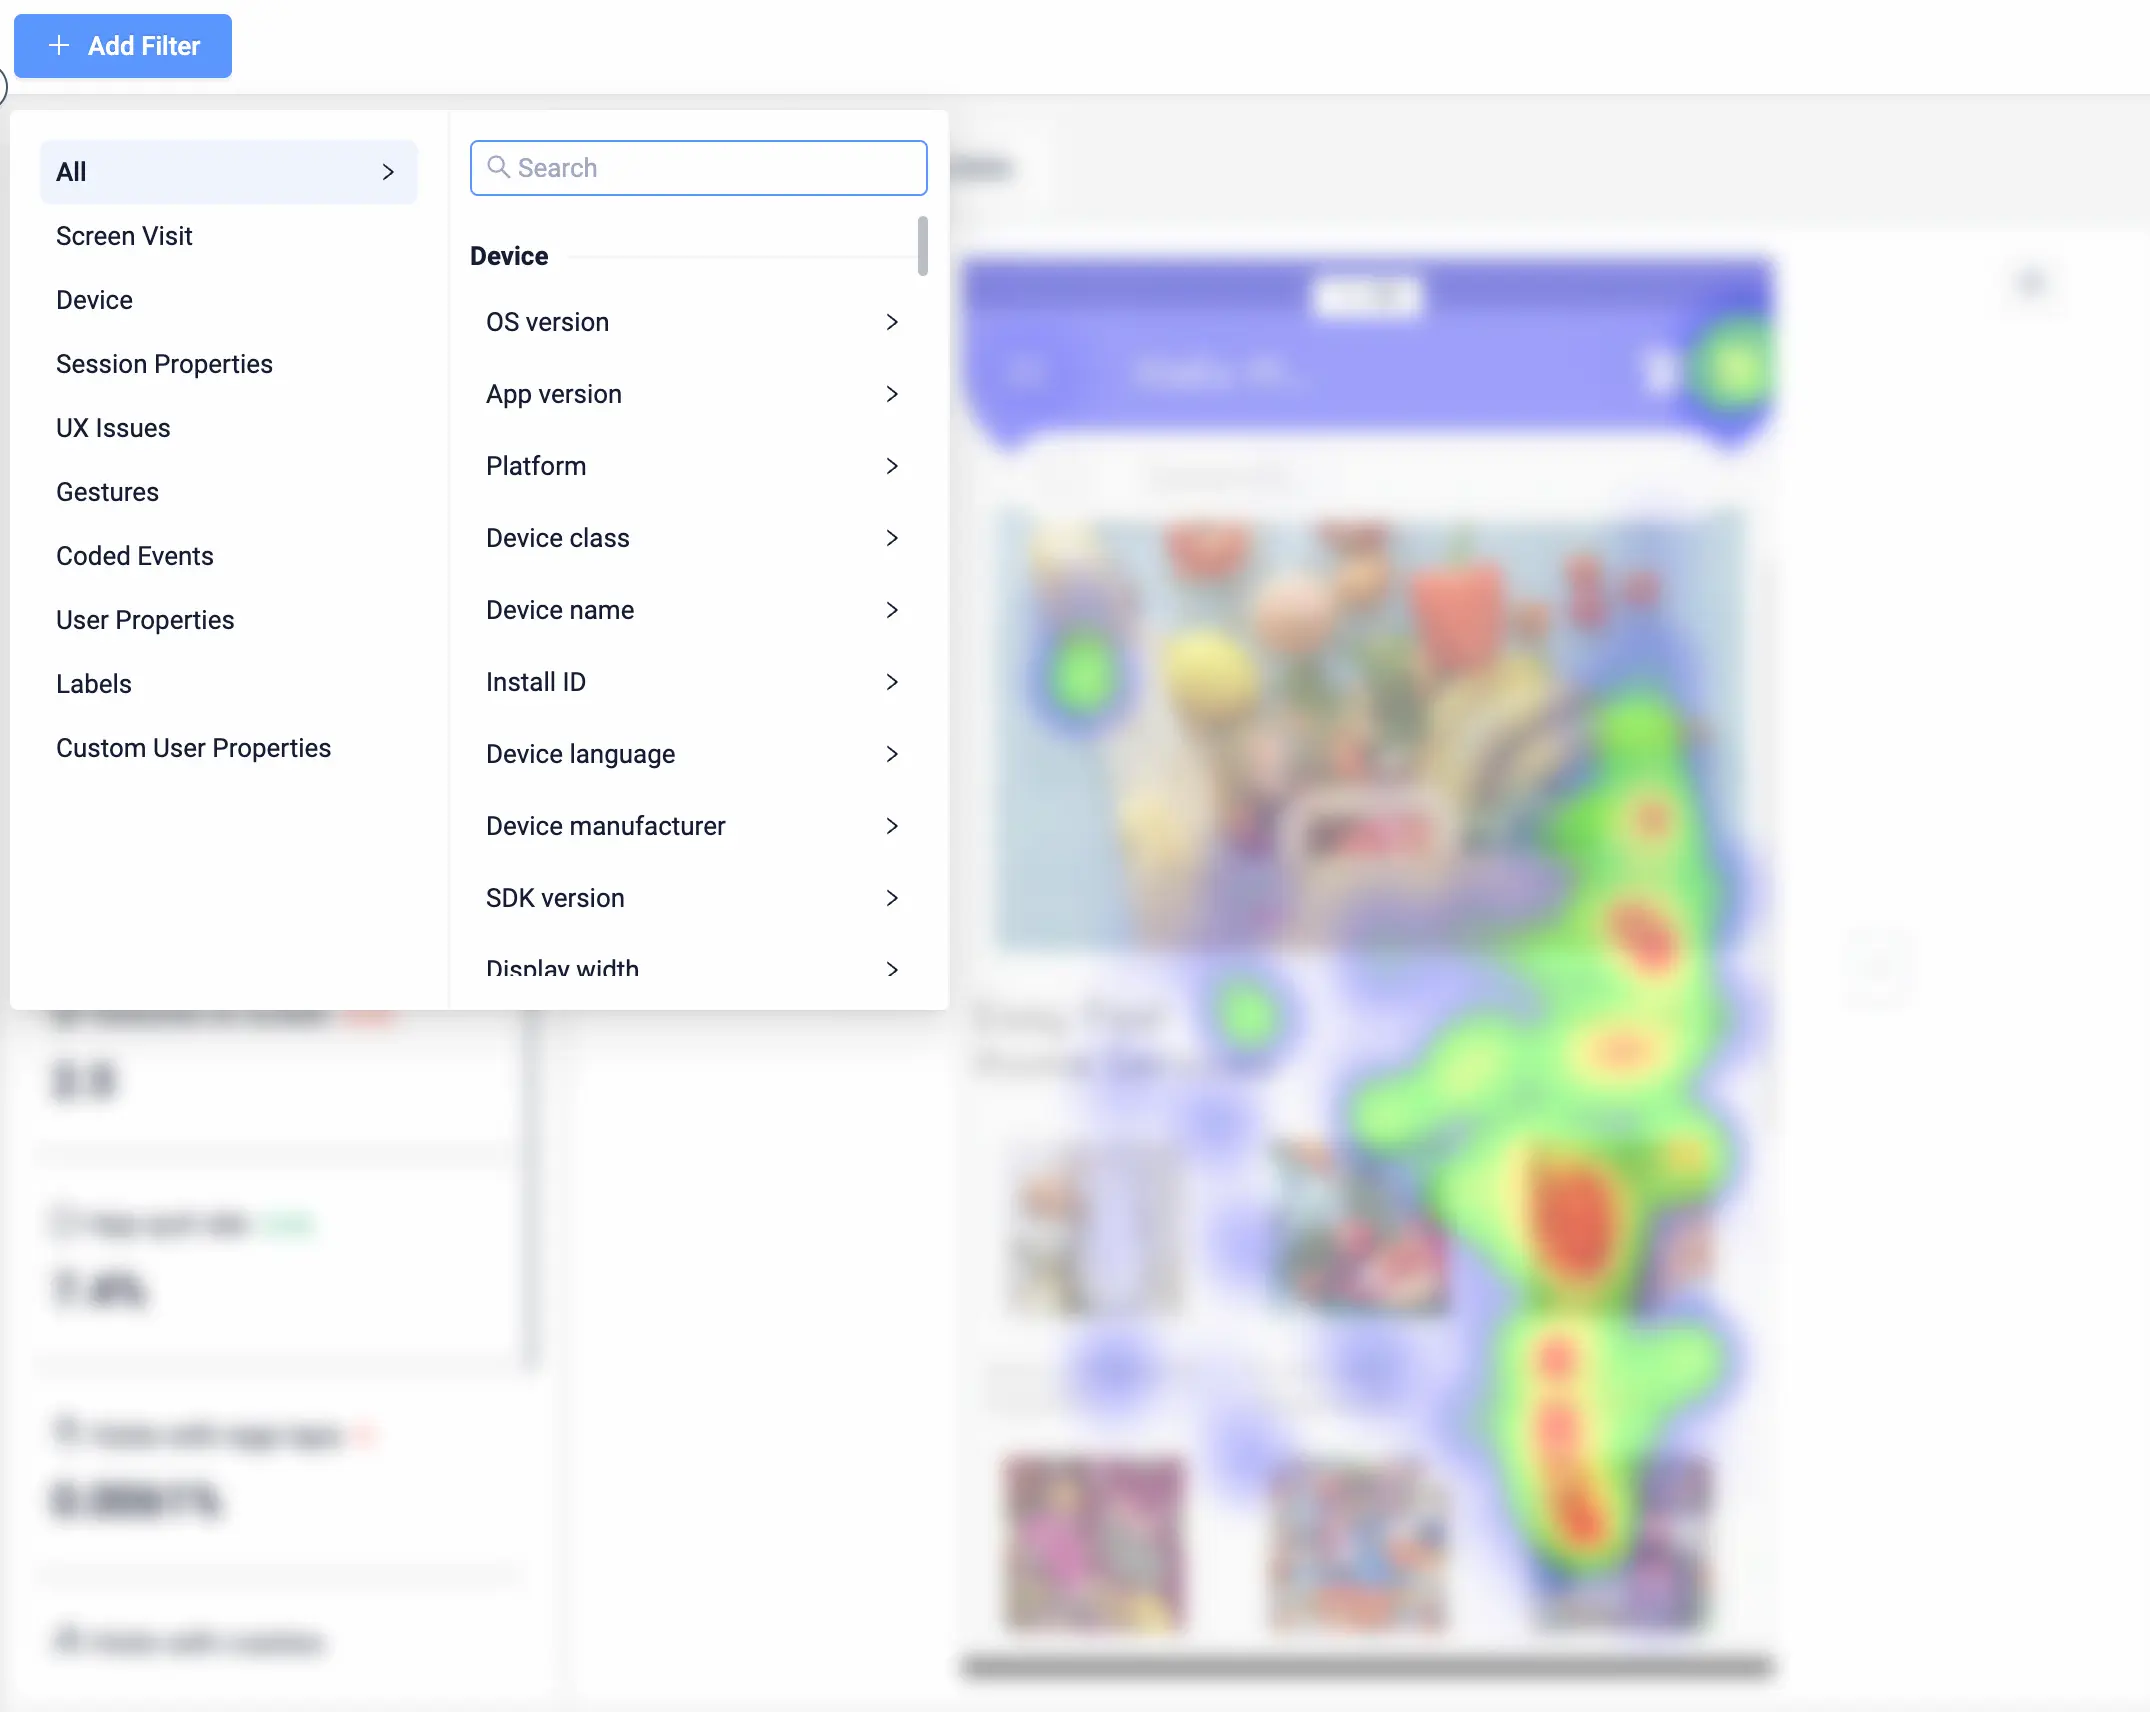
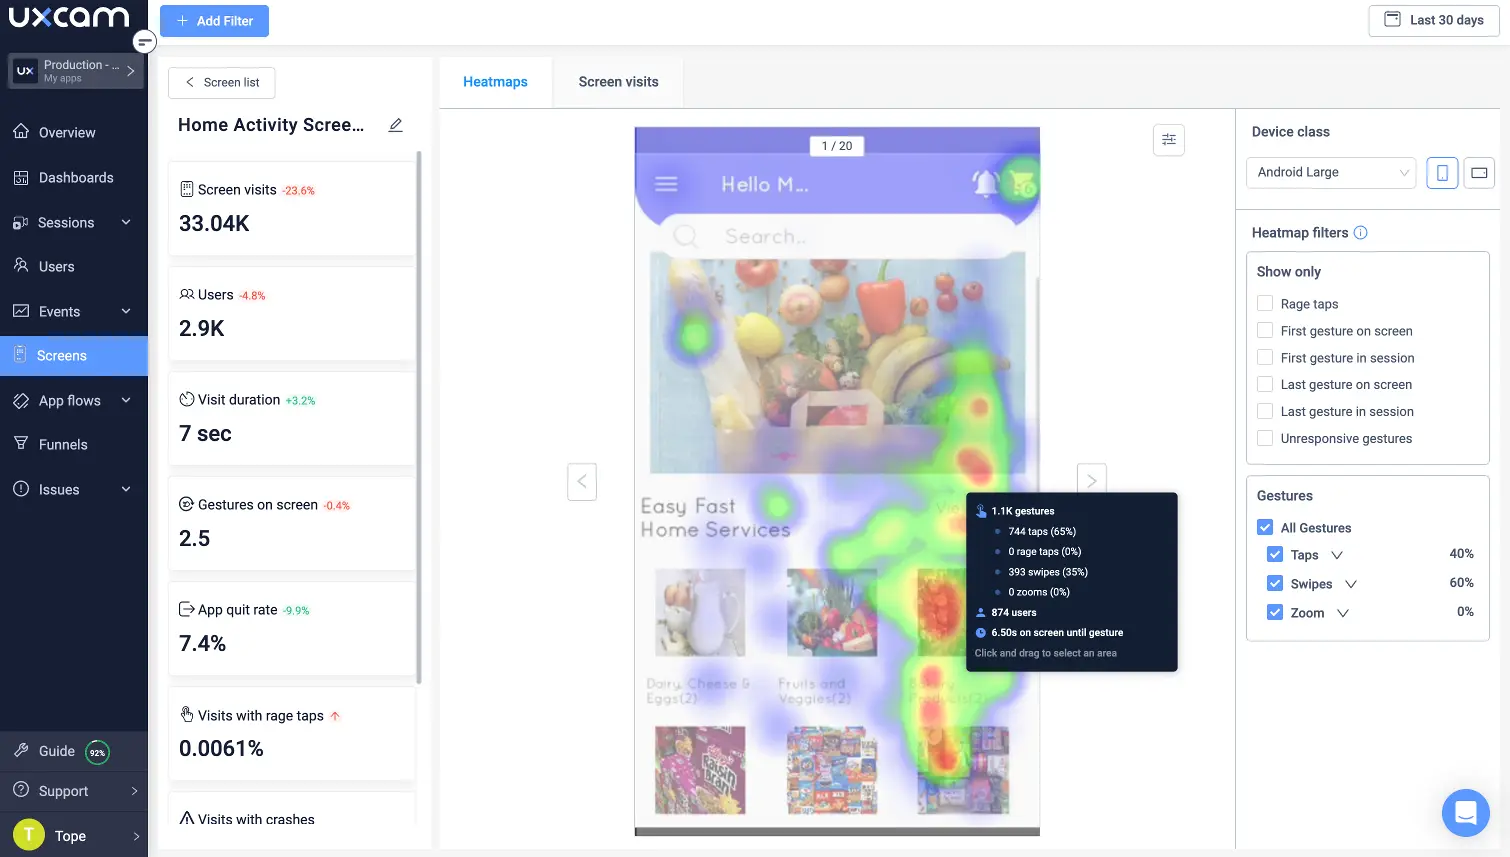
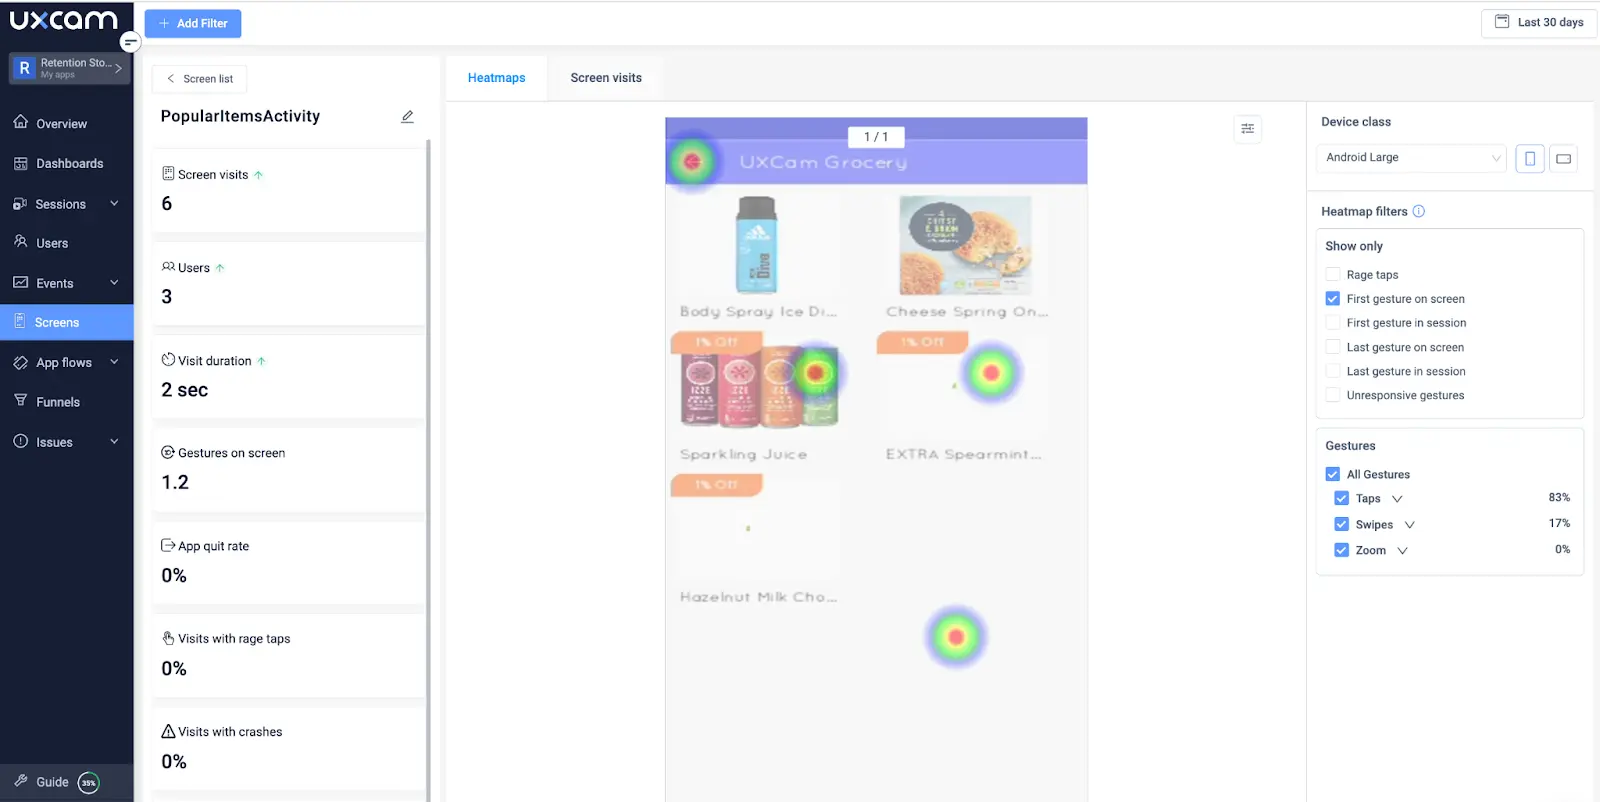
UXCam’s interactive heatmaps show you accompanying session replays, including micro-interactions and the journey leading up to conversion failure. Our powerful property filters allow you to filter heatmaps by specific properties such as device type. Use our filters to see the sessions that cause users frustration. We segment data so you’ll learn which group of people a behavior pattern is common for.
Types of heat maps for mobile apps with examples
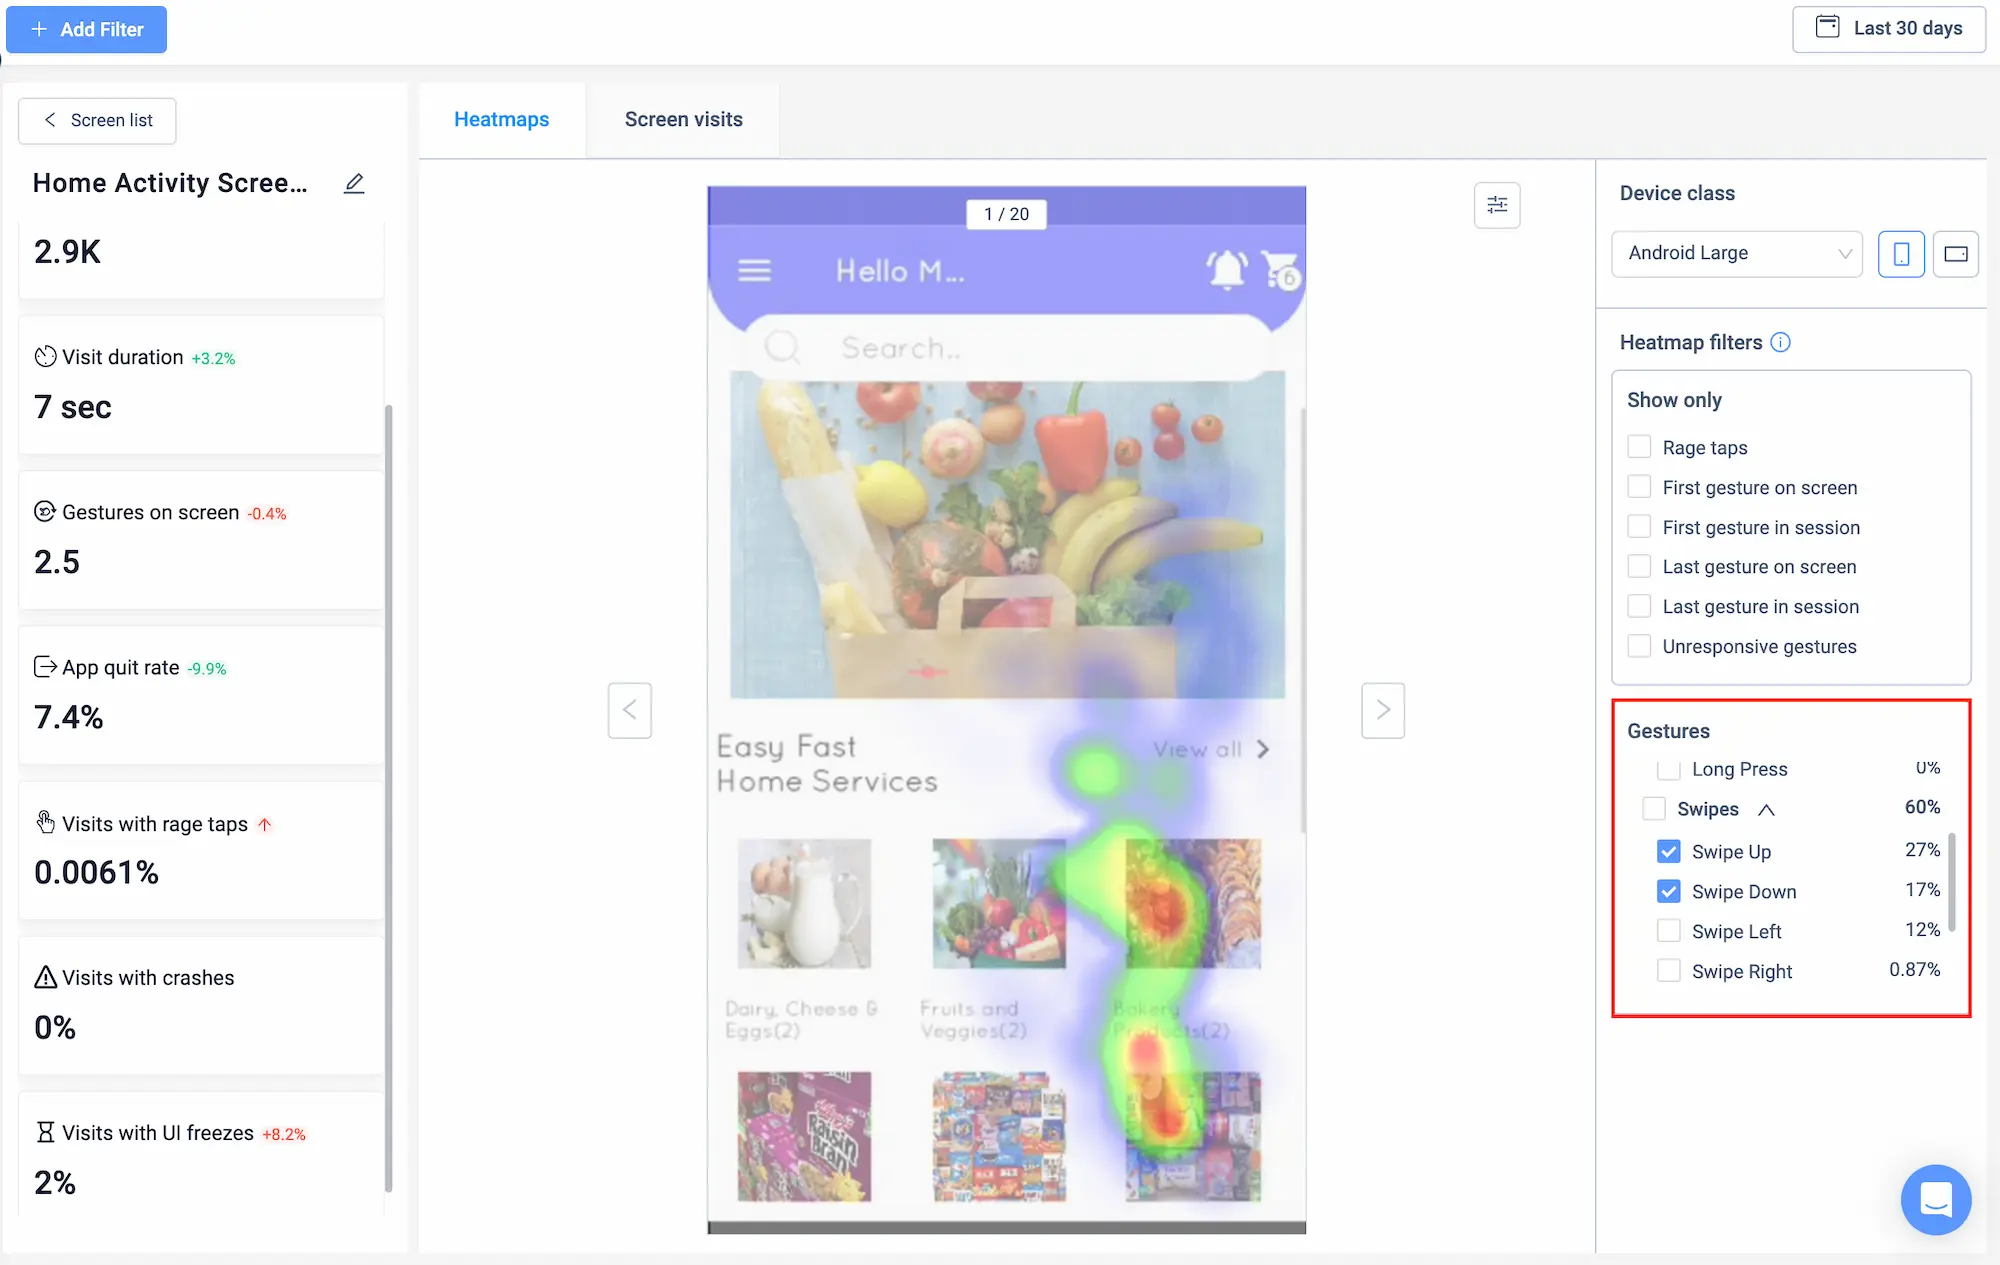
Scroll heat maps
Scroll maps highlight the percentage of people who scroll down to any area on the length of a screen. This type highlights the most viewed sections rather than the most tapped elements.
Scroll heat map data can help you determine the best page lengths for higher conversions. You’ll learn whether your users see essential elements; results will help you decide the best positions for CTAs.


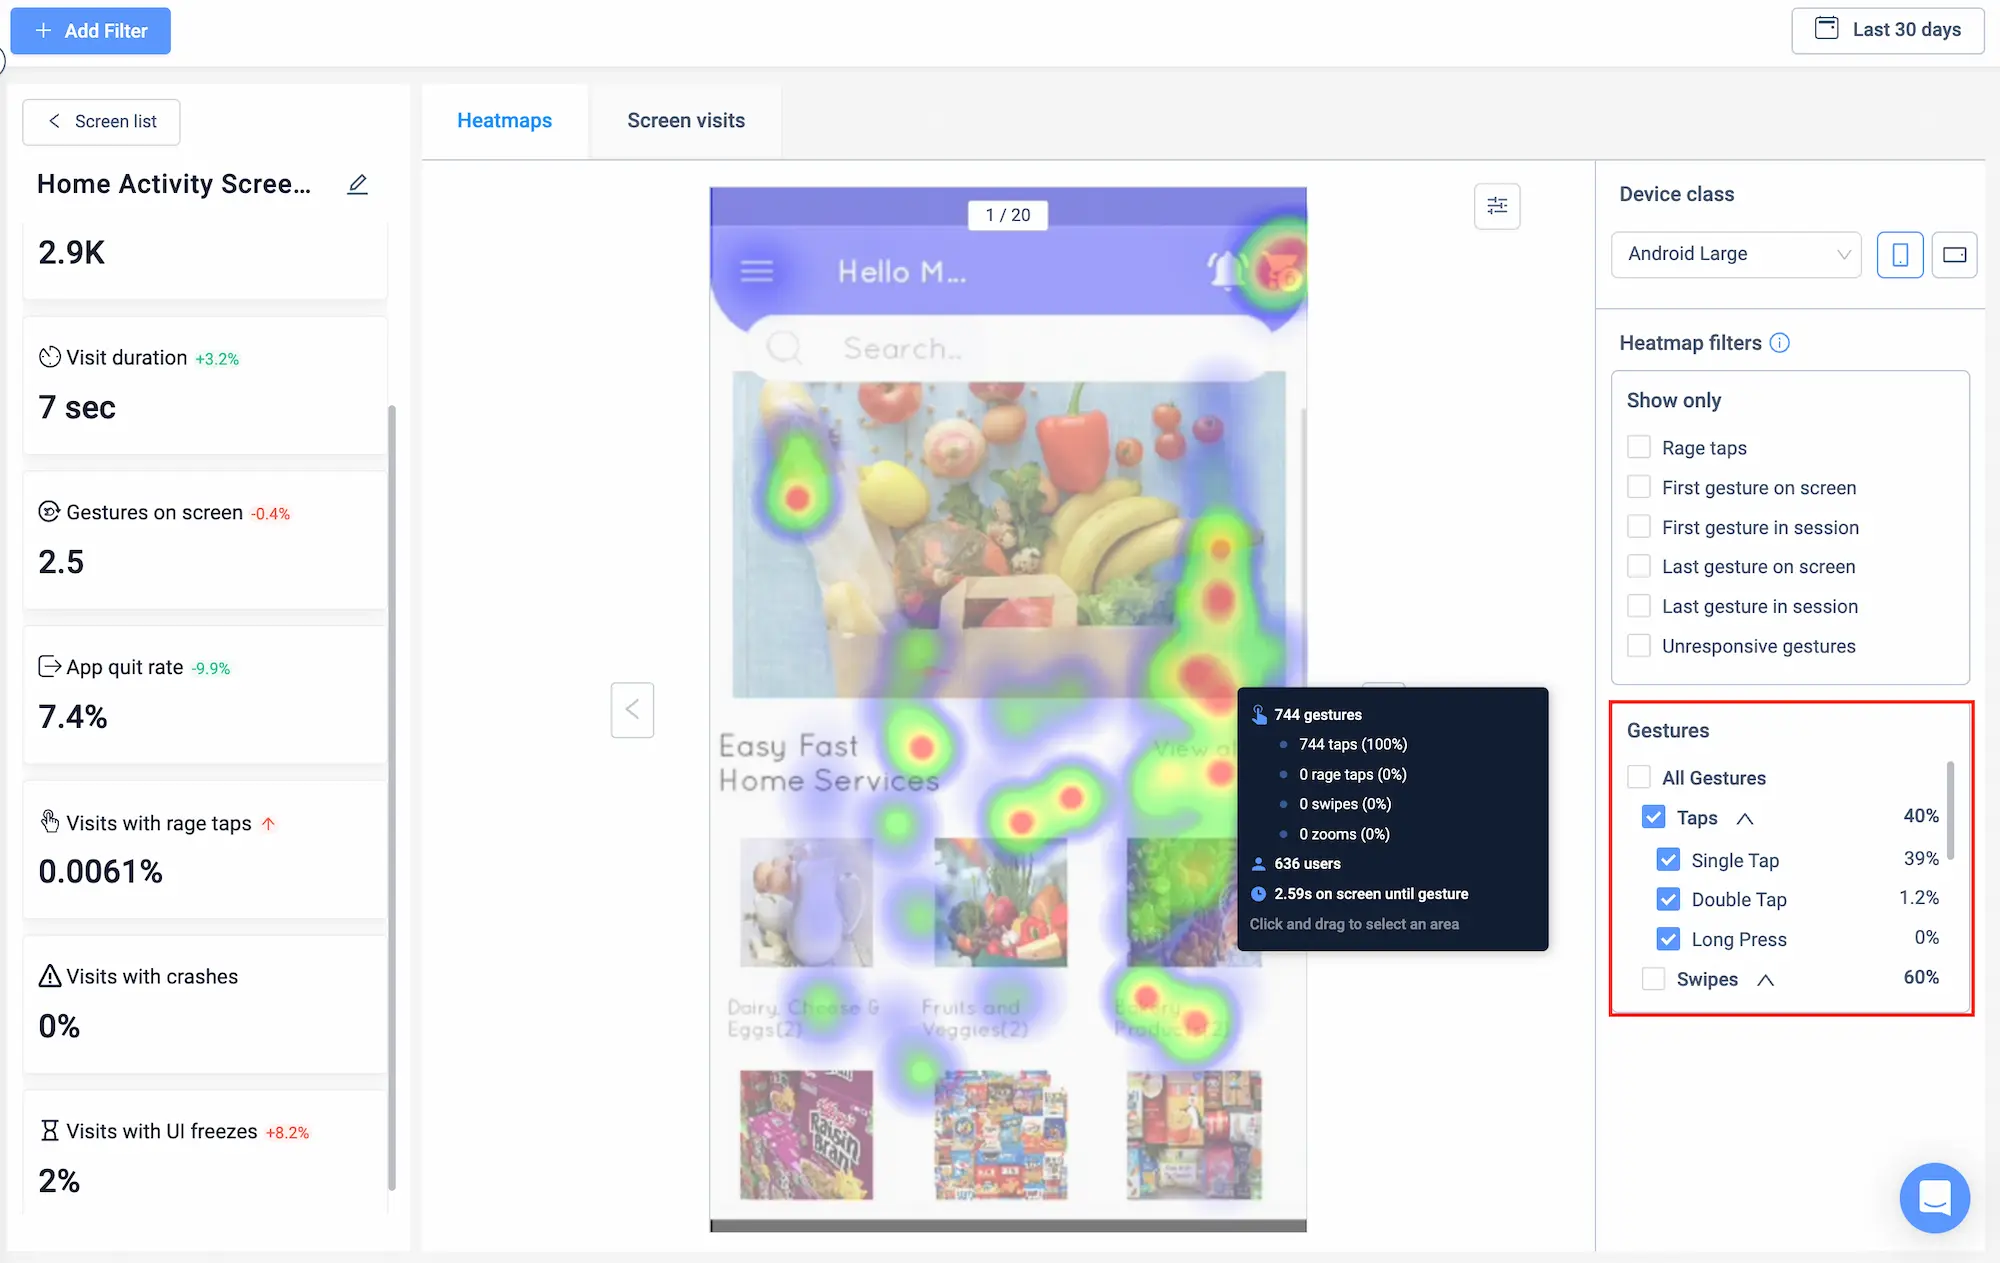
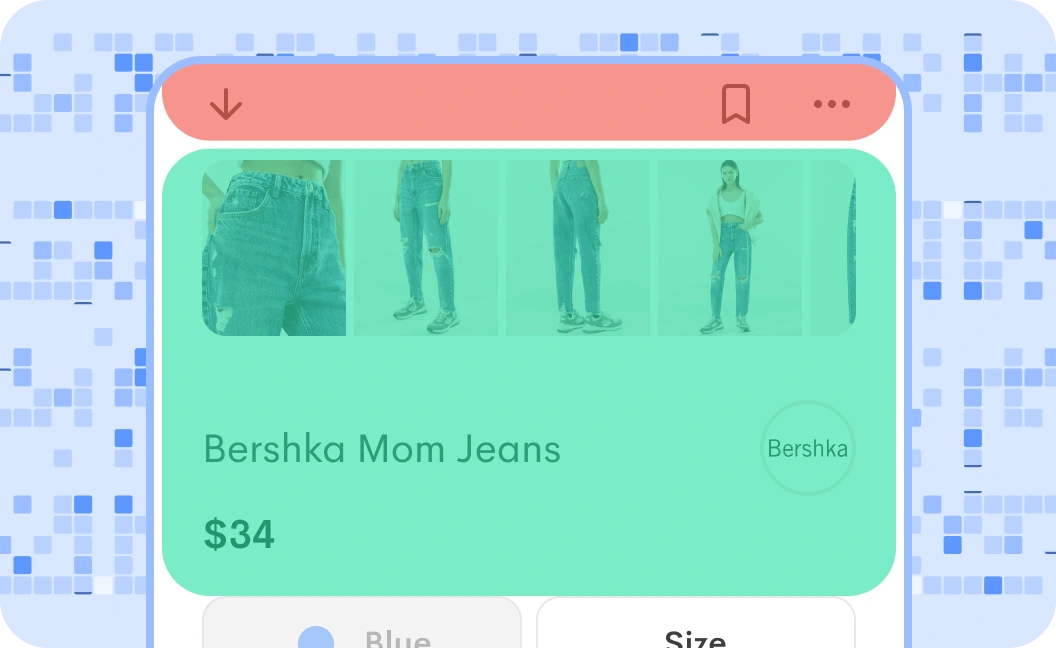
Click heat maps
Click heat maps identify where your users tap the most and least. This type is the most popular and helps you better understand user interaction, learn the prominent features on each page, and tapping patterns.
Additionally, you’ll see the CTAs with the best click-through rate and any non-clickable elements that users commonly mistaken for hyperlinks.


First-touch heat maps
See where users intuitively tap first. This benefits you in understanding how usable your design is and whether the first step to achieving a goal is clear.
An easy-to-use app is one of the reasons users stay, and the “first click test” is a famous usability test. A study showed that if a participant’s first click is correct, they’d have an 87% chance of completing their goal. However, when the first click was incorrect, less than half the people in the study were able to complete the task.


Rage click heat maps
When users repeatedly or quickly tap on an element, this frustration is known as “rage clicks” or “rapid-fire clicks.” Rage clicks generally happen when users mistake static elements for hyperlinks. Still, in this scenario, it causes frustration instead of the user accepting it does nothing and moves on without bother.
Rage taps can also happen when there’s a performance problem. If an element takes a while to respond and results in the screen crashing or an error. UXCam’s issue analytics supports teams in delivering optimal performance. Technical issues are tracked and addressed to maintain good UX.
Rage clicks are red flags; you must pinpoint what causes frustrations, especially if the behavior is common.


Use UXCam for a 360-degree understanding of user behavior
Heat maps represent the highest and lowest areas of engagement on your screens. The data is vital for insight like learning your most and least effective CTA’s, what confuses users, and whether your design changes to address issues have worked. Heat maps are a great starting point for behavior analysis.
At UXCam, our heat mapping feature includes the heat map types you need better to understand user behavior, including landscape or portrait mode heat maps, to ensure interaction for both experiences is captured. Additionally, we add more context to heat maps by providing corresponding session replays to view the entire journey from the user's perspective.
Ready to see why thousands of leading mobile app brands always choose us for their behavior analytics? You can begin reaping these benefits immediately by starting your free trial today. You might also be interested in these;
Best heatmap software for Mobile Apps
Tried and Tested Heatmap Tools for web and mobile
Mobile App Session Replay: Ultimate guide
Top Mobile app KPI dashboards: How to use them (with EXAMPLES) Mobile app heatmaps: The ultimate guide
AUTHOR
Tope Longe
Product Analytics Expert
Ardent technophile exploring the world of mobile app product management at UXCam.


Related articles


Curated List
Best 15 Heatmap Analysis Tool for Web and Mobile Apps in 2026
Discover the best heatmap analysis tools and how these platforms help teams visualize user behavior and improve UX across mobile, web, and hybrid...


Begüm Aykut
Growth Marketing Manager


Heatmaps
Mobile App Heatmaps: Ultimate Guide 2026
Get a complete guide to mobile heatmaps, how they work, the gestures they track, and how to analyze them to improve...


Jonas Kurzweg
Product Analytics Expert

Heatmaps
Examples of Heat Maps and What the Data Means
Learn how to interpret mobile app heat maps, understand key patterns, and what the data reveals about user interactions and...
Tope Longe
Product Analytics Expert