7 must-know mobile app analytics best practices

Mobile app analytics is the process of measuring, collecting, analyzing, and reporting data about mobile app usage. This information can be used to understand how users interact with an app and make decisions about improving the app.
There are many tools and services available to help with mobile app analytics. These tools can track data automatically and provide detailed reports and visualizations to help make sense of the data. The most popular mobile app analytics tools include UXCam, Firebase, Flurry, and Mixpanel.
Best mobile app analytics best practices
In this article, you will learn best practices on how to use these mobile app analytics tools.
Identify the right KPIs
Key performance indicators, or KPIs, are metrics that are used to measure the performance of a mobile app. These metrics can be used to track how well the app is performing and to identify areas for improvement. Identifying the right KPIs for a mobile app is an important step in understanding user behavior and making data-driven decisions to improve the app's performance.
Here are the best practices you can use to identify the right KPIs to track for your mobile app:
Identify your app's main goals and objectives: Your KPIs should align with the goals and objectives of your app, such as increasing user engagement, boosting revenue, or acquiring new users.
Analyze your app's user behavior: Look at how users interact with your app, such as which features they use the most, how long they spend on the app, and what actions they take. This can help you identify which metrics are most important to track.
Research industry benchmarks: Look at the KPIs that are commonly tracked in your app's industry to get an idea of what metrics are considered important and relevant.
Consult with experts: You can also consult with experts in the field or other app developers to get their perspectives on what KPIs are important to track.
Test and iterate: Once you have a set of KPIs that you want to track, you should test them and see how they perform, and then iterate as needed.
Set specific, measurable, and achievable goals
It's a best practice to set specific, measurable, and achievable goals for your mobile app. This is an important step in the app optimization process. These goals can help to guide the development of the app and ensure that it meets the needs of its users.
When setting goals for your mobile app, it's important to be specific. Instead of setting a general goal like "improve user engagement", set a specific goal like "increase the average session duration by 50% within the next three months." Specific goals are clear and easy to understand, making it easier to track progress and measure success.
Measurable goals are those that can be quantified. For example, if your goal is to increase the average session duration by 50%, you can measure success by tracking the average session duration before and after making changes to the app. Measurable goals make it easy to track progress and determine if the goal has been met.
Achievable goals are those that are realistic and can be accomplished within a certain timeframe. For example, if your goal is to increase the average session duration by 50% within the next three months, it should be achievable if you make changes to the app that will improve user engagement. It's important to set achievable goals so that you can work towards them and achieve success.
Ensure that the goals are aligned with your business objectives. For example, if your goal is to increase the average session duration by 50%, it should be aligned with your business objective of increasing user engagement and retention.
Review and adjust goals regularly. For example, if you set a goal to increase the average session duration by 50% within the next three months, you should review the progress towards that goal every month and adjust it as needed.
Overall, setting specific, measurable, and achievable goals for your mobile app is an important step in the app development process. These goals can help to guide the development of the app and ensure that it meets the needs of its users. By regularly reviewing and adjusting the goals, you can ensure that the app is on track to achieving success.
How UXCam helps to achieve your goals
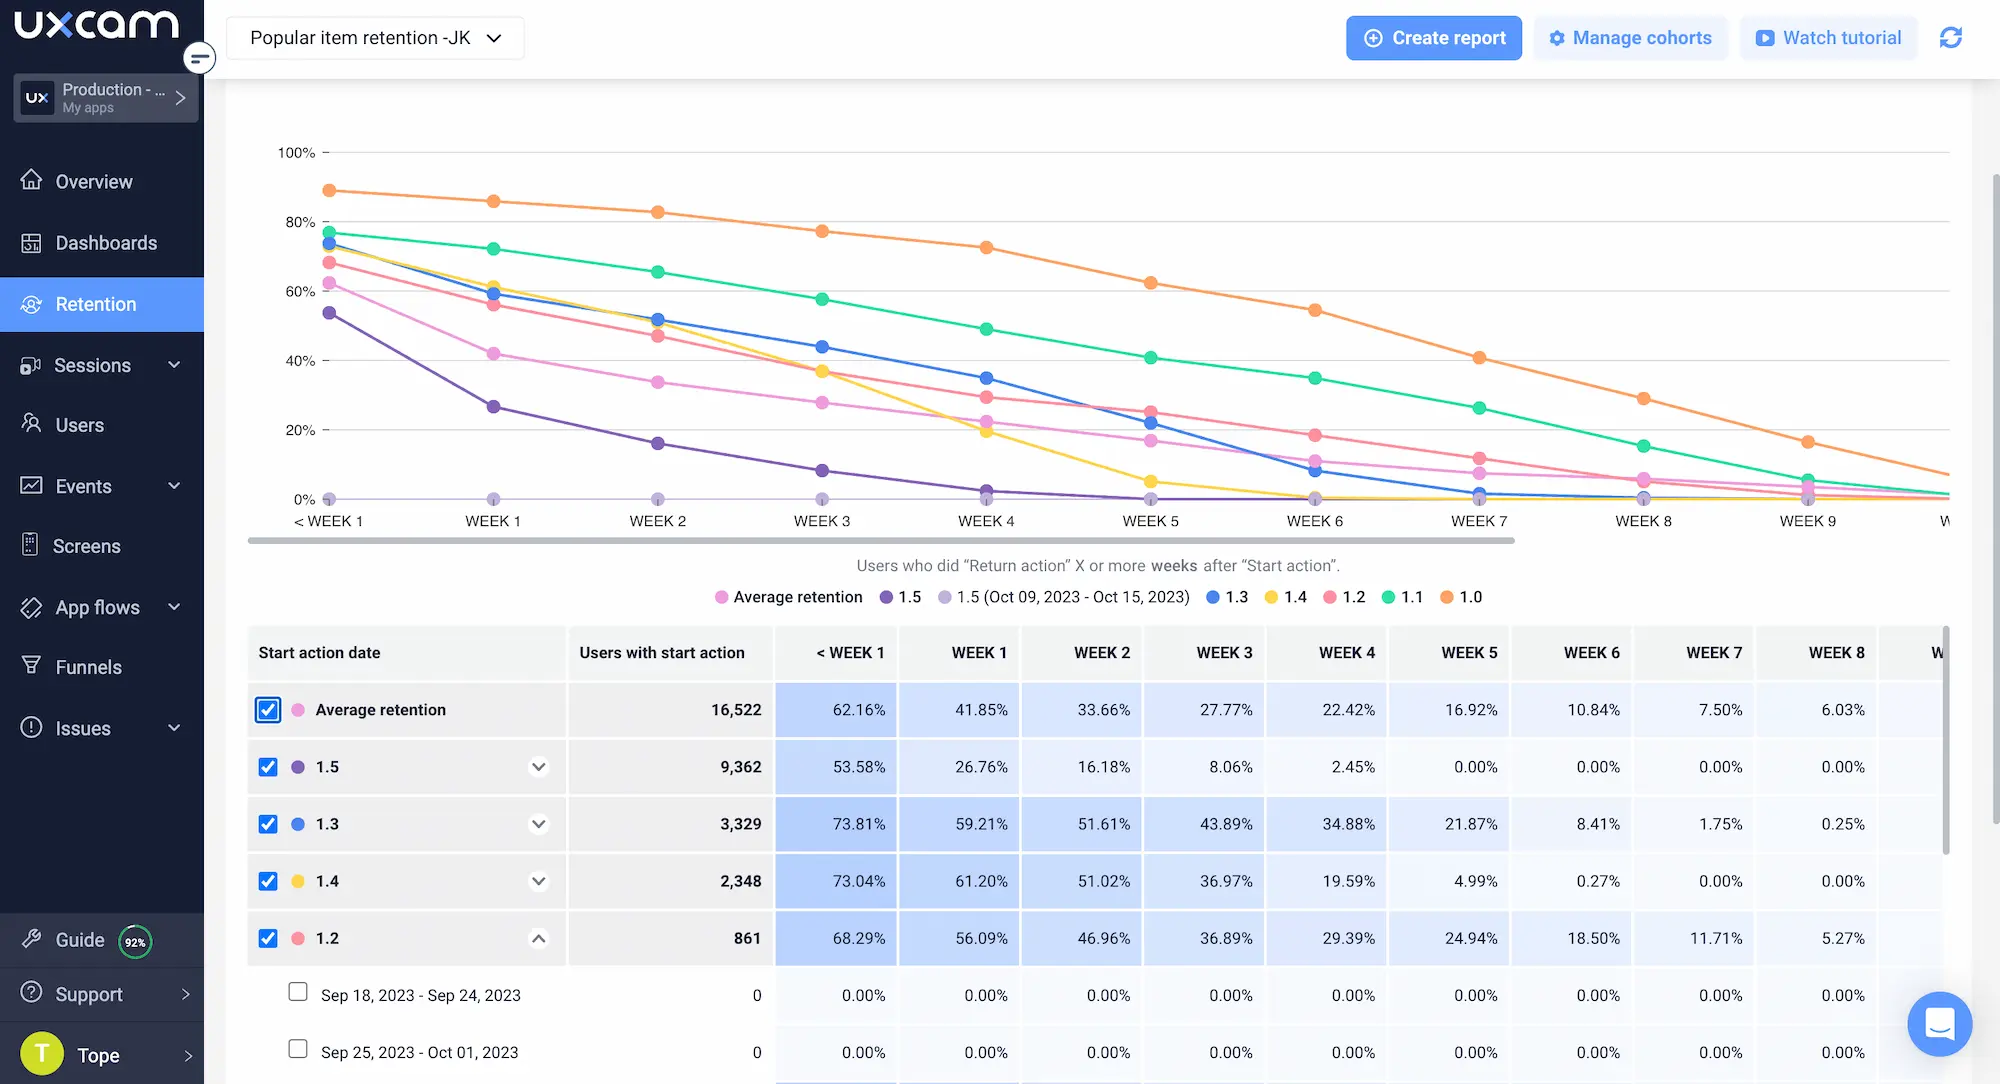
One tool that can help achieve those goals for your mobile app is UXCam. It is a mobile app analytics tool that enables developers and product managers to understand how users interact with their mobile apps. With UXCam, you can track key metrics such as user engagement, session duration, and conversion rate, and use that data to identify areas for improvement.


UXCam allows you to record user sessions and replay them to understand how users interact with the app. This can provide insights into how users engage with different features and which features are most popular.


Additionally, it can also help to identify usability issues, such as confusing navigation or hard-to-find buttons, which can be addressed to increase user engagement and retention.


Moreover, it also provides heatmap and funnels that help to identify the most used areas of the app, where users are dropping off, and where they are facing difficulty. This information can be used to optimize the app's user interface and improve the user experience.
In summary, UXCam can help in achieving the specific, measurable, and achievable goals for mobile app by providing insights into user behavior, identifying usability issues, and helping to optimize the app's user interface. With the help of this tool, developers and product managers can make data-driven decisions to improve the app's performance and increase user engagement and retention.
You can get started with UXCam for free.
Understand data visualization
Data visualization tools are used to create graphical representations of data, making it easier to understand and analyze large amounts of information. These tools can be used to create charts, graphs, and other visualizations that can help to identify patterns, trends, and outliers in the data.
There are many different types of data visualization tools available, including bar charts, line charts, pie charts, and scatter plots. These tools can be used to visualize data in different ways, depending on the type of data being analyzed and the information that needs to be conveyed. Here are the best practices on how to use data visualization for your mobile app analytics tools:
Bar charts are often used to compare data across different categories. They can be used to compare the number of users for different versions of an app or the number of purchases made on different days of the week.
Line charts, on the other hand, are often used to track changes over time. They can be used to track the number of users over time or the revenue generated by an app over time.
Pie charts are useful for showing the proportion of different data categories. They can be used to show the proportion of revenue generated by different products or the proportion of users who have completed a specific task.
Scatter plots are used to show the relationship between two different variables. They can be used to show the relationship between the number of users and the revenue generated by an app, for example.
Another important aspect of data visualization tools is the ability to filter and drill down the data. This feature enables the user to focus on specific aspects of the data and analyze it in more detail. Additionally, most of the data visualization tools also provide the ability to export the data in different formats such as CSV or Excel for further analysis.
In conclusion, data visualization tools are an essential part of analyzing large amounts of data. They can be used to create graphical representations of data that make it easier to understand and identify patterns, trends, and outliers. By using different types of visualization tools, like bar charts, line charts, pie charts, and scatter plots, and with the ability to filter and drill down data, you can make more informed decisions based on the data.
Find patterns and trends in user behavior
Identifying patterns and trends in user behavior is an important step in understanding how users interact with a mobile app. This information can be used to make decisions about how to improve the app and increase user engagement.
How to find patterns and trends in user behavior
One way to identify patterns and trends in user behavior is by tracking key metrics such as the number of active users, session duration, and conversion rate. By tracking these metrics over time, you can identify patterns in how users interact with the app. For example, if you notice that the number of active users is highest on weekends, you can make decisions about how to engage users during that time.
Another way to identify patterns and trends in user behavior is by analyzing user feedback. By reading user reviews and collecting feedback through surveys, you can understand how users feel about the app and identify areas for improvement. For example, if a lot of users are mentioning that the app is difficult to navigate, you can make decisions about how to improve the navigation.
Data visualization tools can also be used to identify patterns and trends in user behavior. By creating charts, graphs, and other visualizations of the data, you can quickly identify patterns and trends that may not be immediately obvious when looking at raw data.
Additionally, user session replay is also a valuable tool for identifying patterns and trends in user behavior. It allows you to see how users interact with the app in real-time and identify areas where they may be struggling or getting confused.


It's important to note that identifying patterns and trends in user behavior is an ongoing process. As the app evolves and more data is collected, it's important to regularly review the data and identify new patterns and trends.
Identifying patterns and trends in user behavior is an essential step in understanding how users interact with a mobile app. By tracking key metrics, analyzing user feedback, using data visualization tools, and reviewing user session replay, you can identify areas for improvement and make decisions about how to increase user engagement. This process should be ongoing and regularly reviewed as the app and user behavior evolves.
Integrate with third-party tools
One way to integrate analytics tools with third-party tools is by using APIs (Application Programming Interfaces). APIs allow different software programs to communicate with each other, enabling the sharing of data and functionality. By using APIs, analytics tools can be integrated with third-party tools such as customer relationship management (CRM) systems, marketing automation platforms, and e-commerce platforms.
Another way to integrate analytics tools with third-party tools is by using data connectors. Data connectors are pre-built integrations that allow analytics tools to connect to third-party tools, enabling the sharing of data and functionality. Data connectors can be used to integrate analytics tools with tools such as social media platforms, web analytics platforms, and email marketing platforms.
It's important to note that, when integrating analytics tools with third-party tools, it's important to consider data privacy, security, and compliance. Make sure that the data is being transferred and stored securely, and that the use of data complies with the relevant data privacy regulations.
Integrating analytics tools with third-party tools can help to improve the performance of a mobile app by providing a more comprehensive view of user behavior. By using APIs or data connectors, developers and businesses can gain a deeper understanding of user behavior, identify areas for improvement, and make more informed decisions about how to improve the app. Additionally, it's important to consider the data privacy, security, and compliance while integrating analytics tools with third-party tools.
Use analytics to inform A/B testing and experimentation
A/B testing is a method of comparing two versions of a mobile app to see which one performs better. By testing different versions of the app, you can make more informed decisions about which changes to make to improve the app's performance. Analytics can play a vital role in informing A/B testing and experimentation.
Use analytics to inform A/B testing by analyzing user feedback. By reading user reviews and collecting feedback through surveys, you can understand how users feel about the app and identify areas for improvement. For example, if a lot of users are mentioning that the app is difficult to navigate, you can use this feedback to guide your A/B testing and experiment with different navigation solutions.
Data visualization tools can also be used to inform A/B testing. By creating charts, graphs, and other visualizations of the data, you can quickly identify patterns and trends that may not be immediately obvious when looking at raw data. This information can be used to guide which features or aspects of the app to test during A/B testing.
It's also important to consider the sample size and duration of the A/B test. A small sample size or a short duration test may not provide enough data to make accurate conclusions. By using analytics, you can determine the optimal sample size and duration for your A/B test to ensure that you have enough data to make accurate conclusions.
Using analytics to inform A/B testing and experimentation is an essential step in improving the performance of a mobile app. By identifying which features or aspects of the app are most important, analyzing user feedback, using data visualization tools, and determining the optimal sample size and duration, you can make more informed decisions about which changes to make to improve the app. This process should be ongoing and regularly reviewed as the app and user behavior evolves.
Continuously monitor user flows
Continuously monitoring and adjusting app features and user flows is an important step in maintaining and improving the performance of a mobile app. By regularly monitoring and adjusting the app, you can ensure that it meets the needs of its users and continues to perform well.
One way to continuously monitor and adjust app features is by tracking key performance indicators (KPIs) such as active users, session duration, and conversion rate. By tracking these metrics over time, you can identify patterns in user behavior and make decisions about which features to improve or remove. For example, if you notice that a certain feature is not being used as much, you can make the decision to remove it or improve it.
Another way to continuously monitor and adjust app features is by analyzing user feedback. By reading user reviews and collecting feedback through surveys, you can understand how users feel about the app and identify areas for improvement. For example, if a lot of users are mentioning that a certain feature is confusing, you can make the decision to remove it or improve it.
It's also important to continuously monitor and adjust user flows. User flows refer to the steps a user takes to complete a task in the app. By understanding how users are navigating through the app, you can identify areas where they may be struggling or getting confused and adjust the user flows accordingly.
Continuously monitoring and adjusting app features and user flows is an essential step in maintaining and improving the performance of a mobile app. By tracking key performance indicators, analyzing user feedback, using data visualization tools, and monitoring user flows, you can ensure that the app meets the needs of its users and continues to perform well. This process should be ongoing and regularly reviewed as the app and user behavior evolves.
Conclusion
When it comes to the impact of mobile analytics best practices on app success, it is enormous. By continuously tracking, analyzing, and optimizing mobile app analytics, developers and businesses can ensure that the app meets the needs of its users, improve user engagement and retention, and ultimately increase the app's success. Additionally, it can also help in identifying new opportunities for growth and revenue generation, making it an essential tool for any mobile app business.
In conclusion, continuously tracking, analyzing, and optimizing mobile app analytics with tools like UXCam is an essential step in ensuring the success of a mobile app.
Related articles
Discover the best 11 Mobile App Analytics Tools A guide to understanding mobile analytics
Comparing the best mobile app analytics tools


Related articles


Mobile app analytics
12 Mobile App Analytics Metrics That Actually Matter in 2026
Mobile app analytics metrics are the quantitative signals product teams use to measure performance, engagement, and...


Silvanus Alt, PhD
Founder & CEO | UXCam


Mobile app analytics
Mobile App Retention Benchmarks by Industry (2026)
Mobile app retention benchmarks for 2026, broken down by industry. Day-1, day-7, day-30 retention rates for fintech, ecommerce, social, gaming, and more,...
Silvanus Alt, PhD
Founder & CEO | UXCam


Mobile app analytics
Sentry vs Datadog: Features, Pricing, and Which One Fits Your Production Stack
Sentry vs Datadog compared head-to-head on features, pricing, and the production stacks each one...
Silvanus Alt, PhD
Founder & CEO | UXCam