7 Astonishing Mobile Ecommerce UX Statistics (Infographic)

Going to the city, walking through different shops and trying to compare different offers can cost time and nerves.
Today it’s quite easy to get what you need on the internet.
When designing an ecommerce app, there are certain aspects you have to keep in mind if you don’t want to lose the customer before he purchases. The following infographic shows 7 astonishing mobile ecommerce UX statistics.


7 Astonishing Mobile Ecommerce UX Statistics
Want to know how to improve your mobile online shopping app? How can you find out if your users are frustrated? Which tools help to analyze your mobile app?
Start using UXCam’s app analytics solution to understand your user behavior.
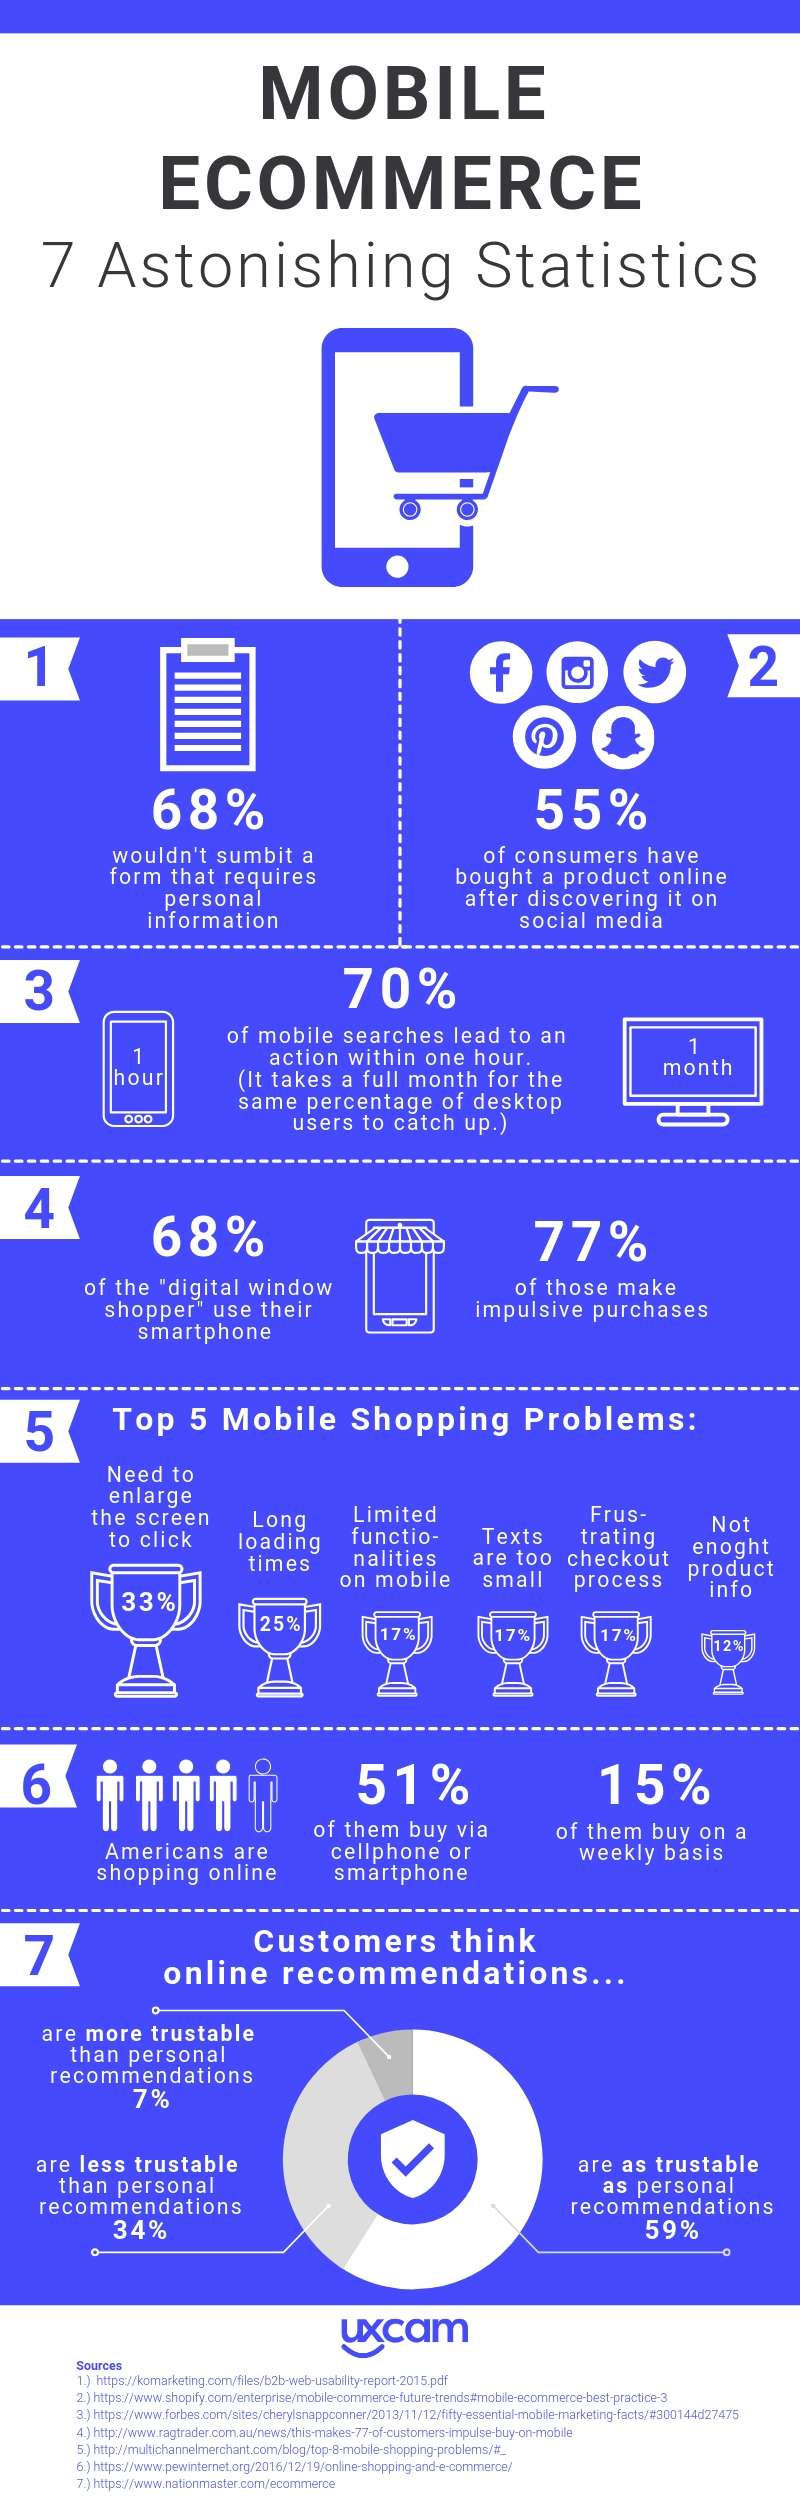
68% of the potential customers wouldn’t submit a form if it requires too much personal information
55% of customers have bought a product online after discovering it on social media
70% of mobile searches lead to action within one hour. (It takes a full month for the same percentage of desktop users to catch up.)
68% of the “digital window shopper” so this on their smartphone for fun
77% of those make impulsive purchases
The Top 5 mobile Shopping Problems:
Need to enlarge the screen to click (33%)
Long page loading time (25%)
Just “full size” version offers all functionalities (17%)
Too small texts (17%)
Frustrating checkout process (17%)
Not enough product information (12%)
4 out of 5 Americans are shopping online
51% of them buy via cellphone or smartphone
15% of them buy on a weekly basis
Customers think online recommendations are:
Related articles:
AUTHOR
Annemarie Bufe
Product Analytics Expert
Passionate hobby dancer. Working at UXCam.


Related articles


Product best practices
12 Apps with Great User Onboarding (2026 Examples)
The 12 mobile app onboarding flows I'd study if I were designing one today, with specific callouts for what each does well, common mistakes, and the...


Silvanus Alt, PhD
Founder & CEO | UXCam


Product best practices
Why creating a data-driven culture has less to do with data than you think
Kishan Gupta, CEO, shares 5 tips and techniques for fostering a data-driven culture based on his own experiences building and leading...


Kishan Gupta
Co-Founder of UXCam


Product best practices
Finance apps have a customer support problem, here's how to fix it
Learn about the customer support problem in finance apps and practical solutions to fix it in our latest blog post, and improve user satisfaction and...


Jane Leung
Product Analytics Expert