G2 32 x 32 White Circle

4.7 STARS ON G2

Try our product analytics for free. No card required.

PUBLISHED13 February, 2019

1 MIN READ

SHARE THIS POST

How to Solve App Usability Issues (Infographic)

BY Annemarie Bufe
SHARE THIS POST
How to Solve App Usability Issues

“32 percent learn about application performance issues from end users” – ManageEngine

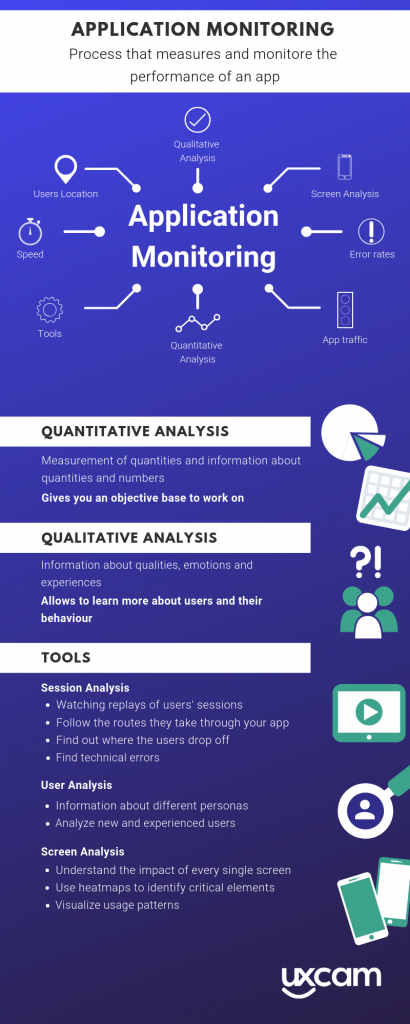
Application Monitoring allows you to analyze your app, find out performance problems and optimize it before your end users are dissatisfied.

With a combination of qualitative and quantitative analysis, you can get the full picture of the users’ experience.

Check out the infographic to get an overview of qualitative and quantitative analysis, as well as tools you can use to measure your app performance.

Application Monitoring tools quantitative vs qualitative analysis infograhic

Do you want to monitor your app onboarding process?

Try UXCam for free!

Related Articles:

AUTHOR

Annemarie Bufe

Product Analytics Expert

Passionate hobby dancer. Working at UXCam.

e0a77d45f2235500f6fb529673354877?s=150&d=identicon&r=g
PUBLISHED 13 February, 2019

Related articles

UX design

User Experience Optimization: 10 Steps to Improve UX in 2026

User experience optimization is the iterative process of removing friction, improving clarity, and raising the conversion and retention signals on a...

Dr. Silvanus Alt
Silvanus Alt, PhD

Founder & CEO | UXCam

UX design

We Reviewed the Top 19 UX Tools for 2026

The 19 best UX tools for 2026, tested across research, wireframing, prototyping, flowcharts, and handoff. Honest pros, cons, and pricing from a...

Dr. Silvanus Alt
Silvanus Alt, PhD

Founder & CEO | UXCam

UX design

Customer Experience Dashboard Examples and the Metrics That Actually Matter

A customer experience dashboard turns scattered signals into one view. See examples, the metrics that matter, and how to build one that drives...

Dr. Silvanus Alt
Silvanus Alt, PhD

Founder & CEO | UXCam

What’s UXCam?

Autocapture Analytics icon
Autocapture Analytics
With autocapture and instant reports, you focus on insights instead of wasting time on setup.
Customizable Dashboards
Create easy-to-understand dashboards to track all your KPIs. Make decisions with confidence.
icon new revenue streams (16)
Session Replay & Heatmaps
Replay videos of users using your app and analyze their behavior with heatmaps.
icon new revenue streams (17)
Funnel Analytics
Optimize conversions across the entire customer journey.
icon new revenue streams (18)
Retention Analytics
Learn from users who love your app and detect churn patterns early on.
icon new revenue streams (19)
User Journey Analytics
Boost conversion and engagement with user journey flows.

Start Analyzing Smarter

Discover why over teams across 50+ countries rely on UXCam. Try it free for 30 days, no credit card required.

Trusted by the largest brands worldwide
naviclassplushousingjulobigbasket