How to Track User Activity on Website - Guide for Product Teams


TABLE OF CONTENTS
- Summary - How to track user behavior on websites
- What is website user tracking?
- How to track user activity on website (Top Techniques)
- Choosing the right tools for web activity monitoring
- How to implement website activity tracking
- Key metrics when tracking user activity in web applications
- Best practices for implementating web app tracking
- How to ensure compliance in web usage tracking
- Conclusion and next steps
Tracking user activity is the key to unlocking a deeper understanding of your website. By focusing on the user journey, you can see how visitors navigate your web app and pinpoint areas for improvement.
Unlike a customer journey, which revolves around sales and marketing, the user journey in web products is about interactions, features, and problem-solving. It’s where you uncover what helps or hinders your users.
When you track user activity, you gain actionable insights to improve the user experience, streamline workflows, and boost conversions. Tools like UXCam for web turn guesswork into data-driven decisions.
Ready to optimize your website and web app? Let’s dive in.
Summary - How to track user behavior on websites
| Technique | Description |
|---|---|
| Click Tracking | Records user clicks on elements such as buttons, links, and images. |
| Scroll Tracking | Monitors how far down the page users scroll to gauge content engagement. |
| Session Recording | Captures user sessions in video format to visually analyze navigation and interaction flows. |
| Heatmaps | Provides visual representation of user activity, showing areas of high and low interaction. |
| Event Tracking | Logs specific actions on the website such as form submissions, downloads, or video plays. |
| Navigation Path Analysis | Tracks the sequence of pages visited to understand user journeys and drop-off points. |
What is website user tracking?
User activity tracking is how you monitor and analyze what users do in your web app. It’s a vital part of product analytics that helps you understand user behavior and improve the way they interact with your product.
By tracking key activities, like clicks, navigation paths, form submissions, rage clicks, and session durations, you gain visibility into the user journey. This journey isn’t just about where users go but also why they make certain decisions—or abandon tasks.
Why it matters
For product managers, it’s the foundation for creating features that users love. You can see where users are getting stuck, prioritize fixes, and align improvements with business goals.
UX designers can use this data to refine layouts and workflows. For instance, if navigation paths show users circling back repeatedly, it’s a signal to simplify or clarify the interface.
Even B2B marketers benefit. Tracking user activity reveals how leads engage with your product, which campaigns convert the most users, and where prospects drop off. This is critical for optimizing funnels and boosting conversions.
How to track user activity on website (Top Techniques)
To truly understand how users interact with your web product, you need to leverage the right tracking methods. Each technique provides a unique lens into user behavior, helping you uncover patterns, identify friction points, and optimize the user journey. Let's dive in.
Click Tracking
Click tracking monitors every interaction users make with clickable elements in your app, such as buttons, links, or tabs. It’s a powerful way to identify which areas capture the most engagement and which are being overlooked.
For example, tracking button clicks in your onboarding flow can show you where users engage actively. If a key “Get Started” button has low engagement, it could indicate unclear placement or a lack of compelling context.
Click tracking helps you answer questions like:
Are users clicking on the right calls-to-action (CTAs)?
Which features attract the most attention?
Are users interacting with elements as expected?
This method ensures your design aligns with user intent and business goals.
Scroll tracking
Scroll tracking monitors how far users scroll down your pages, providing insights into how much of your content is being consumed. This method is invaluable for understanding content engagement and identifying sections where users lose interest or abandon the page.
For example, tracking scroll depth on a long-form article or landing page can reveal whether users are reading all the way to the bottom or dropping off at specific points. If a significant number of users stop scrolling midway, it could indicate that the content is either too dense, poorly formatted, or not engaging enough.
Scroll tracking helps you answer questions like:
Are users reading the content fully or just skimming the top portion of your page?
Which sections of the page are capturing the most attention, and where do users lose interest?
Is there a need to improve content layout or add engaging elements to keep users scrolling?
This method ensures your content strategy aligns with user behavior, enabling you to optimize the layout and presentation for improved engagement and conversion outcomes.
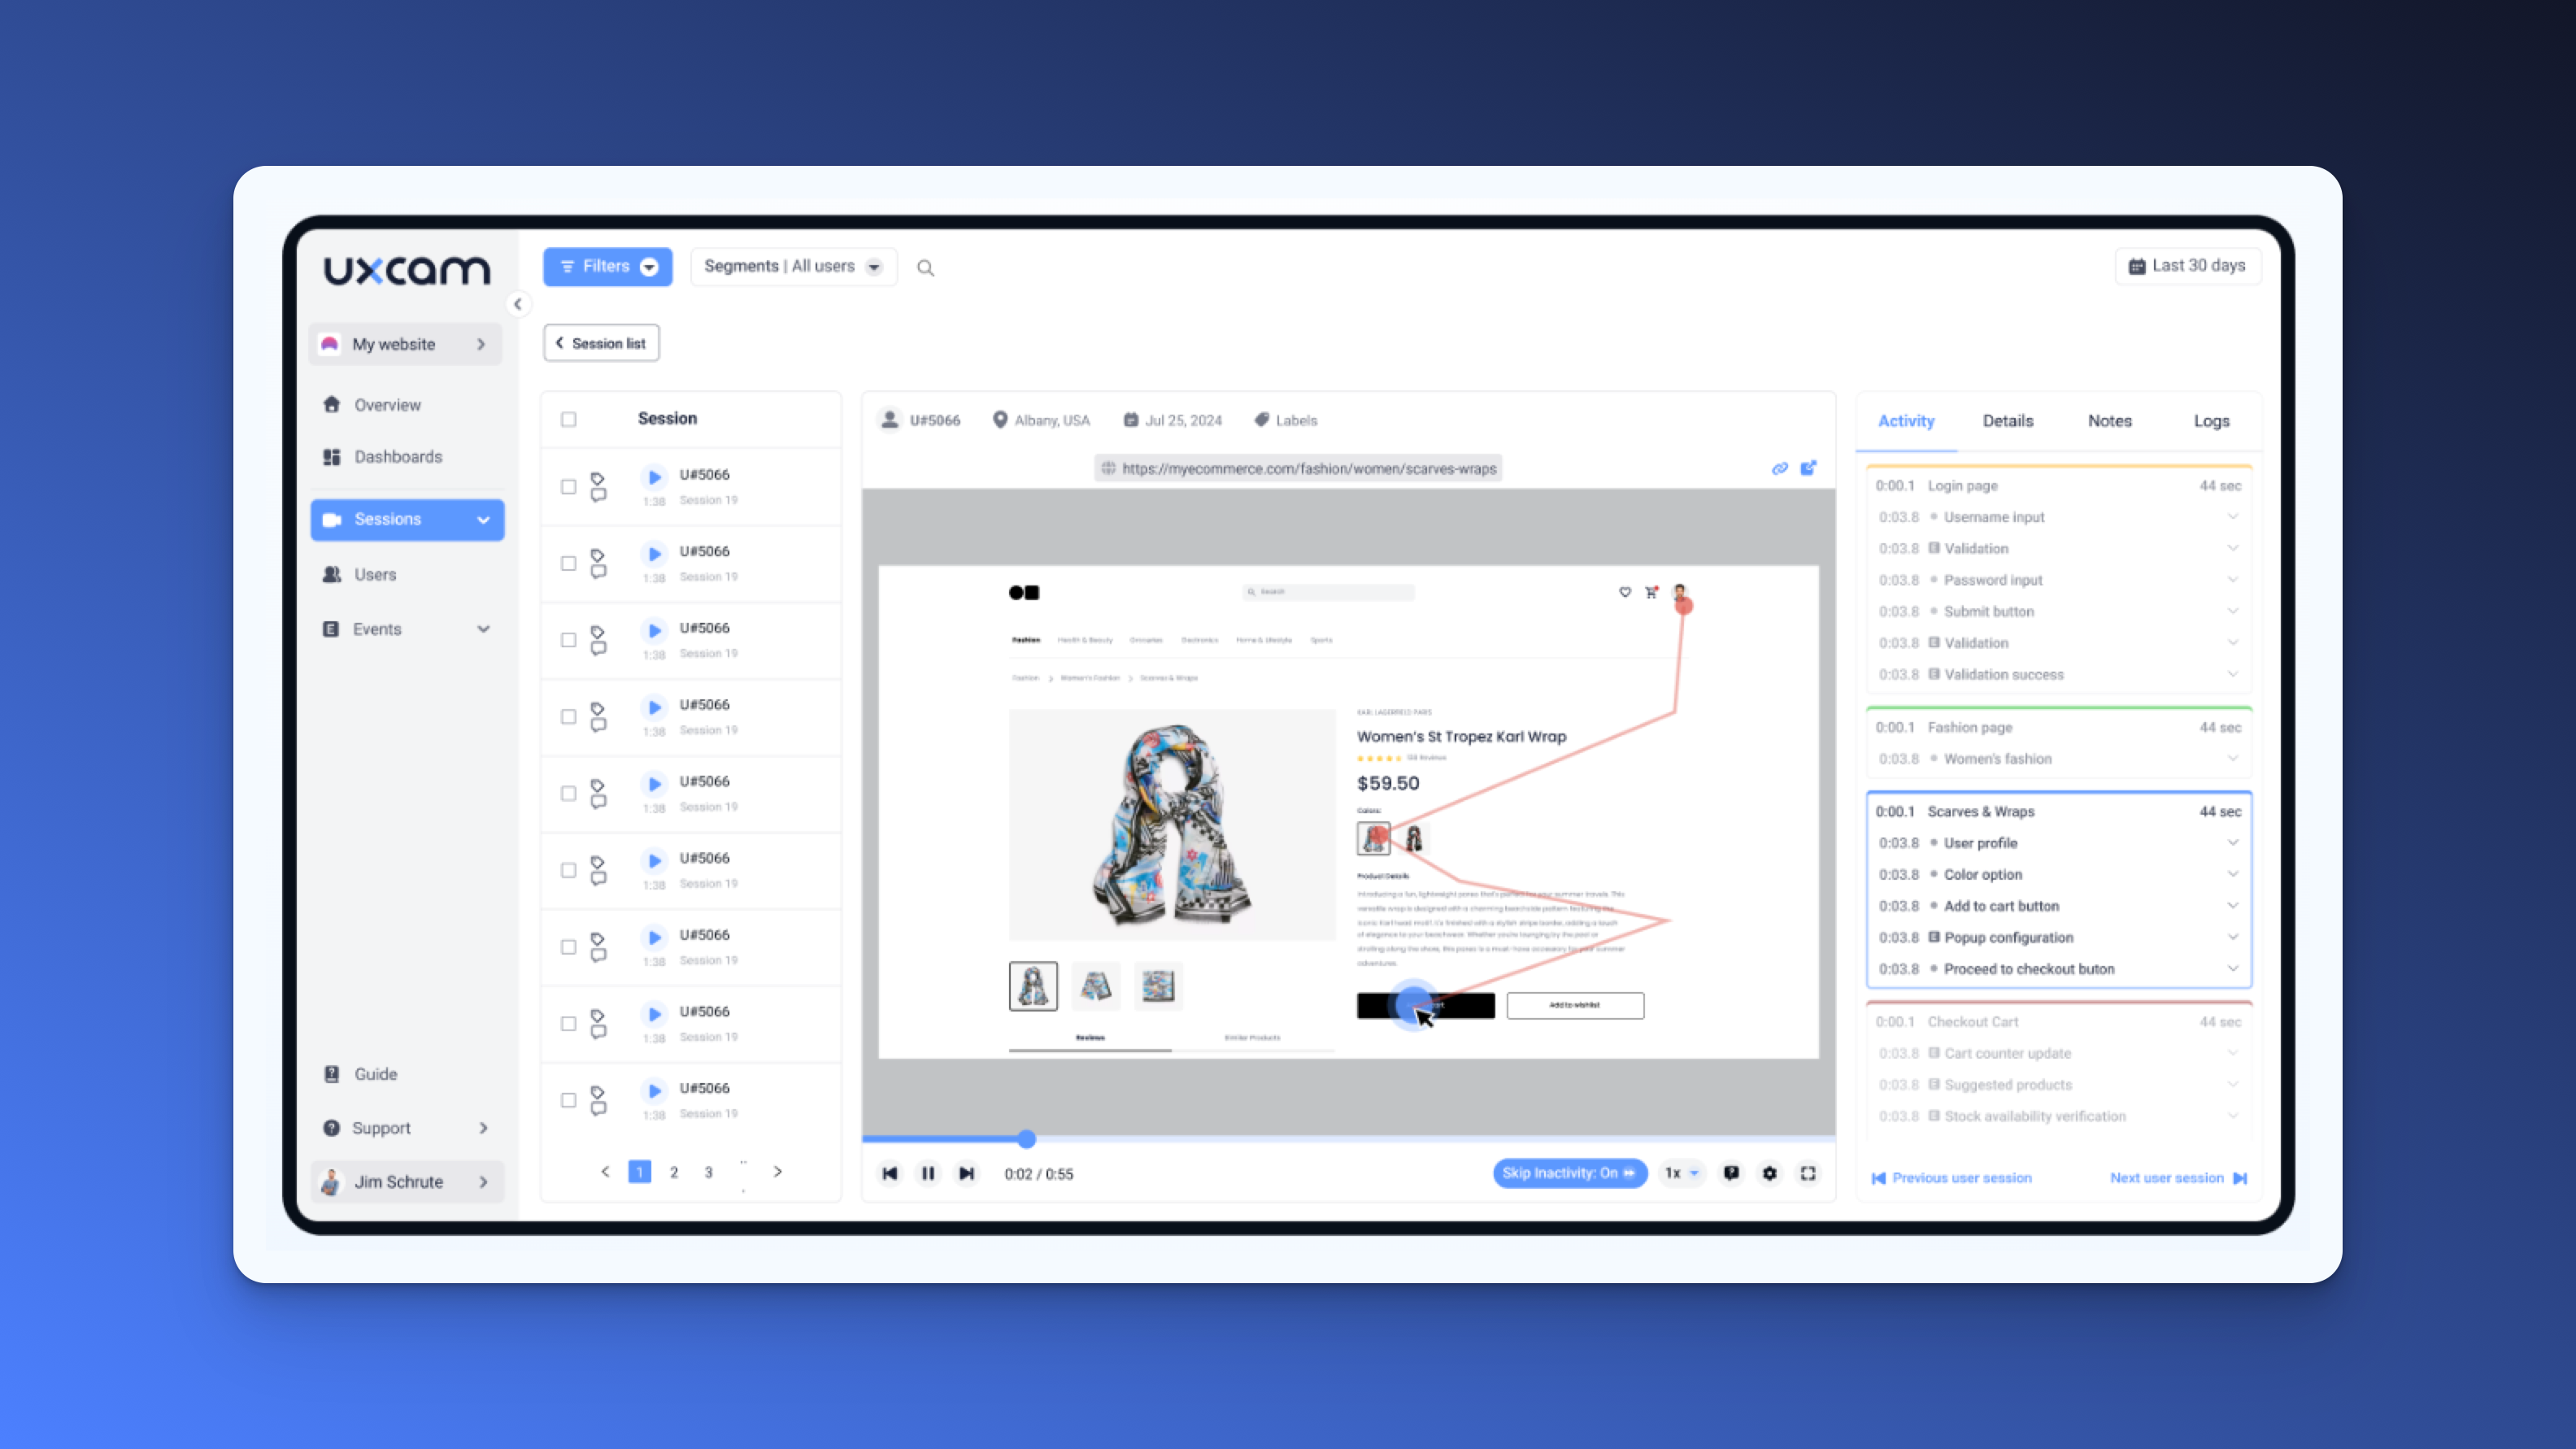
Session recordings
Session recordings are like having a front-row seat to how users interact with your web app. They capture and replay actual user sessions, showing their clicks, scrolls, and navigation paths in real time.
This method helps you understand user behavior in context. Unlike numbers in a report, session recordings let you see what users experience, including moments of confusion or frustration. For example, you might notice users struggling to complete a form because they repeatedly click an unresponsive button.
By watching these recordings, you can:
Spot usability issues that go unnoticed in analytics.
Understand how users interact with new features.
Identify areas where users encounter roadblocks or friction.
Session recordings bridge the gap between metrics and user intent, helping you make more informed design decisions.


Heatmaps
Heatmaps provide a visual representation of user interactions, highlighting areas with the most clicks, taps, or hovers. They are essential for spotting trends and understanding how users navigate your app.
For instance, in a SaaS product with a dashboard, heatmaps can reveal if users are clicking on dynamic elements like dropdowns or charts. If users click repeatedly on static labels, it might signal confusion about what’s interactive versus what’s not.
Heatmaps answer critical questions like:
Where are users focusing their attention?
Are certain sections of the page being ignored?
Are users dropping off due to confusing layouts?
By combining click tracking with heatmaps, you gain both granular and big-picture insights into user activity, enabling more informed product decisions.
Event tracking
Event tracking is all about monitoring specific user actions. It focuses on the "what" users do, like clicking a specific button, submitting a form, or completing a feature tutorial.
This approach gives you detailed insights into how users interact with your app's key features. For instance, tracking feature activation rates can reveal which user segments adopt new functionality and which don’t. If adoption rates are low, it might signal a need for better onboarding or clearer instructions.
Let's take a look at simple examples of how event-based tracking helps to inspire you:
| Action Tracked | What It Reveals | Example Insight |
|---|---|---|
| Button clicks | User engagement with CTAs | Low clicks on a "Try Now" button indicate weak CTA design. |
| Form submissions | Completion rates and drop-off points | Users abandoning forms on Step 3 may signal complexity. |
| Feature activations | Adoption rates across user segments | SMB users are adopting a reporting feature, but enterprise users aren’t. |
| Error messages triggered | Potential technical issues | Frequent "form validation" errors point to poor UX design. |
Event-based tracking works best when you focus on actions tied to your product goals. By understanding what users are doing—and not doing—you can continuously refine your app for better engagement and retention.
Navigation path analysis
Funnel analysis is your roadmap to understanding user journeys. It maps out the steps users take to achieve a specific goal, like signing up for an account or completing a purchase, helping you visualize the paths users follow—and where they drop off.
For a web product that has a multi-step account creation process. Funnel analysis shows you how many users start on the registration page, progress to email verification, and finally reach the account setup page. If a significant drop-off occurs during email verification, you know exactly where to focus your improvements.
Here’s why funnel analysis is essential:
It pinpoints the exact stages where users disengage.
It helps prioritize optimizations by showing the impact of each step on overall conversions.
It provides a clear picture of the user journey, enabling you to make data-driven decisions.
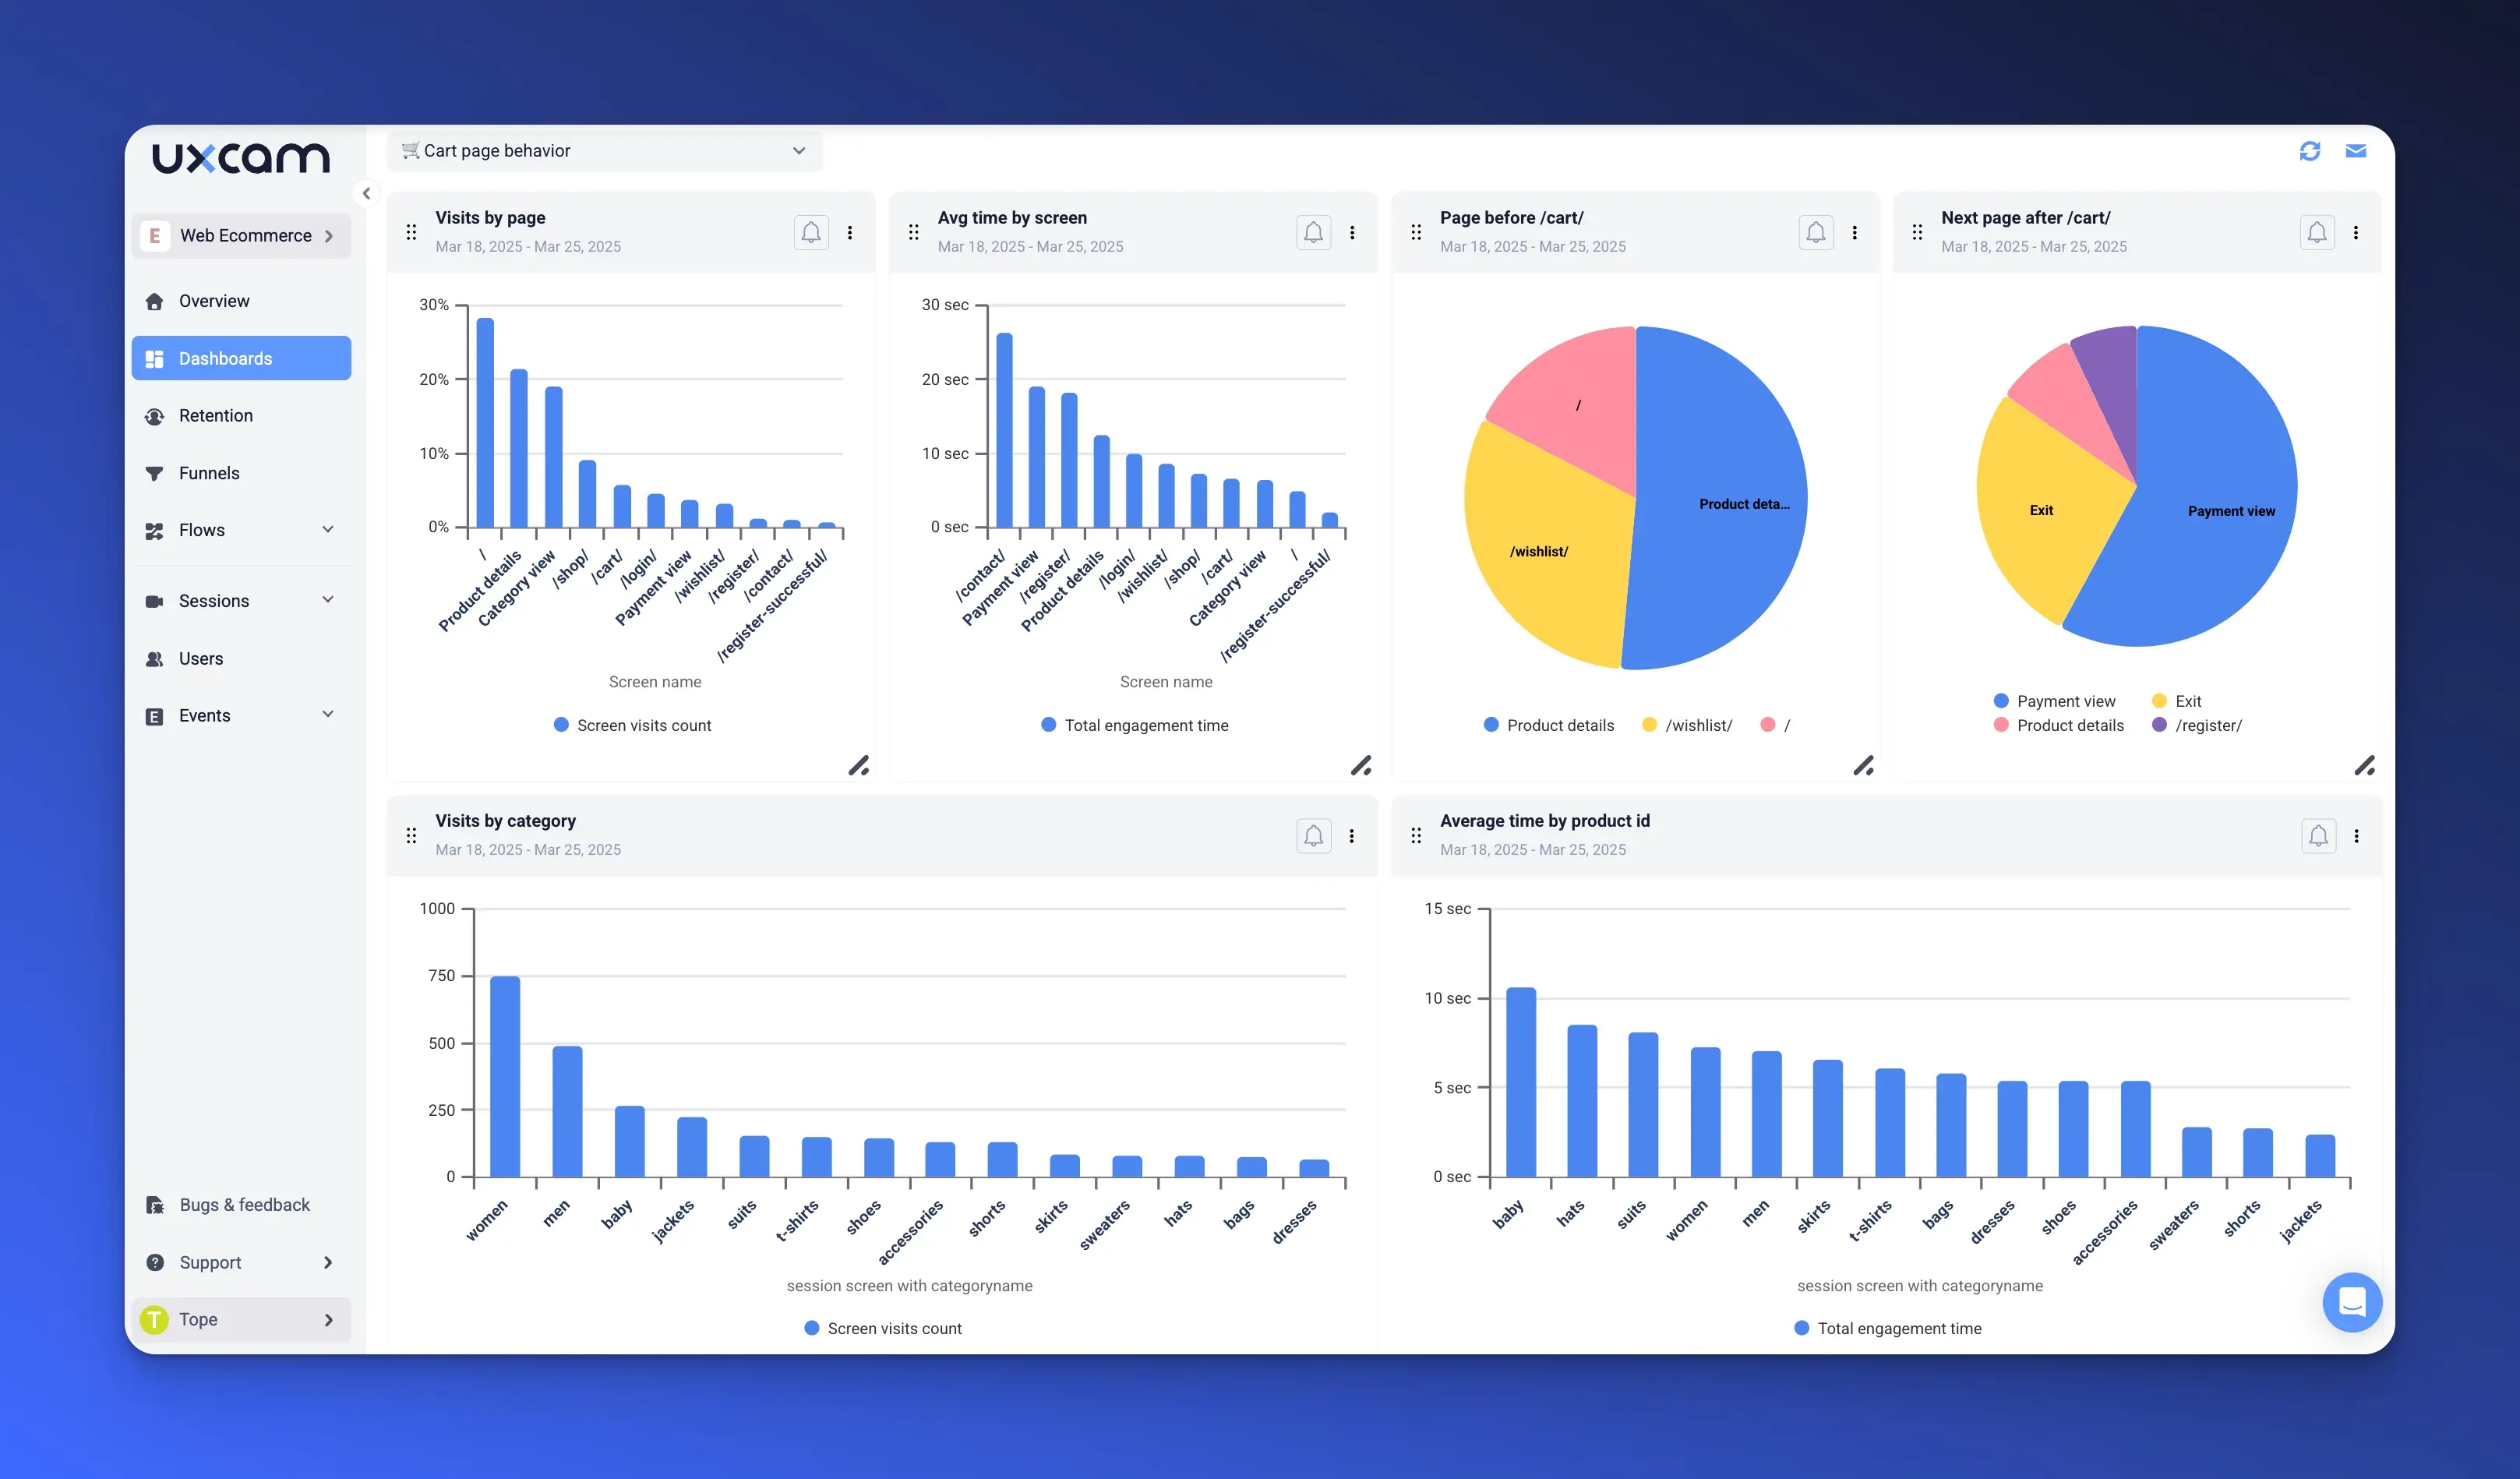
Choosing the right tools for web activity monitoring
You need solutions that are easy to set up, offer granular insights, and provide intuitive data visualizations to turn information into actionable decisions.
When evaluating tools, prioritize these key criteria for selecting tools:
Ease of detup: Avoid solutions requiring extensive engineering time. Look for tools that work out-of-the-box with minimal configuration.
Granularity: Ensure the tool allows detailed segmentation and filtering to get actionable insights.
Data visualization: Choose tools with clear, interactive dashboards that are easy for non-technical teams to interpret.
Rcommended website tracking tools
Below we've put together and compared the top tools based on these criteria:
| Tool | Strengths | Limitations |
|---|---|---|
| UXCam | Native session replay integrated with analytics. Easy setup with single SDK. Advanced segmentation. | Heatmaps not included yet, but coming soon |
| Mixpanel | Strong event-based tracking and cohort analysis. | Steeper learning curve. Manual configuration needed. |
| Amplitude | Powerful for quantitative data and visualization. | Limited session replay for qualitative insights. |
| Hotjar | Heatmaps and surveys for user feedback. | Limited analytics depth for complex web apps. |
| FullStory | Combines session replay with behavioral analytics. | Higher cost for small-to-mid-sized teams. |
Why UXCam stands out
UXCam provides a seamless blend of quantitative and qualitative analytics, offering session replays alongside event tracking without requiring additional configuration. Its single SDK setup eliminates the hassle of integrating multiple tools, making it both efficient and cost-effective.


With UXCam, you can:
Instantly jump from metrics to session replays for contextual insights.
Use advanced filters for deep segmentation, like tracking feature adoption across different user types.
Save engineering time with autocaptured user and device data.
Unlike other tools that require piecing together fragmented insights, UXCam connects the dots between numbers and user behavior effortlessly. This unified approach ensures your team spends more time improving the product and less time troubleshooting analytics.
By choosing tools aligned with your goals, like UXCam, you simplify workflows and gain faster, actionable insights to improve your web app’s user journey. You can sign up for a FREE trial to get started with UXCam.
How to implement website activity tracking
Implementing user activity tracking effectively requires the right tools, metrics, and practices. Done correctly, it can transform how you understand and improve the user journey within your web app. Here’s how you can set up tracking, choose the right metrics, and ensure success.
Set up tracking
The first step is installing and configuring a reliable tracking tool. A tool like UXCam simplify this process with features like autocapture, which automatically tracks user interactions without needing extensive engineering support.
Let's run through a simple step-by-step implementation guide:
Install the SDK: Integrate the tracking tool’s SDK into your web app. UXCam’s lightweight SDK minimizes impact on app performance while capturing granular user behavior data.
Enable Autocapture: Configure the tool to automatically record clicks, form submissions, page views, and dynamic interactions.
Define Custom Events: Identify key actions to track, such as completing onboarding steps or activating features.
Validate Tracking: Perform test interactions to ensure the tool accurately captures the data. Review these actions within the analytics dashboard for completeness.
Comparison implementation methods for website user activity tracking
| Feature | SDK | Tag Manager |
|---|---|---|
| Ease of Setup | Requires developer involvement. | Minimal developer involvement. |
| Granularity | Highly granular, tracks dynamic events. | Limited granularity, requires manual setup. |
| Dynamic Content | Ideal for SPAs and dynamic elements. | Less effective for dynamic content. |
| Custom Events | Fully customizable with code. | Requires manual configuration. |
| Performance Impact | Optimized for minimal impact. | Can slow down the app if overused. |
| Maintenance | Low once integrated. | Requires periodic tag updates. |
| Advanced Features | Supports rage clicks, replays, etc. | Limited to basic event tracking. |
For UXCam for Web, the SDK is the preferred option if you want robust and automated product analytics with features like session replay, advanced segmentation, and autocapture.
A Tag Manager can complement the SDK in specific scenarios where you need flexibility to add non-core tracking elements (e.g., marketing pixels or ad campaign events) without involving developers.
If your goal is deep product insights with minimal engineering effort, go with the SDK. For supplemental or lightweight tracking, consider a hybrid approach with a Tag Manager
Key metrics when tracking user activity in web applications
When it comes to understanding how users interact with your web application, tracking the right metrics is essential. The data you collect can guide design decisions, improve user engagement, and ultimately drive the success of your product. Below are some key metrics to track when monitoring user activity in a web application:
| Metric | What It Measures | How to Use It |
|---|---|---|
| Active Users (DAU/WAU/MAU) | The number of unique users actively engaging on a daily, weekly, or monthly basis. | Compare DAU to MAU (stickiness ratio) and track trends over time to assess overall engagement. |
| Sessions & Visits | The volume and duration of user sessions plus average pages viewed per visit. | Optimize site flow and content to reduce bounce rates and foster deeper engagement. |
| Conversions & Funnel Metrics | The percentage of users completing key goals and pinpointing drop-off stages. | Analyze funnels to identify bottlenecks and run A/B tests on critical pages or CTAs. |
| User Retention & Churn Rate | The proportion of users who return versus those who discontinue over a set timeframe. | Conduct cohort analyses to uncover retention patterns and address churn drivers for improved loyalty. |
| Feature Usage & Adoption | How frequently users interact with specific features and which ones they ignore. | Monitor high-value features to ensure quality and consider redesigning or removing underused features. |
| Engagement Metrics | The level of user interaction measured by time on page, CTR, and other engagement signals. | Identify popular pages, optimize calls to action, and experiment with layouts to increase engagement. |
| Error & Performance Metrics | The rate of errors, crashes, and load times that affect user experience. | Prioritize fixes for recurring issues and optimize load times to maintain a smooth user experience. |
| Custom Goals & Events | Unique user actions tailored to the product’s core workflows or “aha!” moments. | Define and track these events to gauge how well users adopt critical features and identify friction. |
1. Active users (DAUs, WAUs, MAUs)
Active user counts show how effectively your application retains and attracts users over different time frames. This helps you understand overall growth trends and app “stickiness.”
Daily Active Users (DAU): The number of unique users who engage with your app in a day.
Weekly Active Users (WAU): The number of unique users who engage with your app in a week.
Monthly Active Users (MAU): The number of unique users who engage with your app in a month.
How to use them:
Compare DAU to MAU (often referred to as the Stickiness Ratio). A higher ratio means that your monthly users are returning more frequently within the month.
Track changes over time to spot patterns, seasonality, or anomalies that might indicate user satisfaction or dissatisfaction.
2. Session and visit metrics
These metrics provide insight into how deeply users engage with your content in a single visit. A short session length might indicate that users aren’t finding value or that your site is confusing; a longer session length can indicate higher engagement (or in some cases poor usability if people are “lost” and can’t find what they need).
Sessions (or visits): The total number of user sessions initiated.
Session length: How long a user stays in your application before leaving.
Pages per session: How many pages a user visits during each session.
How to use them:
Identify the average time spent on crucial pages to see if you’re capturing user attention where it counts.
Improve navigation flow to reduce bounce rates and encourage multi-page visits when appropriate.
3. Conversion and funnel metrics
Conversion metrics are directly tied to business value. They shed light on whether people are taking meaningful actions within the application (like creating an account, buying a subscription, or filling out a lead form).
Conversion rate: The percentage of users completing a desired goal (sign-up, purchase, form submission, etc.).
Drop-off points (funnel analysis): Where in the process flow users abandon an intended task.
How to use them:
Conduct funnel analysis to see which steps deter users from completing a goal.
A/B test different versions of forms, landing pages, or calls to action to increase conversions.
4. User retention & churn rate
A low retention rate or a high churn rate indicates that users might be dissatisfied, not finding ongoing value, or encountering usability problems. Understanding when and why they drop off is crucial for product improvements.
Retention rate: The percentage of users who return to the app after their first visit or within specific timeframes.
Churn rate: The percentage of users who stop using your application over a given period.
How to use them:
Use cohort analysis to see how different user segments behave over time (e.g., users who signed up in January vs. users who signed up in February).
Track user feedback and correlate satisfaction levels with usage frequency to identify product strengths and weaknesses.
5. Feature usage and adoption
Feature usage and adoption metrics measures how often users interact with specific features (e.g., search tools, messaging, advanced functionality) within your application. Feature usage reveals whether the functionalities you build are truly valuable to your users. If a key feature is underutilized, it may need a redesign or better onboarding to guide users toward it.
How to use it:
Identify top-used features and ensure they remain stable, well-documented, and easy to access.
Look for features with low adoption to see whether they can be improved, simplified, or removed if they no longer align with user needs.
6. Engagement metrics
Engagement metrics demonstrate whether users are finding value and interacting meaningfully with your content or features. Tracking these helps you understand how users move through the app and which areas are most interesting to them.
Time on page/Time in feature: How long users spend on specific pages or sections of the application.
Click-through rates (CTR): How often users click on calls to action, navigation links, or buttons compared to how many times they’re viewed.
How to use them:
Identify popular (or problematic) sections to optimize navigation.
Test different layouts, copy, and calls to action to see which combinations lead to deeper engagement.
7. Error and performance metrics
User satisfaction depends heavily on performance. Slow load times or frequent errors lead to frustration and increase the chance of abandonment.
Error rate: The frequency of errors or failures (e.g., HTTP errors, app crashes).
Page load time: How long it takes for pages to load.
Time to first byte (TTFB): Server response speed.
How to use them:
Continuously monitor error logs to identify common bugs or performance bottlenecks.
Track page load times across different devices, browsers, and regions to ensure consistent performance.
8. Custom goals and events
These measure any user interactions or events specific to your application’s core functionality (e.g., item uploads, message sends, file downloads, etc.). Every app has its unique “aha!” moments or key user actions. Tracking custom events ensures you’re measuring what truly defines success for your product.
How to use them:
Establish clear definitions for custom events tied to important user workflows.
Monitor the frequency of these events to gauge feature success or detect user friction.
Best practices for implementating web app tracking
To ensure your tracking implementation is efficient and reliable, follow these best practices:
Keep it lightweight: Overloading your app with tracking scripts can slow it down. Use tools like UXCam, which balance robust data collection with low performance impact.
Focus on key actions: Track metrics tied to specific business goals, like conversion rates or feature engagement.
Leverage automation: Tools with automatic event collection reduce setup time and manual effort. UXCam’s autocapture is a prime example, providing ready-to-use insights immediately after installation.
Iterate regularly: Review collected data frequently and refine tracking as your app evolves.
Implementing automatic event collection allows you to capture critical user interactions with minimal configuration, reducing engineering overhead and ensuring seamless data accuracy.
How to ensure compliance in web usage tracking
User activity tracking is a powerful tool for understanding behaviors and improving experiences, but it must be balanced with compliance to privacy regulations. Frameworks such as GDPR, CCPA, and others dictate how data must be collected, stored, and used, placing the user's rights and data security at the forefront. Ensuring compliance not only protects your organization from legal repercussions but also builds trust with your users.
Best practices for compliance
To align with these regulations, organizations should adopt the following practices:
Transparent data usage policies: Clearly communicate to users what data is collected, how it is used, and how long it is retained.
User consent Mechanisms: Obtain explicit consent before collecting data, with options to update or withdraw consent easily.
Data anonymization: Ensure that personal identifiers are removed from stored data to minimize risks in case of a breach.
Tools like UXCam make compliance easier by incorporating privacy features into their analytics platform. With built-in capabilities for data anonymization and customizable consent mechanisms, UXCam helps you adhere to privacy standards without sacrificing insights. Its out-of-the-box privacy settings are designed to meet the requirements of GDPR, CCPA, and similar frameworks, saving your team time while ensuring peace of mind.
Conclusion and next steps
Tracking and analyzing user activity in your web application is essential for understanding the user journey and driving meaningful improvements. By monitoring interactions, identifying pain points, and refining experiences, you can create a product that aligns with user needs while achieving business goals.
The right tools make all the difference. With features like session replays, funnel analysis, and event-based tracking, UXCam simplifies the process of uncovering actionable insights. It’s designed to streamline your workflow, enhance collaboration across teams, and deliver faster results without requiring extensive setup.
Ready to take the first step? Try UXCam for free today and discover how effortless user activity tracking can be!
You might also be interested in these;
User Behavior Tracking - Techniques, Tools & Best Practices
21 Website Visitor Tracking Tools with Top-Rated User Reviews
Top 10 Digital Analytics Tools You Need to Know
Ultimate Website Optimization Guide: Must-Know Tactics
Website Analysis 101: How to Analyze for Peak Performance
Best 14 Web Analytics Tools You Must Know
AUTHOR
Tope Longe
Product Analytics Expert
Ardent technophile exploring the world of mobile app product management at UXCam.


TABLE OF CONTENTS
- Summary - How to track user behavior on websites
- What is website user tracking?
- How to track user activity on website (Top Techniques)
- Choosing the right tools for web activity monitoring
- How to implement website activity tracking
- Key metrics when tracking user activity in web applications
- Best practices for implementating web app tracking
- How to ensure compliance in web usage tracking
- Conclusion and next steps


Related articles

Website Analysis
Website Visitor Tracking: Tools, Metrics, How-To (2026)
Website visitor tracking is the practice of capturing how individual users behave on your site (clicks, scrolls, form interactions, page paths) so you...


Silvanus Alt, PhD
Founder & CEO | UXCam


Website Analysis
What Is Web Analytics? Definition, Metrics, and Top 10 Tools (2026)
Web analytics is the collection, measurement, and analysis of data from website visitors to understand behavior, optimize conversions, and inform...
Silvanus Alt, PhD
Founder & CEO | UXCam


Website Analysis
Website Analysis: The Complete 2026 Guide
A practical guide to website analysis for product teams. Go beyond SEO audits and speed tests to understand what users actually do on your pages, and fix...
Silvanus Alt, PhD
Founder & CEO | UXCam