Product Hypothesis - A Guide to Create Meaningful Hypotheses


Data-driven development is no different than a scientific experiment. You repeatedly form hypotheses, test them, and either implement (or reject) them based on the results. It’s a proven system that leads to better apps and happier users.
But forming good product hypotheses isn’t always easy.
At UXCam, we’ve helped thousands of mobile product teams create and validate meaningful product hypotheses. In this guide, we will share insights and tips on how to use product hypotheses to guide development.
Let’s get started.
Summary - How to create hypothesis in product management
| Step | Summary |
|---|---|
| Map important user flows | Understand how users move through your product. Use UXCam for flow mapping. |
| Identify any bottlenecks | Find areas where users drop off. Identify high dropoff rates needing further investigation. |
| Look for interesting behavior patterns | Use session replays and event analytics to analyze behavior and discover usability issues. |
| Turn patterns into hypotheses | Form 'If… then…' statements based on patterns. Test hypotheses with A/B testing and research. |
What is a product hypothesis?
A product hypothesis is an educated guess about how a change to a product will impact important metrics like revenue or user engagement. It's a testable statement that needs to be validated to determine its accuracy.
The most common format for product hypotheses is “If… than…”:
“If we increase the font size on our homepage, then more customers will convert.”
“If we reduce form fields from 5 to 3, then more users will complete the signup process.”
At UXCam, we believe in a data-driven approach to developing product features. Hypotheses provide an effective way to structure development and measure results so you can make informed decisions about how your product evolves over time.
Take PlaceMakers, for example.


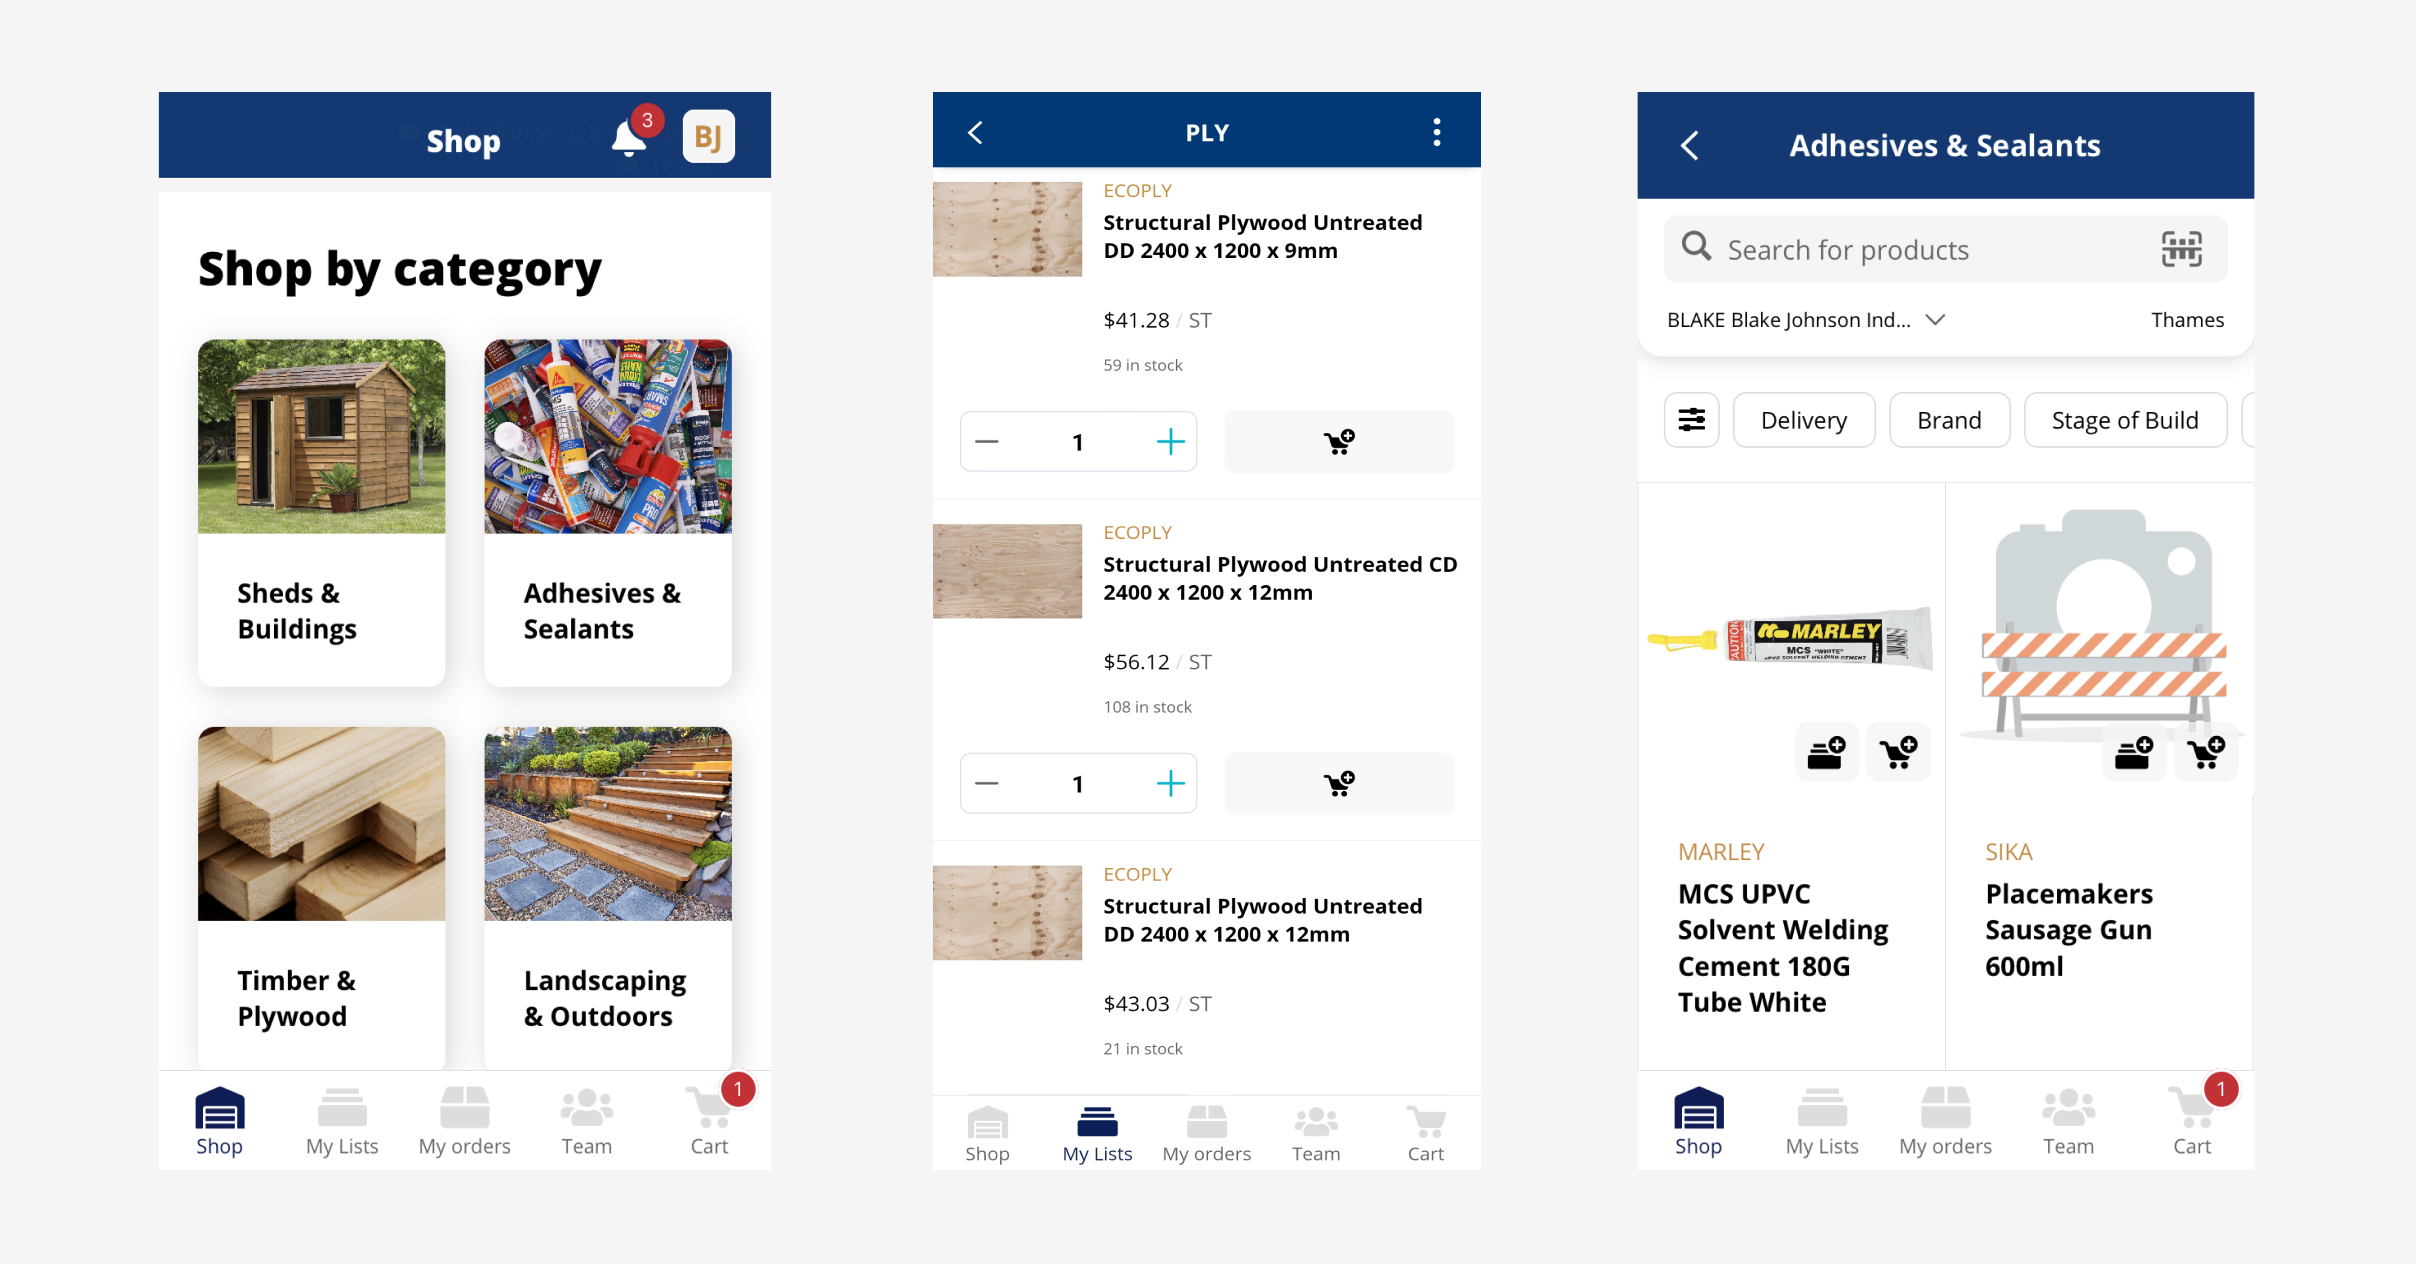
PlaceMakers faced challenges with their app during the COVID-19 pandemic. Due to supply chain shortages, stock levels were not being updated in real-time, causing customers to add unavailable products to their baskets. The team added a “Constrained Product” label, but this caused sales to plummet.


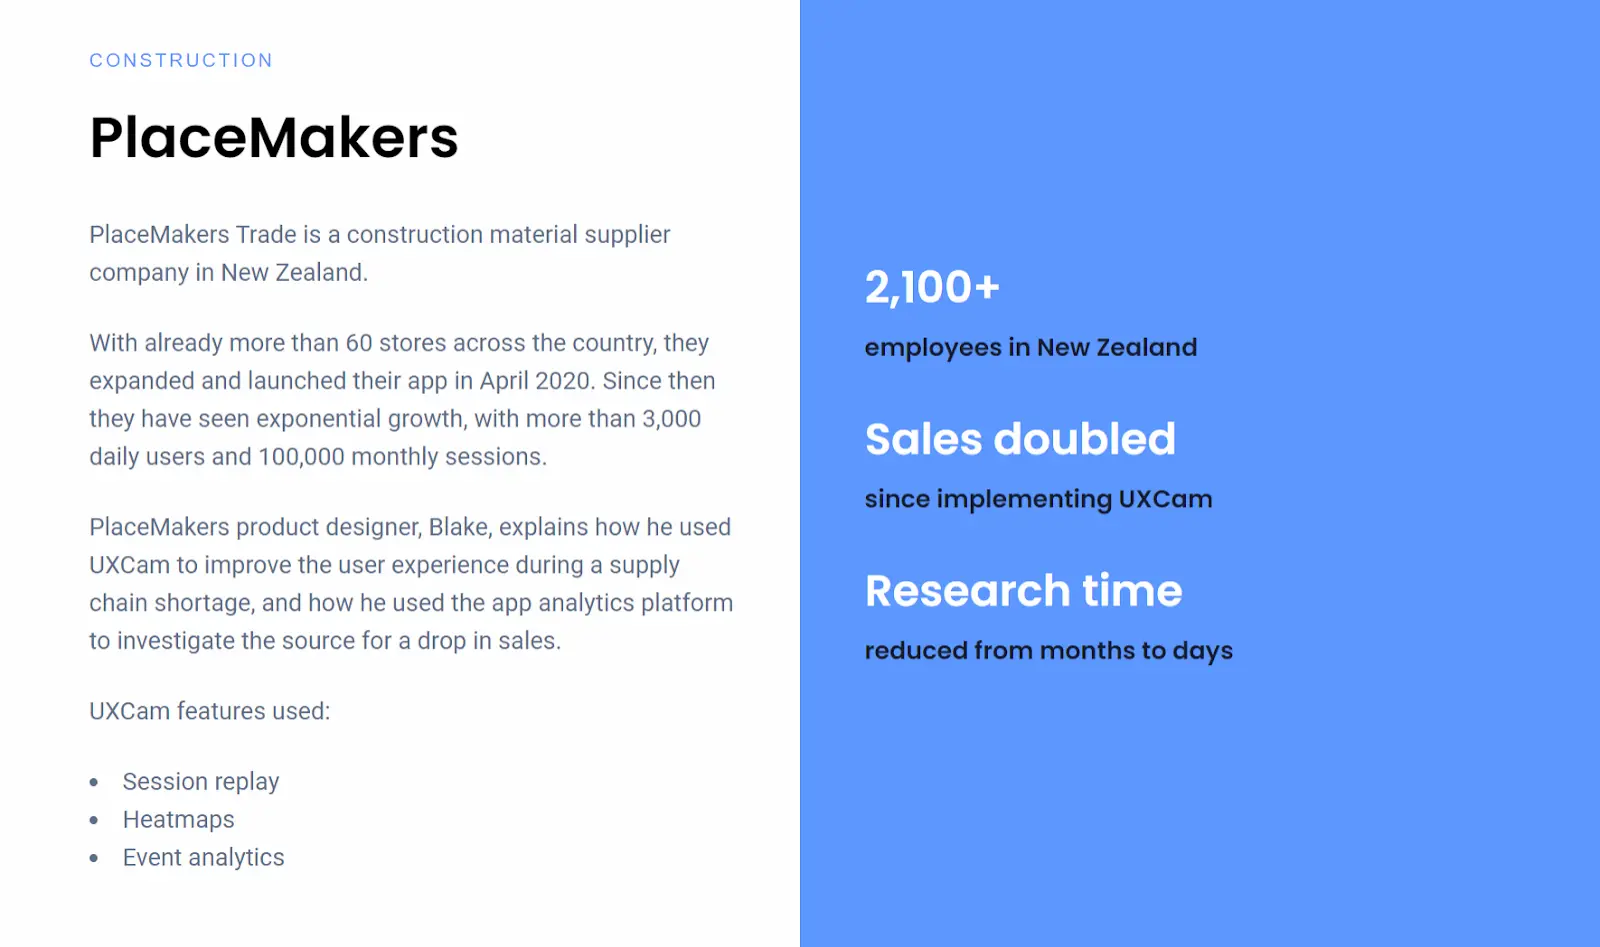
The team then turned to UXCam’s session replays and heatmaps to investigate, and hypothesized that their messaging for constrained products was too strong. The team redesigned the messaging with a more positive approach, and sales didn’t just recover—they doubled.
Types of product hypothesis
1. Counter-hypothesis
A counter-hypothesis is an alternative proposition that challenges the initial hypothesis. It’s used to test the robustness of the original hypothesis and make sure that the product development process considers all possible scenarios.
For instance, if the original hypothesis is “Reducing the sign-up steps from 3 to 1 will increase sign-ups by 25% for new visitors after 1,000 visits to the sign-up page,” a counter-hypothesis could be “Reducing the sign-up steps will not significantly affect the sign-up rate.
2. Alternative hypothesis
An alternative hypothesis predicts an effect in the population. It’s the opposite of the null hypothesis, which states there’s no effect.
For example, if the null hypothesis is “improving the page load speed on our mobile app will not affect the number of sign-ups,” the alternative hypothesis could be “improving the page load speed on our mobile app will increase the number of sign-ups by 15%.”
3. Second-order hypothesis
Second-order hypotheses are derived from the initial hypothesis and provide more specific predictions.
For instance, “if the initial hypothesis is Improving the page load speed on our mobile app will increase the number of sign-ups,” a second-order hypothesis could be “Improving the page load speed on our mobile app will increase the number of sign-ups.”
Why is a product hypothesis important?
Guided product development
A product hypothesis serves as a guiding light in the product development process. In the case of PlaceMakers, the product owner’s hypothesis that users would benefit from knowing the availability of items upfront before adding them to the basket helped their team focus on the most critical aspects of the product. It ensured that their efforts were directed towards features and improvements that have the potential to deliver the most value.
Improved efficiency
Product hypotheses enable teams to solve problems more efficiently and remove biases from the solutions they put forward. By testing the hypothesis, PlaceMakers aimed to improve efficiency by addressing the issue of stock levels not being updated in real-time and customers adding unavailable products to their baskets.
Risk mitigation
By validating assumptions before building the product, teams can significantly reduce the risk of failure. This is particularly important in today’s fast-paced, highly competitive business environment, where the cost of failure can be high.
Validating assumptions through the hypothesis helped mitigate the risk of failure for PlaceMakers, as they were able to identify and solve the issue within a three-day period.
Data-driven decision-making
Product hypotheses are a key element of data-driven product development and decision-making. They provide a solid foundation for making informed, data-driven decisions, which can lead to more effective and successful product development strategies.
The use of UXCam's Session Replay and Heatmaps features provided valuable data for data-driven decision-making, allowing PlaceMakers to quickly identify the problem and revise their messaging approach, leading to a doubling of sales.
How to create a great product hypothesis
Map important user flows
Identify any bottlenecks
Look for interesting behavior patterns
Turn patterns into hypotheses
Step 1 - Map important user flows
A good product hypothesis starts with an understanding of how users more around your product—what paths they take, what features they use, how often they return, etc. Before you can begin hypothesizing, it’s important to map out key user flows and journey maps that will help inform your hypothesis.
To do that, you’ll need to use a monitoring tool like UXCam.


UXCam integrates with your app through a lightweight SDK and automatically tracks every user interaction using tagless autocapture. That leads to tons of data on user behavior that you can use to form hypotheses.
At this stage, there are two specific visualizations that are especially helpful:
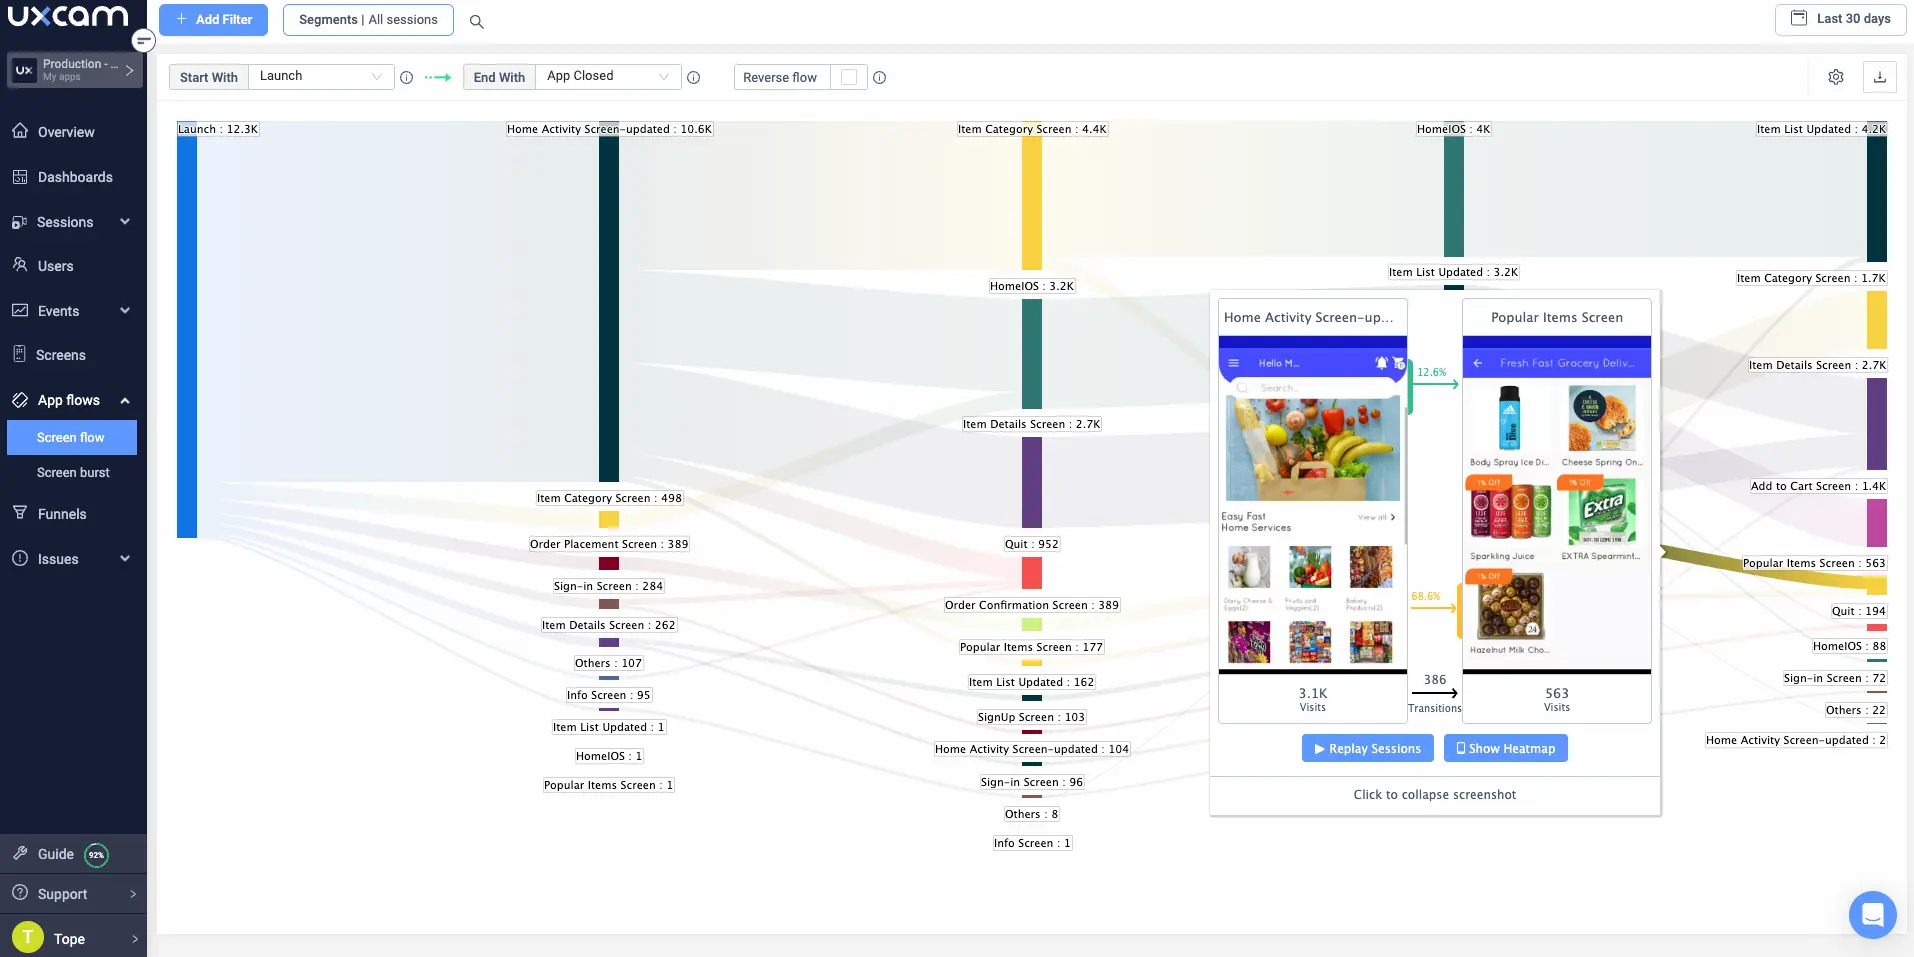
Screen Flows: Screen Flows map out which screens a user is interacting with, in what order and how often.
Funnels: Funnels are great for identifying drop off points and understanding which steps in a process, transition or journey lead to success.
In other words, you’re using these two tools to define key in-app flows and to measure the effectiveness of these flows (in that order).


Step 2 - Identify any bottlenecks
Once you’ve set up monitoring and have started collecting data, you’ll start looking for bottlenecks—points along a key app flow that are tripping users up. At every stage in a funnel, there’s going to be dropoffs, but too many dropoffs can be a sign of a problem.
UXCam makes it easy to spot dropoffs by displaying them visually in every funnel. While there’s no benchmark for when you should be concerned, anything above a 10% dropoff could mean that further investigation is needed.
How do you investigate? By zooming in.
Step 3 - Look for interesting behavior patterns
At this stage, you’ve noticed a concerning trend and are zooming in on individual user experiences to humanize the trend and add important context.
The best way to do this is with session replay tools and event analytics. With a tool like UXCam, you can segment app data to isolate sessions that fit the trend. You can then investigate real user sessions by watching videos of their experience or by looking into their event logs. This helps you see exactly what caused the behavior you’re investigating.
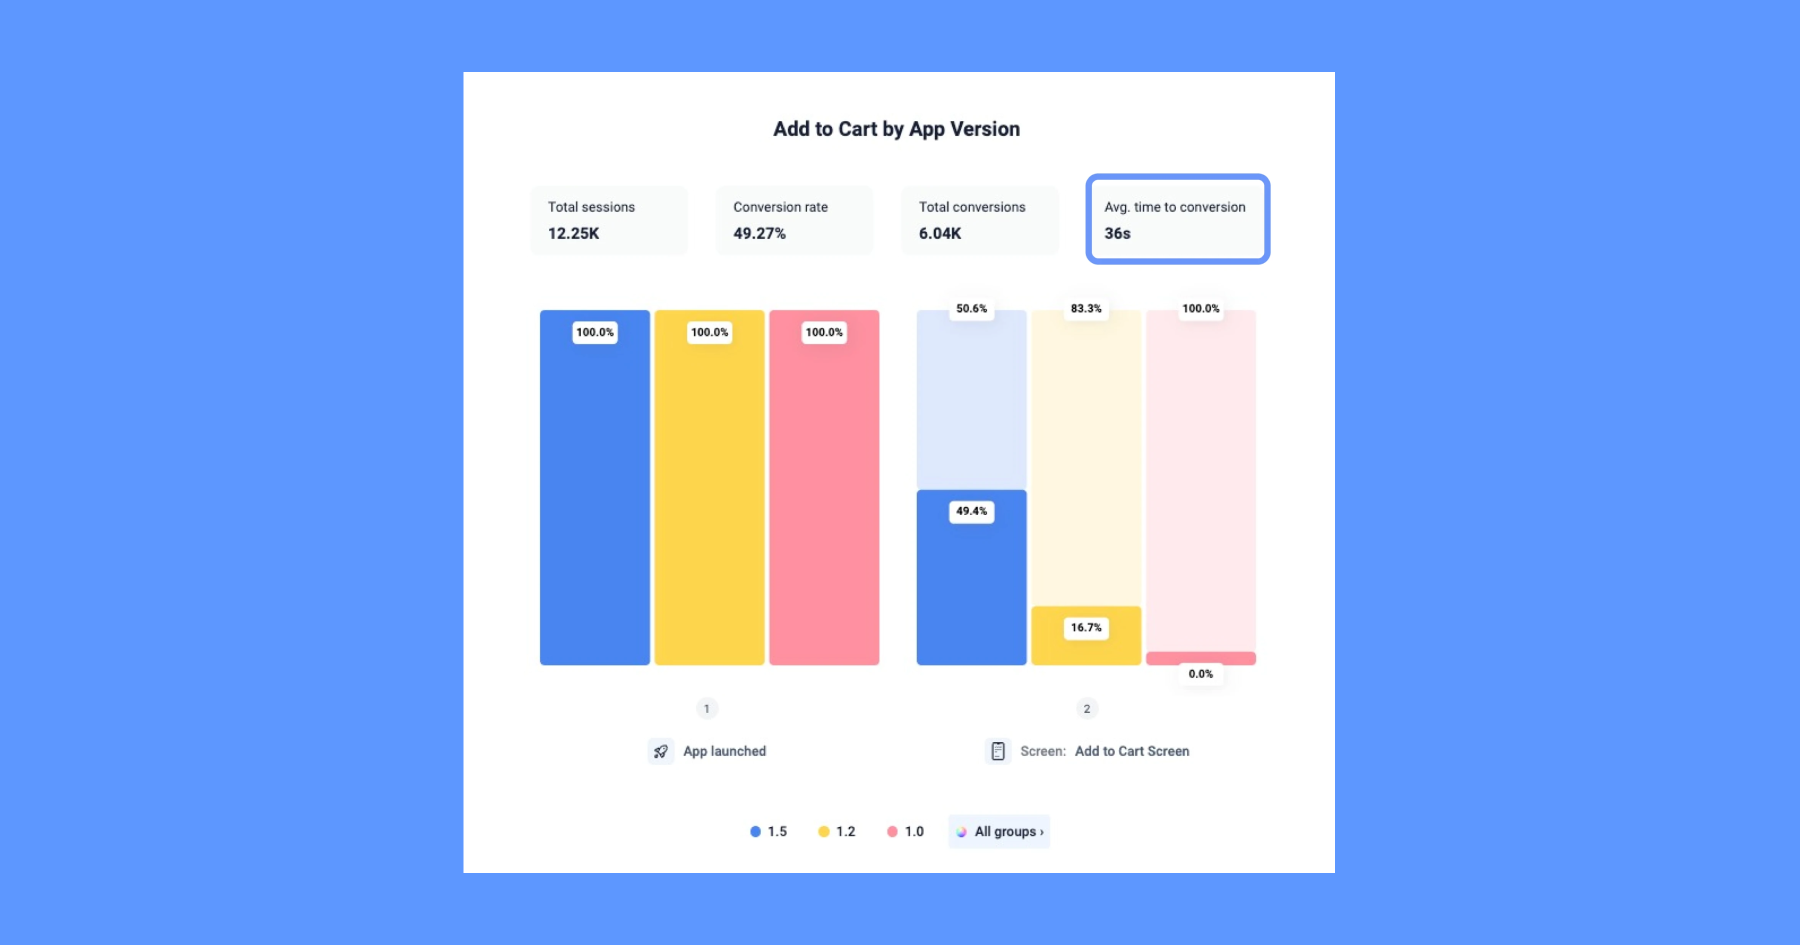
For example, let’s say you notice that 20% of users who add an item to their cart leave the app about 5 minutes later. You can use session replay to look for the behavioral patterns that lead up to users leaving—such as how long they linger on a certain page or if they get stuck in the checkout process.
Step 4 - Turn patterns into hypotheses
Once you’ve checked out a number of user sessions, you can start to craft a product hypothesis.
This usually takes the form of an “If… then…” statement, like:
“If we optimize the checkout process for mobile users, then more customers will complete their purchase.”
These hypotheses can be tested using A/B testing and other user research tools to help you understand if your changes are having an impact on user behavior.
Product hypothesis examples
Let's take a look at examples of clear hypotheses that outline expected outcomes, the reasoning behind them, and measurable success indicators.
Below are structured product hypotheses for technology and e-commerce products, demonstrating how data-driven decisions can guide product innovation and improve user engagement.
1. Technology example: Personalized content recommendations
Hypothesis: If we implement a personalized content recommendation engine in our streaming platform, then users will discover more relevant content, leading to a ~15% increase in average watch time per user in the next quarter.
Rationale: Personalization surfaces content tailored to each user's interests, which is expected to keep users engaged longer. Netflix, for example, has reported that about 80% of viewing hours on its service come from its recommendation engine, illustrating how effective tailored suggestions can be.
More generally, personalized experiences are known to drive repeat engagement and customer loyalty over time. Given these trends, enhancing our recommendation system should lead to users watching more content and returning more frequently.
Success Metrics:
Average watch time per user (per day/week): to track if users spend more time consuming content.
Active users and retention rate: e.g. daily active users (DAU) and 30-day retention, to see if more users keep coming back to the app.
Engagement with recommended content: percentage of content views or clicks coming from personalized recommendations – to verify that users are interacting with the new suggestions.
2. E-Commerce example: AR product previews
Hypothesis: If we implement augmented reality (AR) “try-before-you-buy” features for product viewing, then customers will gain more confidence in their purchases, leading to at least a 15% increase in conversion rates and a 5% decrease in product returns within six months.
Rationale: AR lets customers virtually visualize products (for example, seeing how furniture fits in their room or how a pair of glasses looks on their face), which increases confidence in purchase decisions. This immersive experience makes online shopping more engaging – shoppers using AR are significantly more likely to complete a purchase (one study found customers who use AR are about 30% more likely to buy, and Harvard Business Review notes AR can boost conversion rates by ~20% by reducing hesitation).
Moreover, by allowing customers to see products true-to-scale and in context, AR helps ensure they choose the right item, which can cut down on returns (for instance, IKEA observed that AR visualization led to lower return rates for its furniture). With many retailers now embracing AR, this hypothesis aligns with current e-commerce trends toward interactive, confidence-boosting shopping experiences.
Success Metrics:
Conversion rate: the percentage of site visitors who make a purchase – this should increase if AR convinces more browsers to become buyers.
Add-to-cart rate: to measure if interacting with products in AR leads to more items being added to carts, indicating higher purchase intent.
Product return rate: the proportion of purchased items that are returned – this should decline if AR helps customers make more informed, satisfying purchases (a lower return rate would validate that expectations match reality).
Conclusion
Product hypothesis emphasizes the importance of formulating clear and testable hypotheses when developing a product. It highlights that a well-defined hypothesis can guide the product development process, align stakeholders, and minimize uncertainty.
UXCam arms product teams with all the tools they need to form meaningful hypotheses that drive development in a positive direction. Put your app’s data to work and start optimizing today—sign up for a free account.
You might also be interested in these;
Product experimentation framework for mobile product teams
7 Best AB testing tools for mobile apps
A practical guide to product experimentation
AUTHOR
Tope Longe
Product Analytics Expert
Ardent technophile exploring the world of mobile app product management at UXCam.


Related articles


Product best practices
5 best user behavioral analytics tools for mobile app teams
Behavioral analytics offers deep insights into user interaction. Learn about the best behavioral analytics tools to optimize the user experience on your mobile...


Jonas Kurzweg
Product Analytics Expert


Product best practices
Top 11 Remote Usability Testing Tools You Can Use Now
Usability testing tools that will put your mind at...
Jonas Kurzweg
Product Analytics Expert


Curated List
7 Best AB Testing Tools for Mobile Apps
Learn with examples how qualitative tools like funnel analysis, heat maps, and session replays complement quantitative...


Jane Leung
Product Analytics Expert