Product Marketing Analytics - Ultimate Guide for Marketers


Product marketing analytics helps you understand how users engage with your web product beyond just sign-ups and page views. It tracks real user behavior—what features they use, where they drop off, and what drives conversions.
Unlike traditional marketing analytics, which focuses on traffic and ad performance, product marketing analytics gives you insights into in-product actions. This helps you optimize onboarding, boost feature adoption, and reduce churn.
For B2B marketers, this data is critical to turning users into long-term customers. By analyzing real user interactions, you can refine messaging, improve retention, and drive revenue growth. A strong product analytics solution, like UXCam, helps you track these key moments automatically, so you don’t rely on guesswork.
In this guide, we’ll break down how to measure, analyze, and use product marketing analytics to grow your web product.
What is product marketing analytics?
Product marketing analytics is the process of tracking and analyzing user behavior inside your web product. It helps you understand how users interact with features, where they drop off in the journey, and what drives them to convert or churn.
How is product marketing analytics different from traditional marketing analytics?
Traditional marketing analytics focuses on external efforts like ad clicks, website traffic, and lead generation. It tells you how many people land on your site but doesn’t explain what happens once they start using your product.
Product marketing analytics, on the other hand, digs deeper. It tracks feature engagement, user activation, and retention, showing whether your marketing attracts the right audience and whether they find real value inside the product.
Product analytics vs Marketing analytics
| Aspect | Traditional marketing analytics | Product marketing analytics |
|---|---|---|
| Focus | External efforts (ad clicks, website traffic, lead generation) | Internal user behavior (feature engagement, activation, retention) |
| Key insight | How many people land on your site | What happens after users start using the product |
| Measurement goal | Tracking traffic and conversions | Evaluating user activation, feature adoption, and retention |
| Impact on marketing | Generates leads but doesn’t track product engagement | Ensures leads see value, activate key features, and stay engaged |
| Use case for B2B | Lead generation and acquisition tracking | Understanding if marketing attracts the right audience for long-term success |
| Strategic importance | Focuses on customer acquisition | Supports product-led growth and long-term retention |
For B2B marketers, getting people to sign up isn’t enough. You need to ensure they activate key features, see value, and stay engaged. Otherwise, your marketing efforts may bring in leads that churn quickly.
By analyzing feature adoption and retention patterns, you get a full picture of how well your product-led growth strategy is working. Without this data, you’re left guessing if your efforts actually contribute to long-term customer success.
How does product analytics and marketing analytics work together?
Product and marketing analytics often overlap, but they serve different purposes. Marketing analytics tracks acquisition and campaign performance, while product analytics focuses on in-app behavior.
The real power comes when you combine both—linking marketing spend to real user outcomes, not just sign-ups. This helps you see which marketing channels bring in users who actually convert, engage, and renew.
Tracking conversion behavior inside the product helps refine your go-to-market strategy. If users sign up but never activate key features, your messaging might be off, or your onboarding needs improvement.
For example, if retention rates drop right after the trial period, the problem could be feature discoverability or a lack of perceived value. Identifying these gaps allows you to improve activation and drive long-term adoption
How to use product analytics for growth: Use cases
Product marketing analytics isn’t just about tracking numbers—it’s about taking action based on user behavior. By understanding how users interact with your web product, you can spot friction points, improve feature adoption, and increase retention.
Let’s break down three practical ways product analytics drives growth and how you can apply these insights to turn data into impact.
Use case 1: Improving feature adoption
Adding new features is great, but if users don’t engage with them, they provide zero value. Many companies assume a feature isn’t useful when, in reality, users don’t know it exists or struggle to use it effectively.
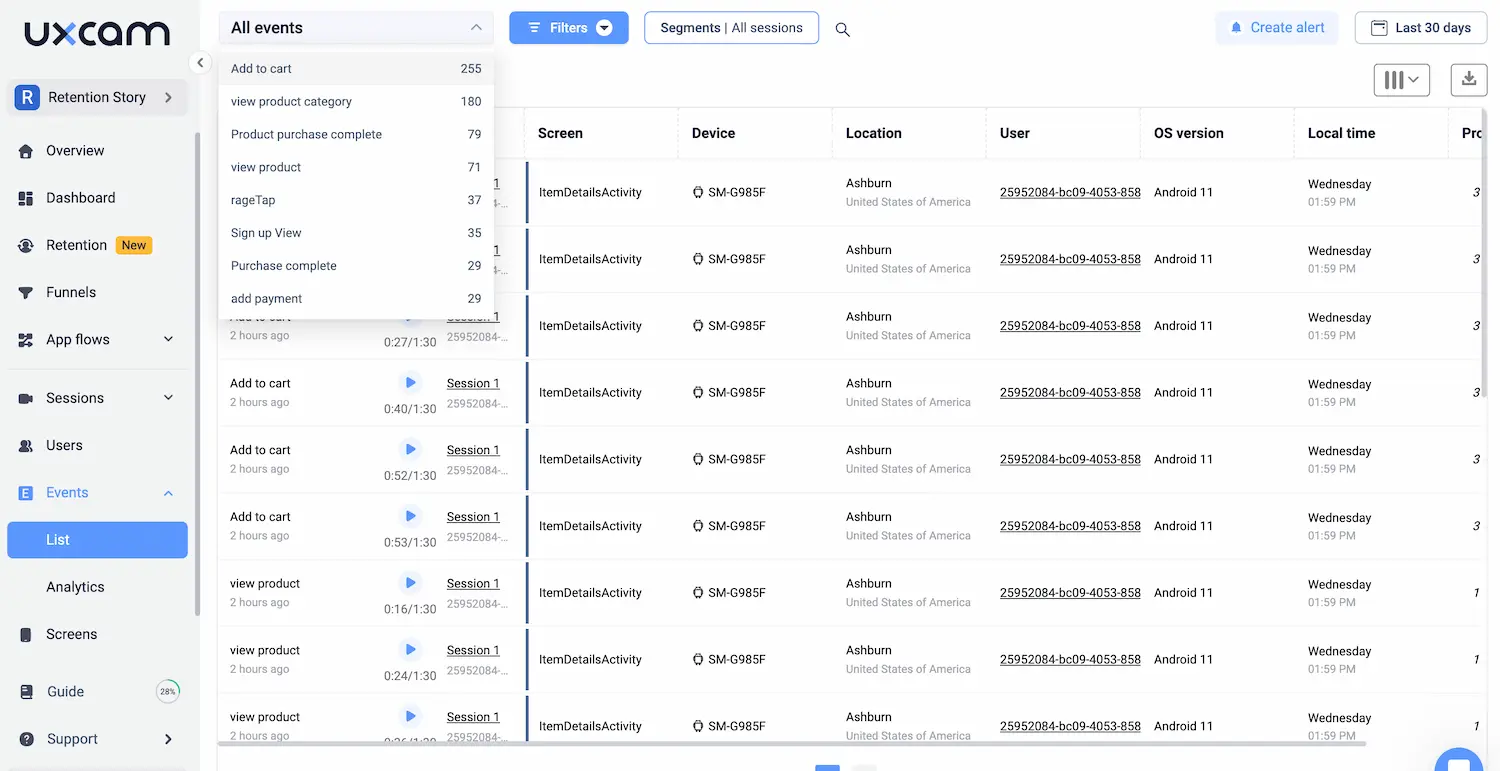
With event tracking in UXCam, you can see exactly how users interact with each feature. Are they clicking on it but not completing an action? Are they skipping it entirely? These insights help you determine whether the issue is visibility, usability, or relevance.
For example, imagine you launch a new reporting dashboard. A month in, UXCam’s session replays and heatmaps show that users open it but rarely generate reports. The problem could be a confusing UI, lack of onboarding guidance, or missing key functionalities.
To address this, you can:
Improve discoverability: Move the feature to a more prominent location or introduce an in-app tooltip explaining its value.
Enhance usability: Adjust the UI based on user behavior insights—such as simplifying form fields or adding a “one-click” setup.
Test variations: Run A/B tests on different layouts, button placements, or onboarding sequences to see what improves engagement.
With funnel analytics, you can track changes over time and see if adjustments lead to higher adoption rates.
Use case 2: Reducing churn
Churn is one of the biggest threats to growth. But users don’t just leave randomly—there are usually early signs that indicate dissatisfaction. The key is identifying these signals before they churn and taking proactive action.
By using cohort analysis and event tracking in UXCam, you can compare behaviors of retained vs. churned users. Some common churn indicators include:
Skipping onboarding – Users who don’t complete onboarding often fail to see the product’s value.
Low feature engagement – If users aren’t engaging with core features, they’re unlikely to stick around.
Session inactivity – A drop in session frequency is a red flag for potential churn.
Once you spot these patterns, automated engagement campaigns can help re-engage users before they leave. Some effective strategies include:
Personalized emails: Send an automated email highlighting underused features and their benefits.
In-app nudges: Use tooltips, pop-ups, or guided tours to encourage users to explore features they’ve ignored.
Customer success outreach: For high-value accounts, a quick check-in call can provide insights into why engagement is dropping and how you can help.
By continuously tracking churn risk behaviors, you can reduce customer drop-off and extend lifetime value.
Use case 3: Increasing conversions
Every user who abandons sign-ups or onboarding represents lost revenue. But without the right analytics, you won’t know why they’re dropping off.
With session replays and funnel tracking in UXCam, you can identify the exact step where users get stuck. Common friction points include:
Lengthy sign-up forms – Too many fields can overwhelm users and cause them to exit.
Unclear onboarding flows – Users might abandon the process if they don’t immediately see the product’s value.
Confusing UI elements – If a CTA button isn’t obvious, users might not take the next step.
To improve conversions, you can:
Optimize sign-up forms: Reduce unnecessary fields, provide autofill options, or add social sign-in for easier access.
Personalize onboarding: Tailor the experience based on user segments (e.g., offer different onboarding steps for a beginner vs. a returning user).
Improve call-to-actions: Use heatmaps to analyze clicks and reposition CTAs for better visibility.
When you refine these elements, you’ll see an increase in activation rates, trial-to-paid conversions, and overall product adoption.
Key product marketing metrics to track
Tracking product marketing metrics isn’t just about collecting data—it’s about understanding how users find, engage with, and return to your web product. Without clear insights, you won’t know what’s working, where users drop off, or how to improve retention.
Each stage of the user journey—acquisition, activation, engagement, and conversion—requires different metrics. By measuring these effectively, you can refine your marketing efforts, optimize onboarding, and improve long-term customer success.
Below are the key product marketing analytics metrics every B2B marketer should track to drive growth and retention.
Acquisition metrics: measuring marketing effectiveness
Bringing users to your web product is just the first step. The real challenge is ensuring you attract high-intent users who will engage and convert. These acquisition metrics help assess the quality and cost-effectiveness of your marketing efforts.
1. Website traffic sources
Where are your visitors coming from—organic search, paid ads, social media, referrals, or direct visits? Knowing this helps you invest more in the channels driving engaged users, not just clicks.
For example, if paid campaigns drive traffic but lead to low engagement rates, you might need to refine your targeting or messaging.
2. Sign-ups & trial conversions
A spike in website visits is great, but if users aren’t signing up, something is broken. Tracking how many visitors sign up for a free trial or request a demo helps measure how well your landing pages, CTAs, and overall messaging convert interest into action.
3. Cost per acquisition (CPA)
How much are you spending to acquire each new user? If CPA is too high and sign-ups don’t convert into paying customers, it’s a sign you need to:
Improve onboarding to increase trial-to-paid conversion.
Target better-qualified leads who are more likely to benefit from your product.
Refine ad targeting and landing page messaging to attract users with a higher likelihood of conversion.
With event tracking and funnel analytics, UXCam helps you see what acquired users do after sign-up. If users drop off before engaging with key features, you can pinpoint where interest fades and why marketing efforts might not be bringing in the right audience.


Activation metrics: ensuring users reach their "Aha" moment
Acquiring users means nothing if they don’t experience the value of your product quickly. Activation metrics track how efficiently users go from signing up to meaningfully engaging with your product.
1. Onboarding completion rate
How many users complete the onboarding process? If a significant portion drops off early, it could mean:
The onboarding flow is too long or complex.
Users don’t immediately see the core benefits of your product.
They encounter technical issues or friction.
2. Time to first value (TTFV)
TTFV measures how long it takes for users to achieve their first success with your product. The faster this happens, the more likely they are to stick around.
For example, if users take too long to set up key features, they might never fully activate. A streamlined onboarding process, guided product tours, and contextual tooltips can significantly improve TTFV.
3. Feature adoption rate
Are users actively engaging with the features that make your product valuable? If certain key features remain underused, you may need to:
Improve discoverability (e.g., better UI placement, onboarding prompts, in-app guides).
Educate users on how these features help them.
Reassess if the feature aligns with user needs.
Session replays and heatmaps show exactly where users drop off or hesitate in onboarding. If users struggle with navigation, get stuck on certain screens, or ignore key features, you can optimize the experience with better UI design, tooltips, and walkthroughs.


Engagement & retention metrics: tracking long-term user behavior
Getting users to sign up is one thing—keeping them engaged is another. These metrics help you track user activity, product stickiness, and churn risk.
1. Active users (DAU, WAU, MAU)
Daily Active Users (DAU) – Measures daily engagement levels.
Weekly Active Users (WAU) – Tracks medium-term usage trends.
Monthly Active Users (MAU) – Shows overall long-term engagement.
A decline in DAU/WAU suggests users aren’t forming strong habits with your product, which could indicate onboarding issues, missing features, or poor user experience.
2. Product stickiness ratio
Stickiness measures how often users return by comparing DAU to MAU. A high stickiness ratio means users keep coming back, while a low ratio suggests they try the product but don’t continue using it.
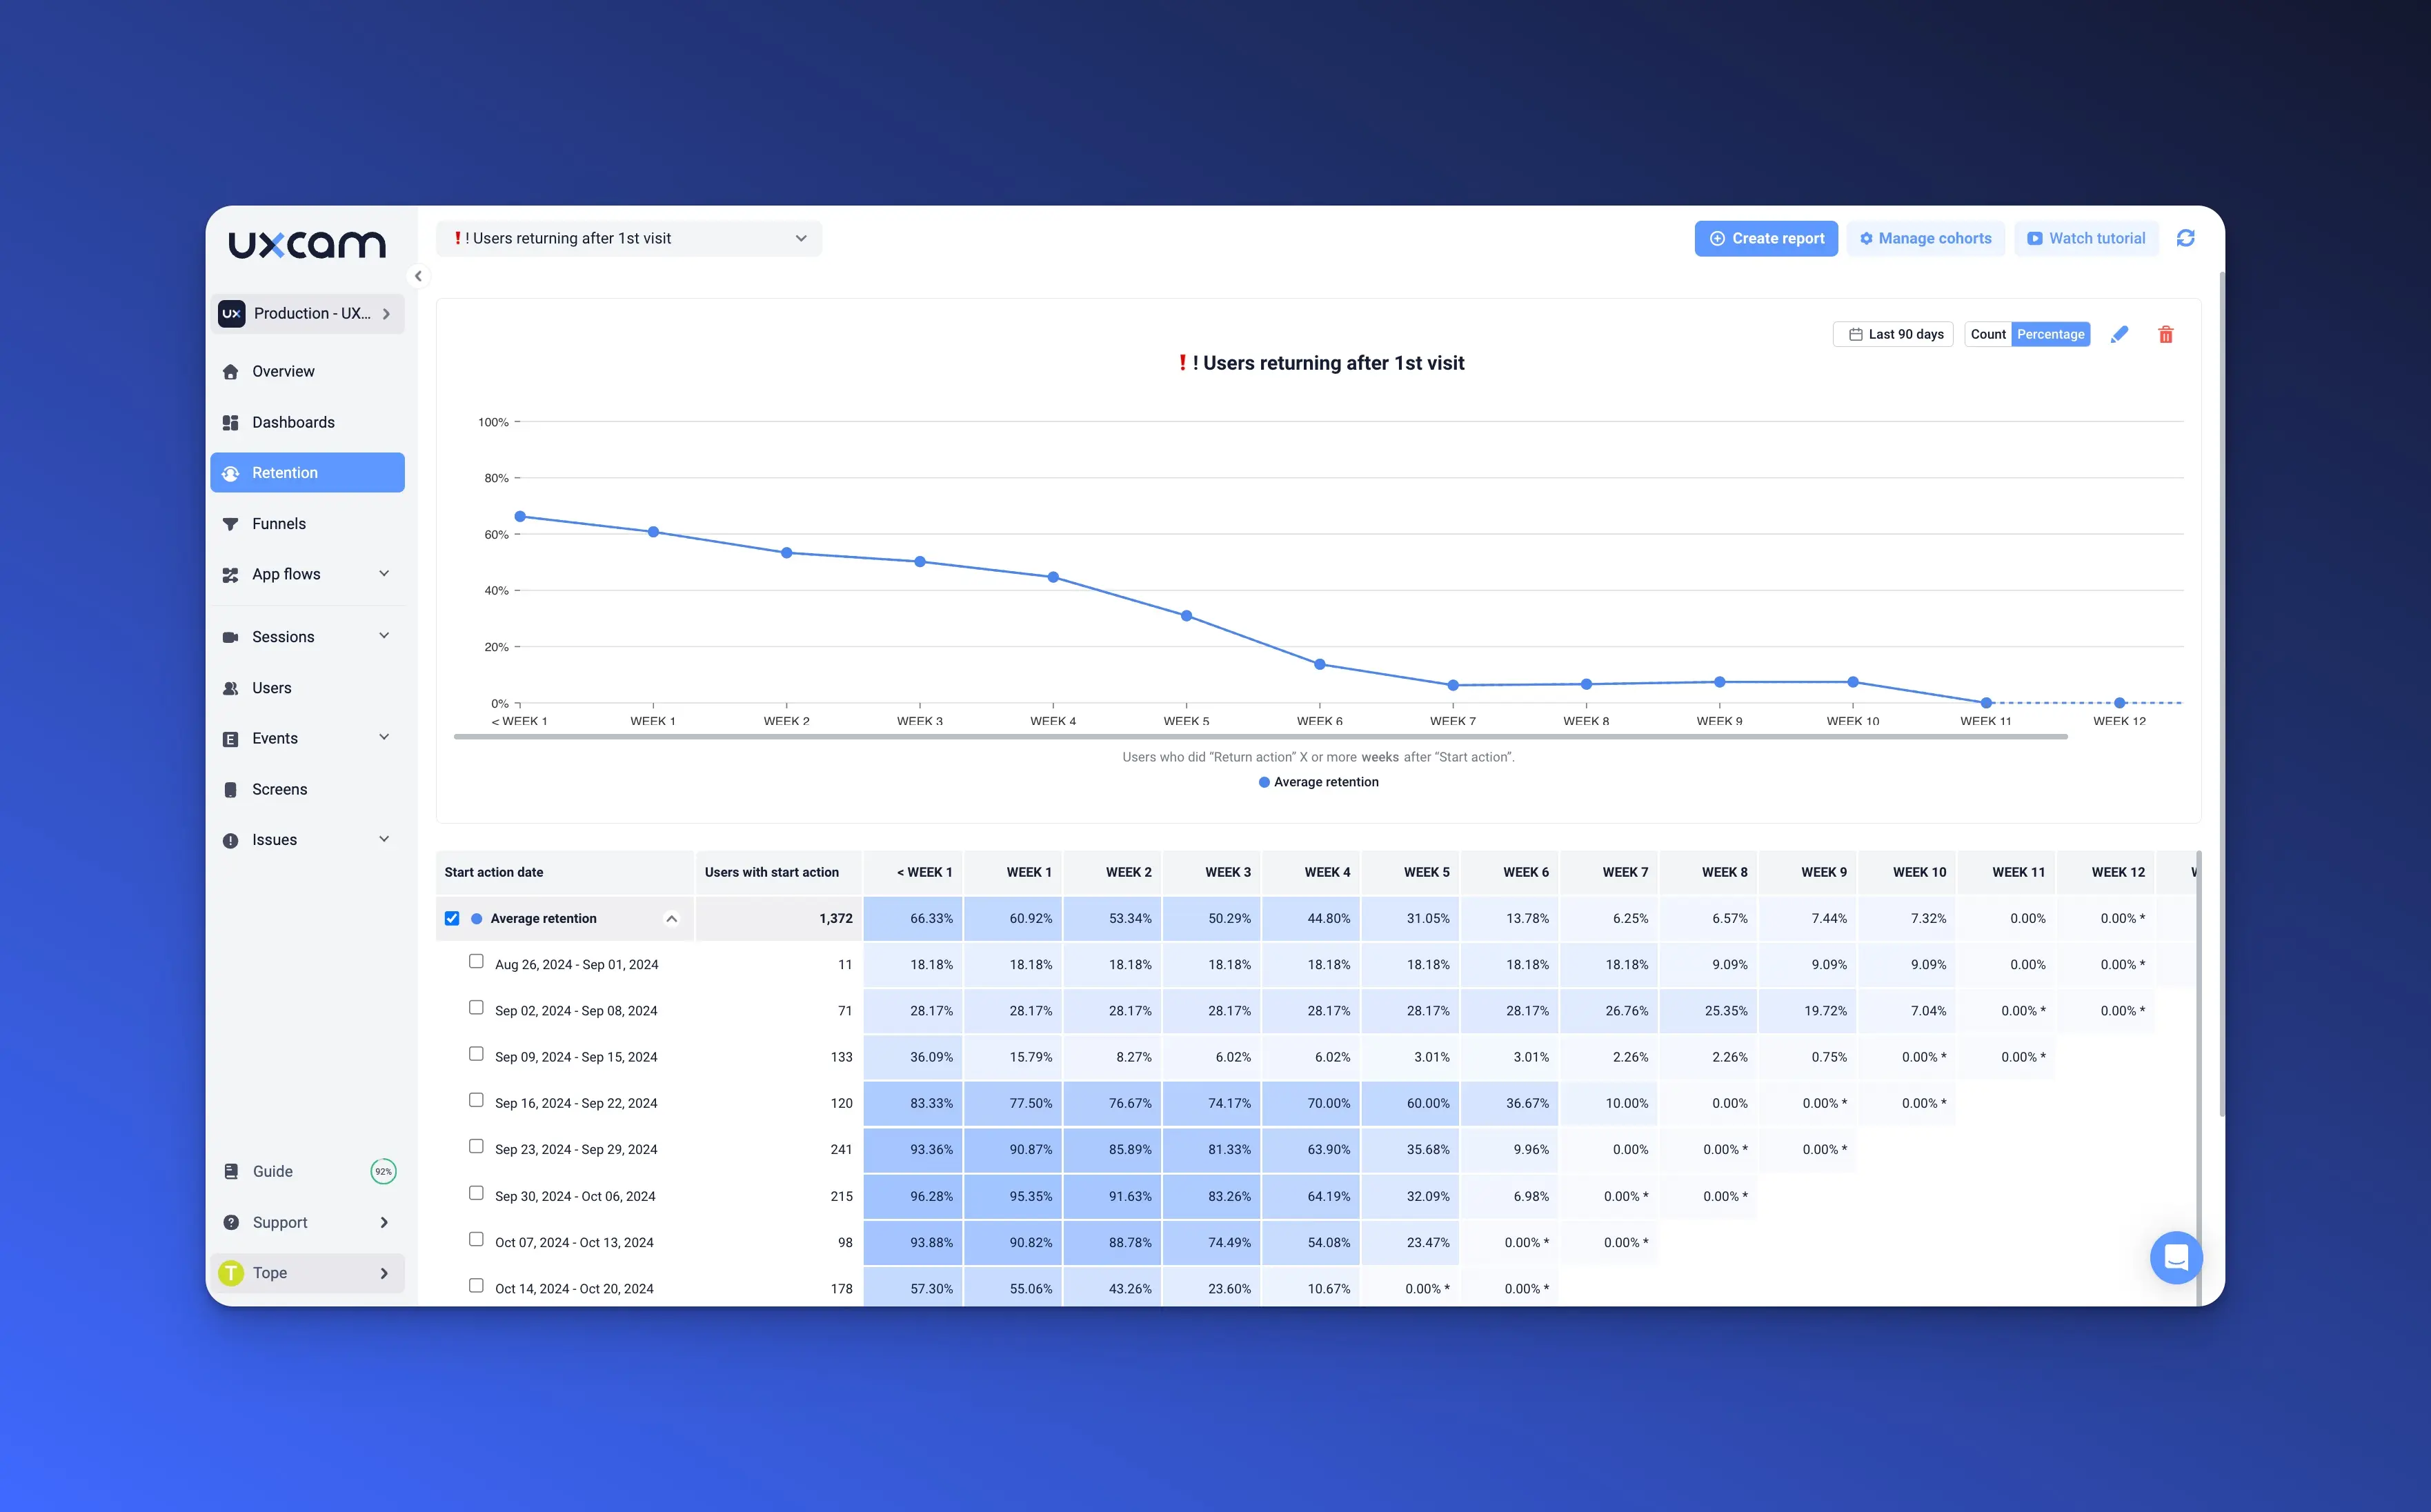
3. Churn rate & retention rates
Retention cohorts help track how long users continue using your product after sign-up. If most users churn within days or weeks, the onboarding or product experience may need improvement. Cohort analysis and event tracking allow you to compare behaviors of retained vs. churned users. If churned users have similar behavior patterns—like skipping onboarding or underusing key features—you can take action before they disengage completely.


Conversion & revenue metrics: measuring business impact
At the end of the day, your product marketing efforts should drive revenue growth. These metrics measure how well you convert free users into paying customers—and maximize their lifetime value.
1. Trial-to-Paid conversion rate
What percentage of trial users convert into paying customers? If this rate is low, it might mean:
The trial experience doesn’t demonstrate enough value.
Users don’t activate core features before the trial ends.
Pricing may be unclear or unappealing.
2. Average Revenue Per User (ARPU)
ARPU helps you understand the monetization potential of your user base. If ARPU is lower than expected, you may need to explore better pricing strategies or plans or upselling and cross-selling opportunities within the product.
3. Customer Lifetime Value (LTV)
LTV measures how much revenue a user generates over their entire customer lifespan. A low LTV may signal poor retention, weak monetization, or a lack of premium offerings.
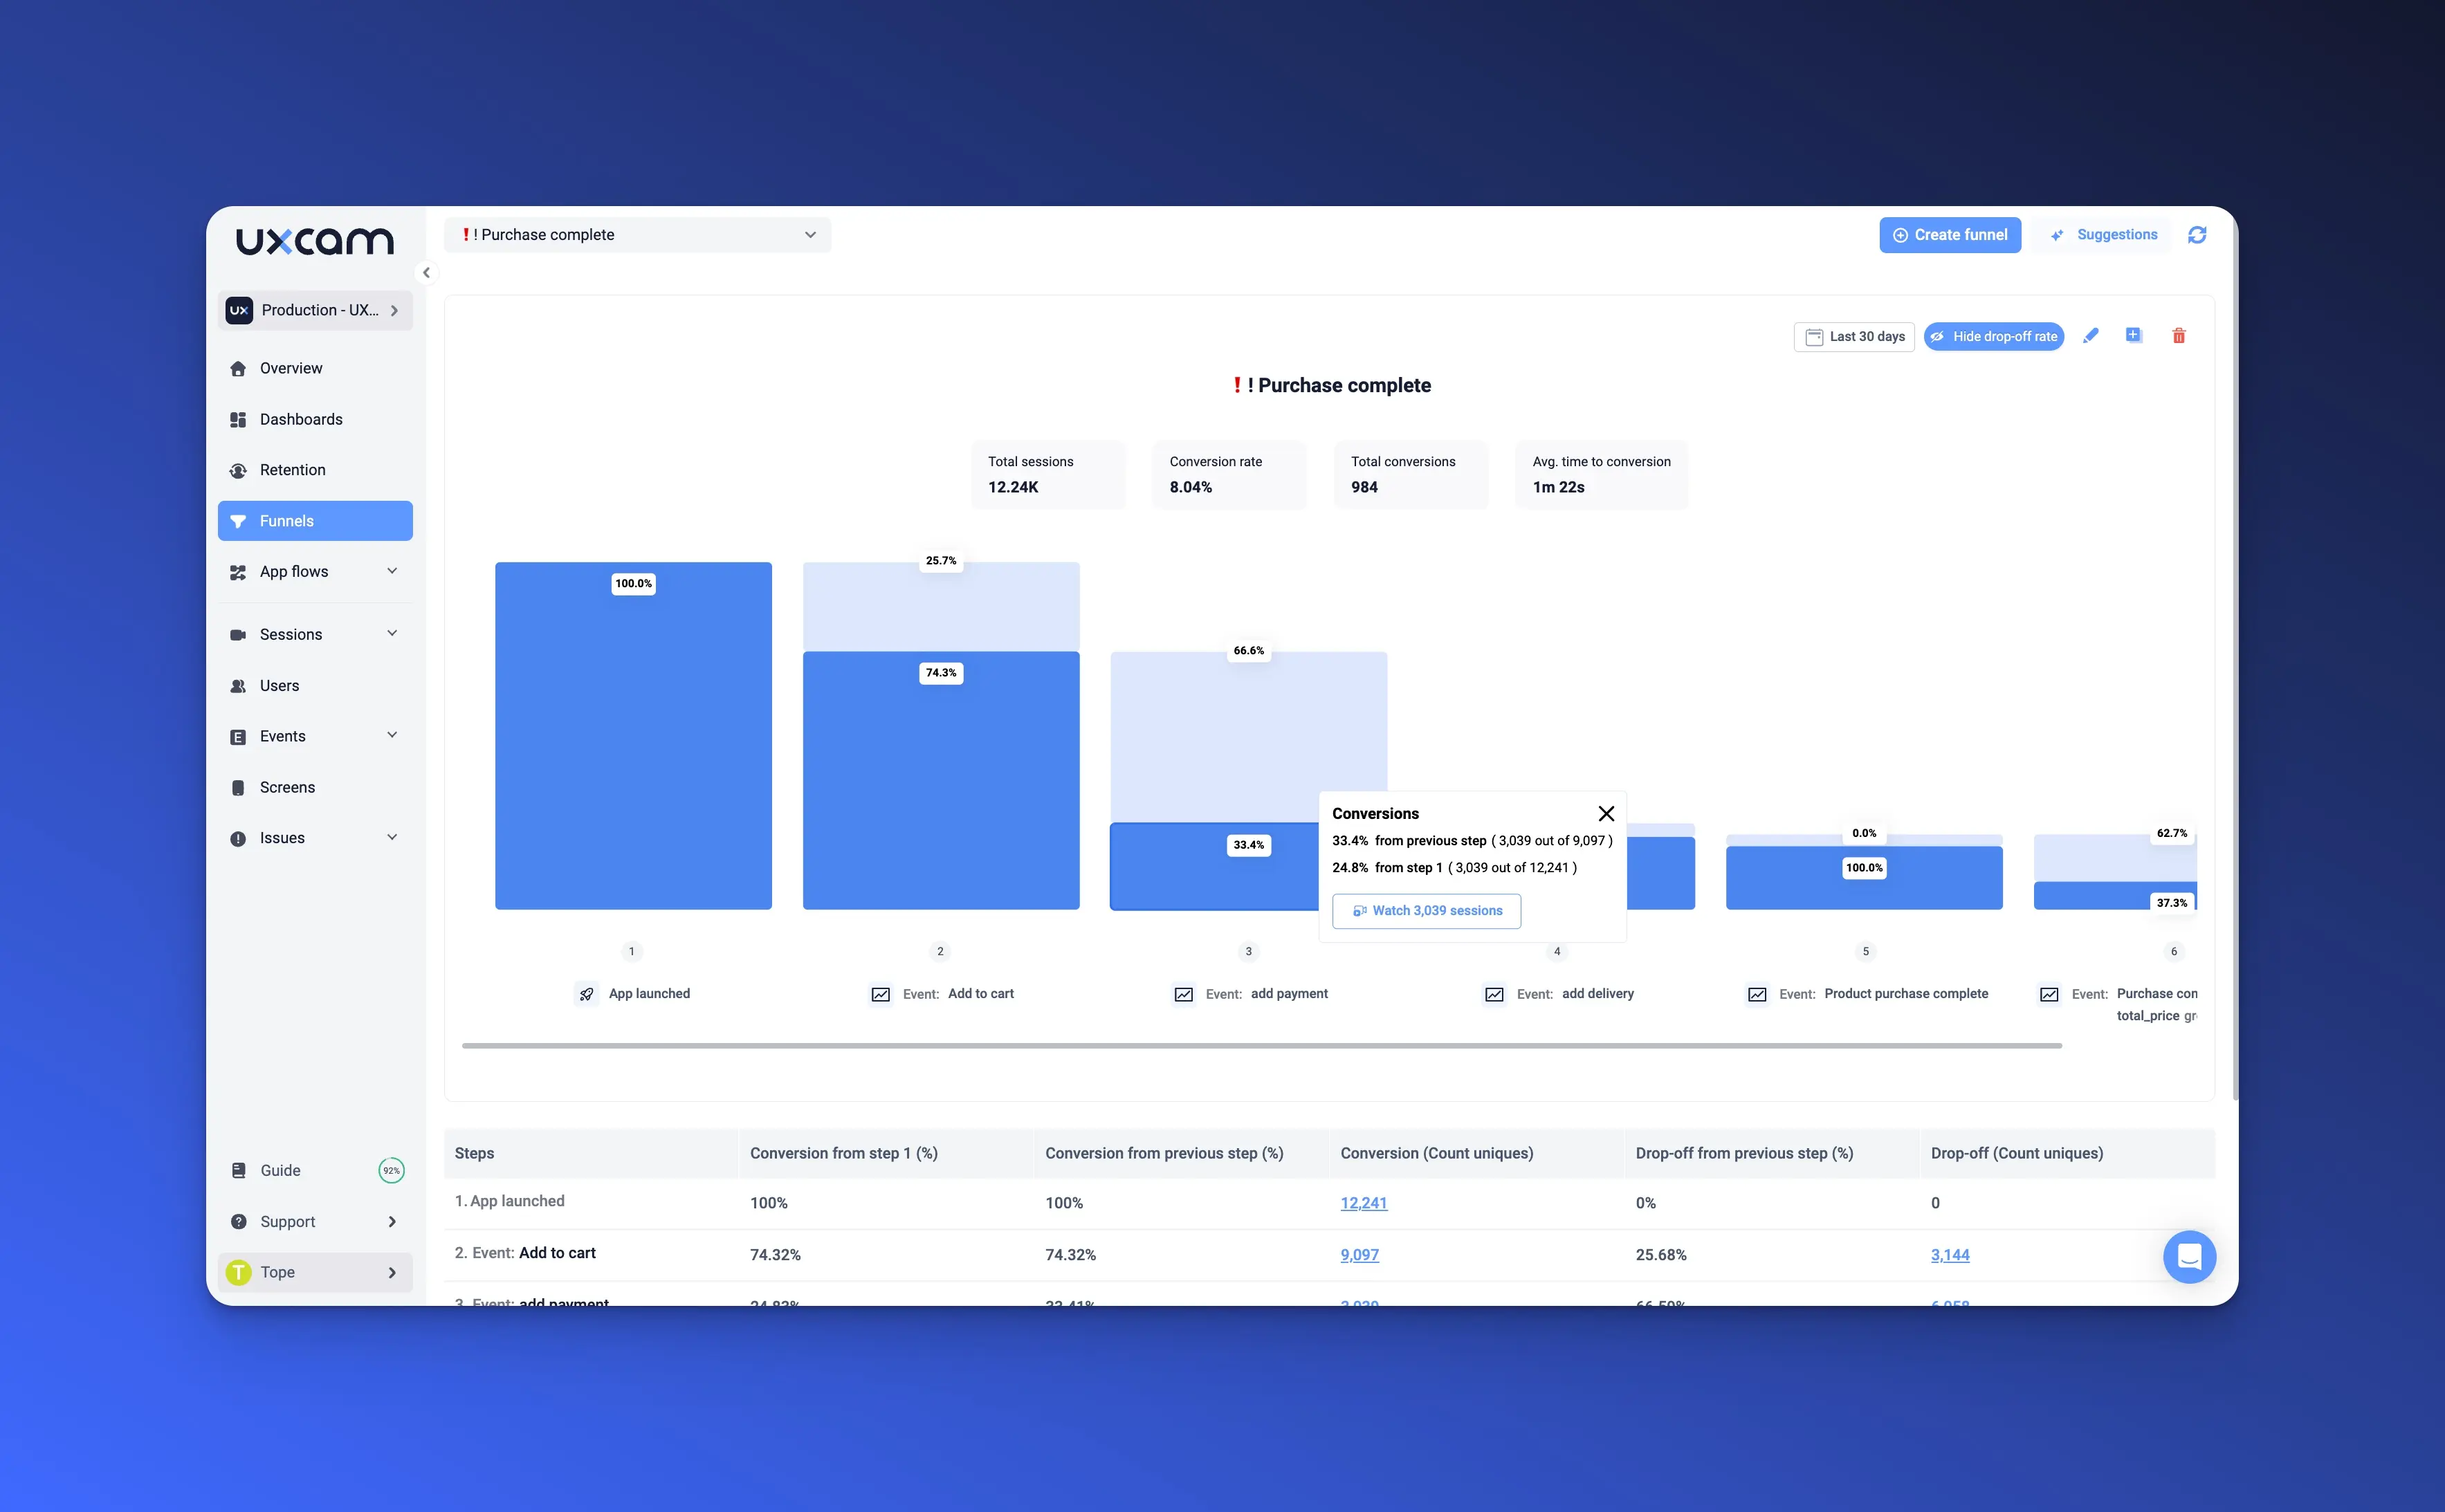
Funnel analytics help pinpoint where potential customers drop off—whether it’s during trial, checkout, or after purchase. By optimizing pricing pages, onboarding flows, and feature access, you can increase conversions and overall revenue.


How to get started with product marketing analytics for your web app
By following these five key steps, you can set up a data-driven analytics strategy that turns raw user data into actionable insights.
Step 1: Define KPIs sased on business goals
Before diving into analytics, define what success looks like for your product marketing efforts. Your KPIs should align with your business goals and user journey stages.
For example:
If your focus is acquisition, track sign-ups, trial activations, and cost per acquisition (CPA).
If activation is a priority, monitor onboarding completion rates and time to first value (TTFV).
If you want to improve engagement and retention, analyze active users (DAU, WAU, MAU) and churn rates.
If your goal is revenue growth, focus on trial-to-paid conversion rates and customer lifetime value (LTV).
Defining clear KPIs ensures that you measure what matters instead of getting lost in vanity metrics.
Step 2: Set up tracking for events, sessions, and funnels
Once your KPIs are set, the next step is to track key user interactions within your web product.
Instead of relying solely on page views, use event tracking to monitor:
Feature usage – Identify which features users engage with most and which are underutilized.
Button clicks – Understand where users interact and where they hesitate.
Drop-off points – Discover where users abandon workflows and why.
Tracking conversion funnels is crucial for understanding user progression through key flows, such as:
Sign-up → Onboarding → Feature Adoption → Subscription (for SaaS products).
Landing Page → Free Trial → Paid Upgrade (for freemium models).
With UXCam’s autocapture technology, event tracking happens automatically, reducing engineering effort. This means you get instant insights into how users interact with your product—without requiring extensive manual setup.
Step 3: Analyze user behavior patterns & conversion blockers
Raw data alone isn’t enough—you need context to understand why users behave a certain way.
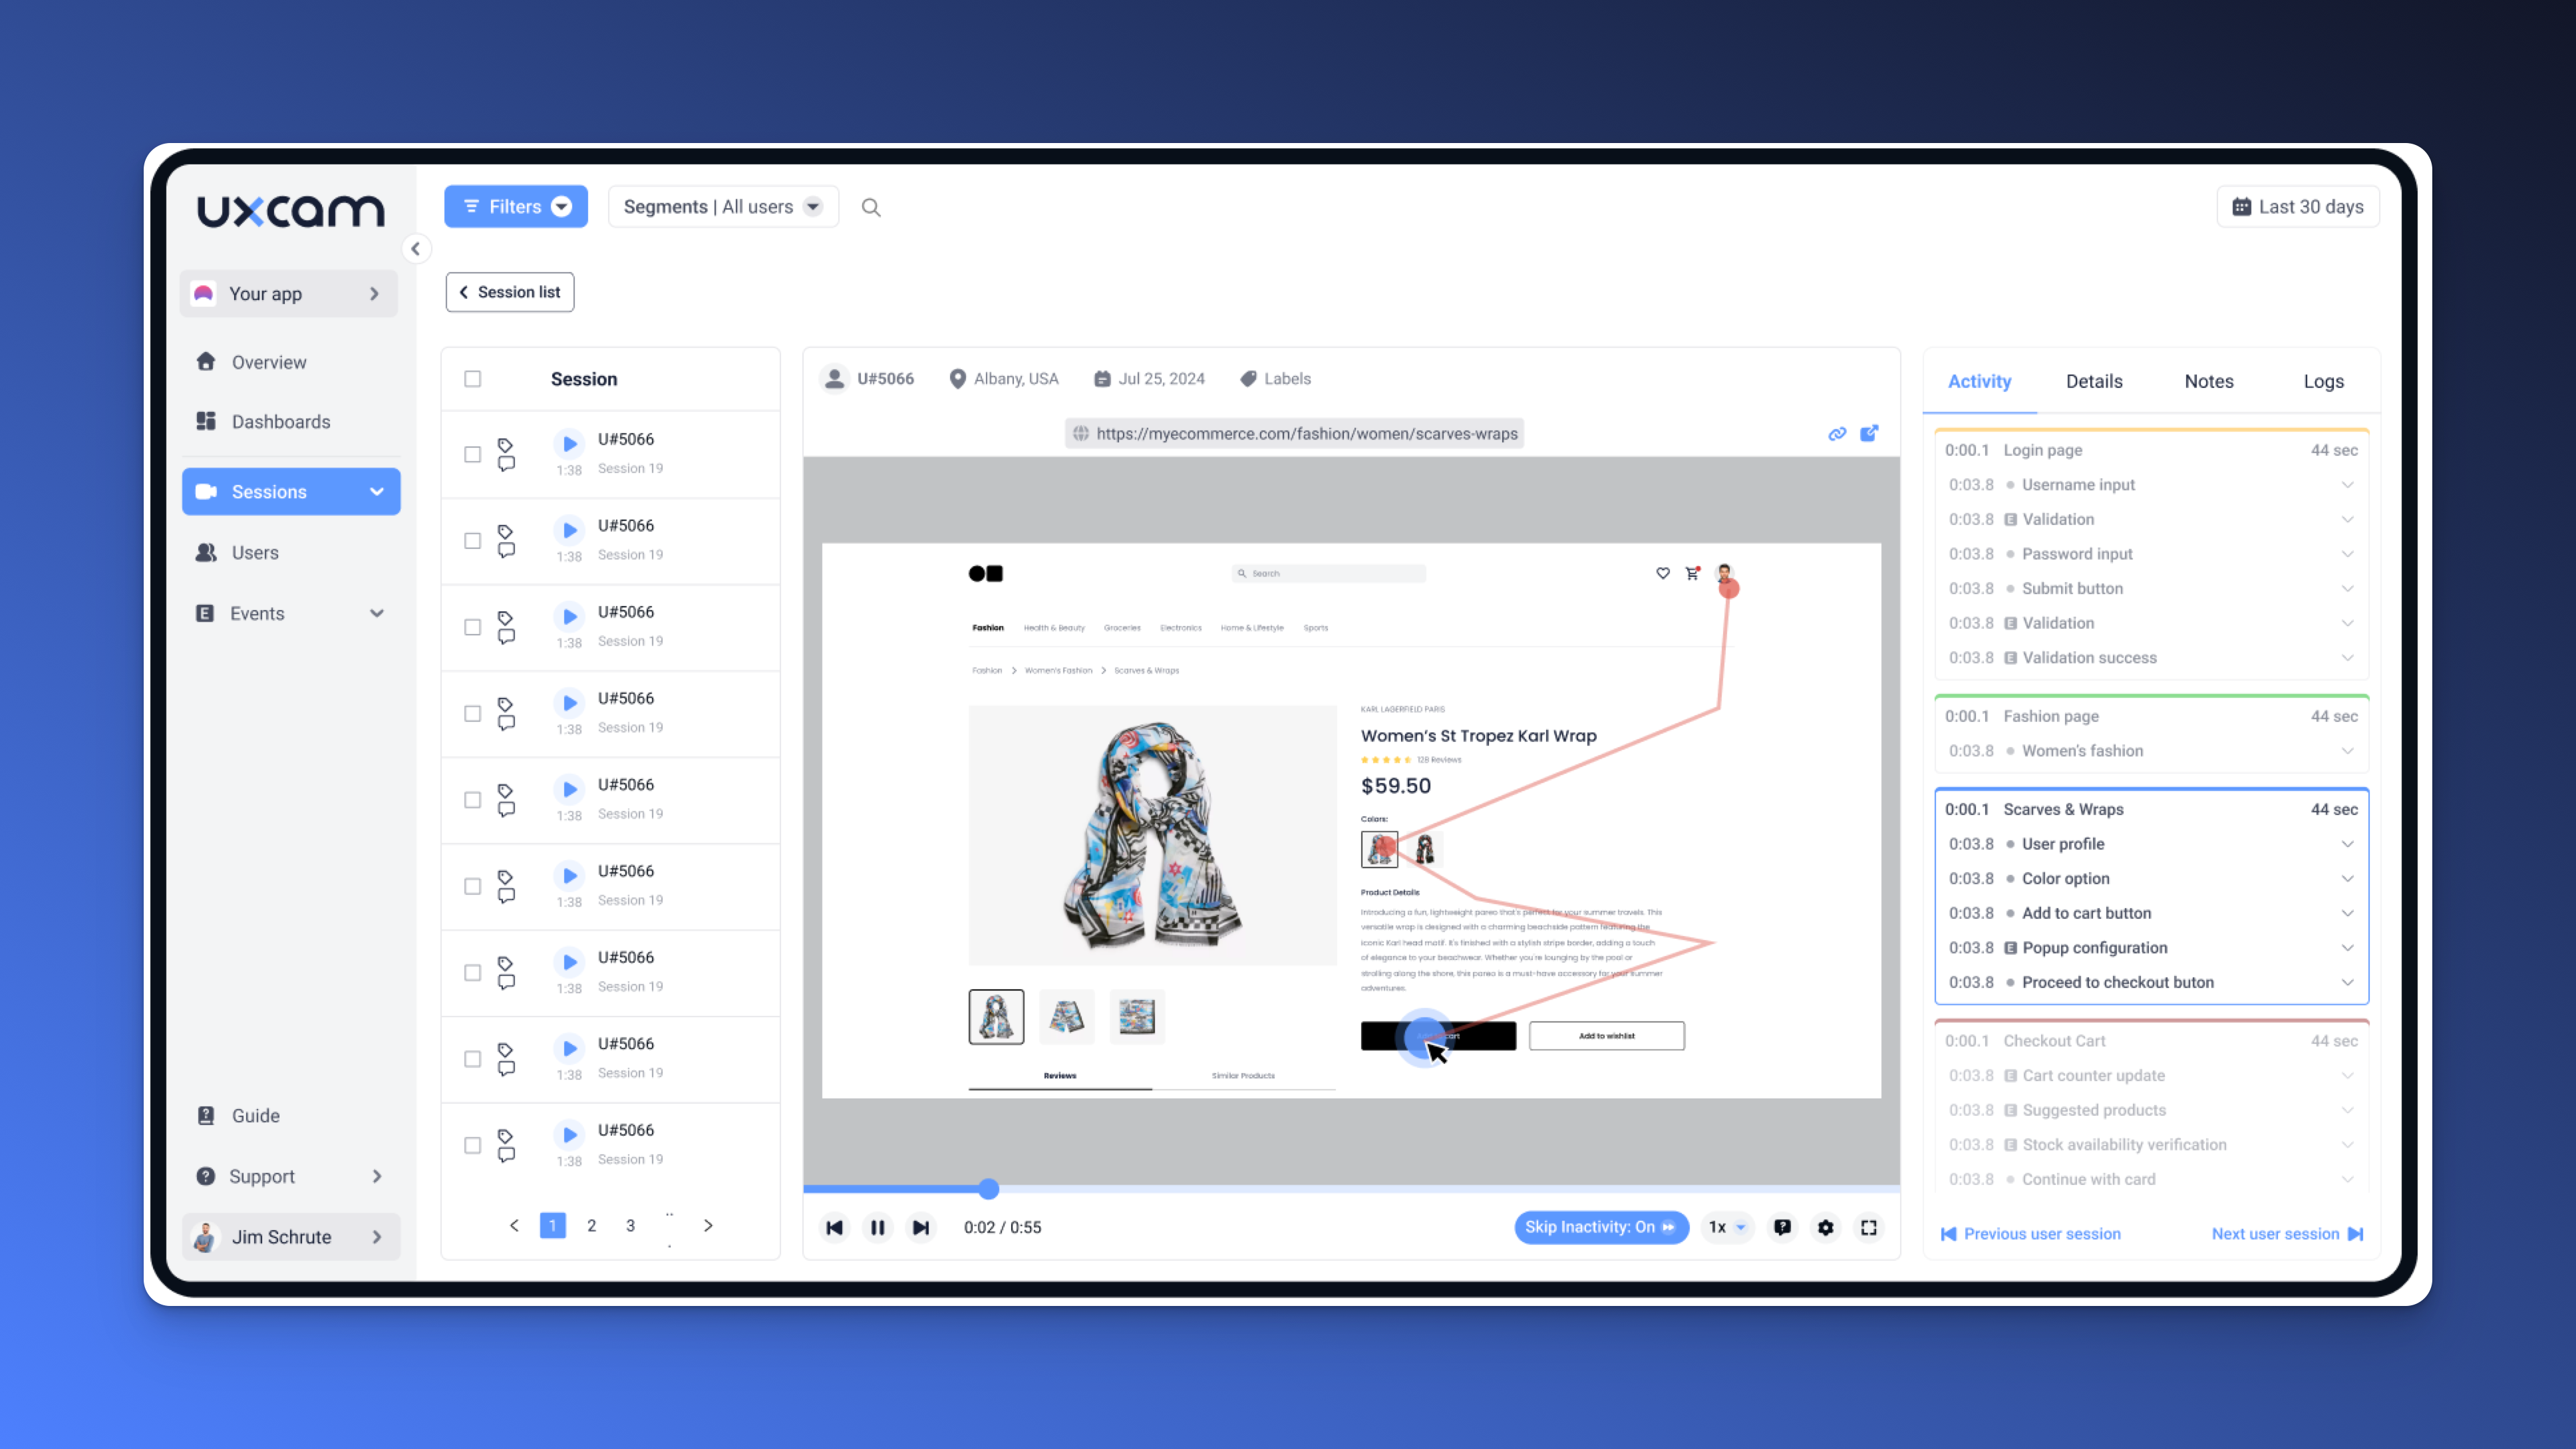
Using session replays, heatmaps, and event tracking in UXCam, you can:
Pinpoint where users get stuck – If users abandon onboarding, session replays reveal whether they’re confused, encountering friction, or missing key steps.
Identify underutilized features – Heatmaps show where users focus their attention and which features go unnoticed. If a feature is critical but ignored, it may need better visibility or onboarding support.
Optimize CTAs and workflows – If conversions are low, button tracking and A/B testing can help refine CTA placement, form design, and navigation flow.
For example, if trial users frequently navigate to the pricing page but don’t upgrade, session replays can reveal if they’re hesitant due to unclear value propositions or pricing confusion.
Instead of making assumptions, leverage real user behavior insights to improve the user journey.
Step 4: Optimize & A/B test product experiences
Once you've identified problem areas, the next step is testing improvements. Small adjustments in onboarding flows, feature positioning, or call-to-action placements can significantly boost engagement and conversions.
A/B testing allows you to compare different approaches, such as:
Guided tutorials vs. self-serve onboarding – Do new users convert better when walked through a step-by-step flow, or when left to explore on their own?
CTA placement – Does a "Start Free Trial" button work better above the fold or next to a high-engagement feature?
Feature discovery prompts – Do tooltips, modals, or in-app messages improve adoption of underutilized features?
With UXCam’s funnel analytics, you can track which variations perform better and make data-driven optimizations rather than guessing.
For instance, if an A/B test shows that users who complete a tutorial have a 30% higher trial-to-paid conversion rate, making onboarding mandatory could drive higher long-term engagement.
Step 5: Automate insights with a product analytics with UXCam
Manually analyzing data across different platforms is inefficient. Automating insights with UXCam allows you to:
Monitor user behavior in real-time with session replays and heatmaps to detect pain points early.
Receive automated alerts when friction points increase, such as sudden drops in onboarding completion or feature adoption.
Segment users based on behavior patterns to deliver personalized onboarding, marketing campaigns, and re-engagement efforts.
By integrating product analytics into your workflow, you create a self-optimizing system that continuously collects, analyzes, and refines user engagement—without extra effort.
Best product marketing analytics tool: Why UXCam stands out
Tracking website visits and campaign performance is just the starting point of product marketing analytics. What really matters is understanding how users engage with your product, where they drop off, and what ultimately drives conversions. Most analytics tools only give you part of the picture, leaving teams juggling multiple platforms to connect the dots on user behavior.
The Challenge: Fragmented Product Analytics
Traditional analytics tools often fall short in connecting quantitative data (metrics, funnels, events) with qualitative insights (session replays, heatmaps, behavior analysis). Many companies juggle multiple tools—Google Analytics for acquisition, Mixpanel for event tracking, and FullStory for session replays—creating inefficiencies and data inconsistencies.
UXCam eliminates this fragmentation by providing a single solution that combines product analytics with session replay, making it easier to uncover why users behave the way they do inside a web product.
UXCam is built specifically to help marketers and product teams uncover friction points, improve user experience, and increase conversions—without the complexity of traditional analytics platforms.
Unlike tools that require manual event tracking and complex setup, UXCam’s autocapture technology provides immediate insights into feature usage, session behavior, and user interactions, helping teams make faster, data-driven decisions.
Here’s why UXCam is the best product analytics solution for B2B marketers:
1. No more switching between tools—seamless data connection
One of the biggest pain points in analytics is fragmented data. Many organizations rely on separate tools for session replay, user behavior tracking, and funnel analysis, forcing teams to manually piece together insights.
With UXCam, you get session replays, funnel analytics, and event tracking—all in one place. Instead of switching between tools, you can:
Watch session replays directly connected to user analytics data.
Click into session recordings from reports and dashboards in a single click.
Jump from high-level trends to granular user interactions effortlessly.
This seamless integration of qualitative and quantitative insights saves time, improves collaboration across marketing and product teams, and ensures complete data consistency.
For example, If conversion rates drop at a specific step in the onboarding funnel, UXCam allows marketers to immediately watch user sessions at that step—revealing whether users experience confusion, hesitation, or technical issues.
2. Autocaptured event tracking—faster time to insight
Unlike tools that require manual event instrumentation, UXCam captures user interactions automatically, reducing engineering dependency and speeding up time to insights.
With intelligent autocapture, UXCam records:
Form submissions and inputs helping marketers identify drop-offs in lead capture.
Page navigation and U-turns to track where users hesitate or leave.
Rage clicks and friction events revealing points of frustration.
This means B2B marketers can start analyzing user behavior instantly, without waiting for developers to define and track events.
For instance, instead of manually setting up tracking for a "Request Demo" button, UXCam automatically records interactions so you can immediately see how users engage with the CTA and optimize its placement if needed.
3. Advanced Segmentation for Precision Marketing
Generic analytics tools often lack the depth needed to segment users meaningfully. UXCam enables marketers to filter and analyze user behavior based on real engagement data, helping them target the right users with the right message at the right time.
With granular segmentation, you can:
Identify power users vs. disengaged users and adjust marketing strategies accordingly.
Track activation trends by company size, industry, or user role.
Create custom user cohorts based on real-time behaviors, not just traffic sources.
This level of accuracy ensures that marketing efforts are not just based on guesswork, but on real user engagement data.
With UXCam, a B2B marketer can segment trial users who completed onboarding but didn’t convert and use this insight to make a decision to send targeted follow-ups explaining the benefits of premium features.
4. Built for web products—not just websites
Most traditional analytics tools are built for static websites, tracking page views and bounce rates but failing to capture complex user journeys in web applications.
UXCam is designed specifically for modern web products, including SaaS platforms, B2B applications, and interactive tools. It tracks dynamic user interactions, form fills, in-app navigation, and feature adoption, providing a complete picture of how users experience a product.
This makes UXCam ideal for:
SaaS platforms looking to optimize free trials and onboarding.
B2B applications that need to track multi-step workflows and feature adoption.
Web-based tools with complex user flows beyond simple website interactions.
5. Session replay meets deep analytics—No more guessing why users drop off
Many analytics tools offer either deep event tracking or session replays—but rarely both without added complexity.
UXCam combines session replays with in-depth product analytics, ensuring teams can:
Watch exactly what happened when users dropped off in a funnel.
See rage clicks and frustration signals without guessing why users churned.
Validate which UI/UX changes improve conversion rates based on real user interactions.
Instead of just knowing that users aren’t completing onboarding, UXCam shows why—whether it’s confusing navigation, unclear instructions, or hidden features. This eliminates the guesswork in product marketing, allowing teams to make faster, data-driven optimizations.
How UXCam compares to other analytics tools
| Tool | Best For | Limitations |
|---|---|---|
| UXCam | Deep product analytics + session replay in one tool | No deep channel attribution tracking |
| Google Analytics | Website traffic and acquisition insights | Lacks in-product behavior tracking |
| Mixpanel | Event-based analytics and funnel tracking | Requires manual event setup |
| Amplitude | Behavioral segmentation and retention analysis | Complex implementation |
| Heap | Autocaptured event tracking | High cost, limited flexibility |
Conclusion and next steps
Product marketing analytics is evolving fast. AI and automation are making it easier to uncover behavioral insights in real-time, allowing marketers to optimize the user journey without manual effort. At the same time, privacy-friendly tracking is becoming essential, ensuring that businesses collect meaningful, compliant data without compromising user trust.
To stay competitive, marketers need tools that go beyond basic traffic reports—solutions that provide deep in-product analytics, friction detection, and instant insights. Choosing the right platform can be the difference between guessing why users drop off and knowing exactly how to fix it.
With UXCam’s powerful session replays, event tracking, and heatmaps, you can take action on real user behavior. Try UXCam for free today and start making data-driven decisions that drive growth.
You might also be interested in these;
Product Analytics Examples - 5 Case Studies to Inspire You
How to measure product adoption (metrics, formulas & tools)
Best product analytics tools and software
Product insights - Definition, benefits & practical examples
Top 11 product management KPIs to track
Top 14 SaaS Product Usage Metrics and How to Improve Them
AUTHOR
Tope Longe
Product Analytics Expert
Ardent technophile exploring the world of mobile app product management at UXCam.


Related articles


Website Optimization
10 Best Landing Page Optimization Tools
Boost conversions with the 10 best landing page optimization tools. Compare features, pricing, and use cases for growth-focused...
Tope Longe
Product Analytics Expert


Website Optimization
10 Proven Web Analytics Best Practices for Product Teams
Discover 10 proven website analytics best practices to boost product performance, improve user insights, and drive growth—plus a free UXCam Web...
Tope Longe
Product Analytics Expert


Website Optimization
12 Actionable Strategies to Improve Website Engagement
Boost user engagement with 12 proven strategies. Learn how to use website analytics, session replays, and behavior insights to improve conversions and...
Tope Longe
Product Analytics Expert