Product Optimization: What It Is and How to Do It in 5 Steps


TABLE OF CONTENTS
- Key takeaways
- What is product optimization?
- Why product optimization matters
- The 5-step product optimization process
- 14 Product Optimization Patterns
- Industry-specific optimization considerations
- The product optimization toolkit by category
- 10 common mistakes that kill optimization programs
- How we evaluated product optimization approaches
- 90-Day Optimization Maturity Roadmap
- Why UXCam for Product Optimization
Product optimization is the continuous process of using behavioral data, user feedback, and performance signals to improve how a product serves its users, raising engagement, retention, and revenue in the process. I've reviewed hundreds of mobile and web products inside UXCam, and the teams that get this right treat optimization as a weekly operating rhythm, not a quarterly project.
This guide walks through what product optimization actually means in 2025, why it matters more than ever with AI-driven analysis in the mix, and the five-step process I recommend to every product team I work with, whether they're shipping an MVP or running a global app with millions of sessions a month.
Key takeaways
Product optimization is the disciplined loop of measuring user behavior, identifying friction, shipping targeted fixes, and validating impact against KPIs.
The biggest wins come from combining quantitative data (funnels, events, conversion rates) with qualitative evidence (session replays, heatmaps, rage taps).
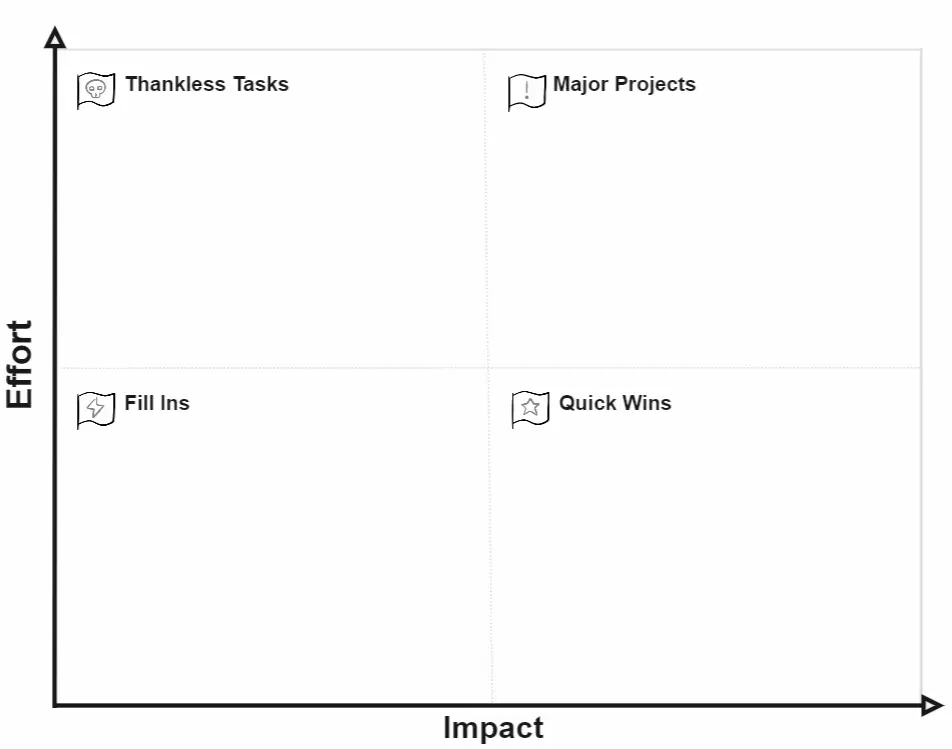
Prioritize optimizations using an Impact vs. Effort view so you're not burning sprints on cosmetic changes.
Tara AI inside UXCam now processes thousands of sessions and surfaces the patterns that matter, cutting analysis time from days to minutes.
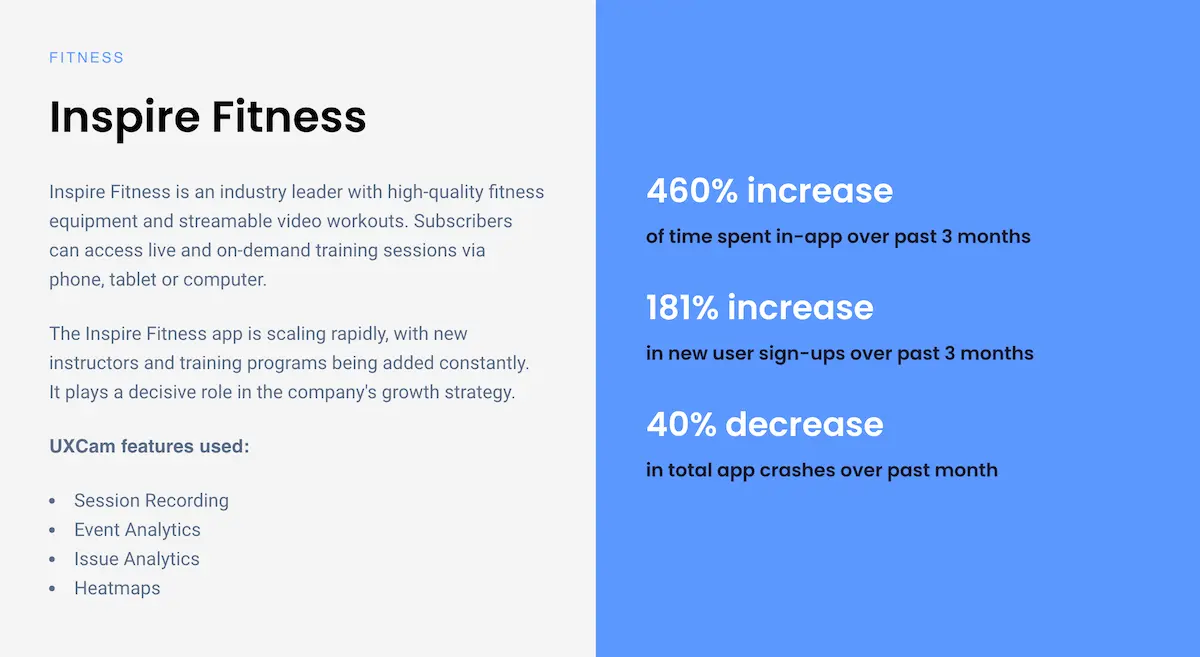
Real results: Recora cut support tickets by 142%, Inspire Fitness grew time-in-app by 460%, Housing.com doubled feature adoption from 20% to 40%, and Costa Coffee lifted registrations by 15%.
The fastest path to better outcomes is installing session replay and issue analytics before you start changing code.
What is product optimization?
Product optimization is the practice of improving a live product, its features, flows, performance, and UX, so it delivers more value to users and more business outcomes to the company. The pattern I see most often in teams that do this well: they stop treating "launch" as the finish line and start treating every release as a hypothesis that needs to be validated against real behavior.
In practice, product optimization covers four interlocking areas:
Usability optimization. Removing friction in core flows (onboarding, checkout, search).
Performance optimization. Reducing crashes, UI freezes, and slow load times.
Feature optimization. Increasing adoption and proper use of existing features.
Conversion optimization. Moving more users through funnels toward revenue events.
The reason search volume around "what is product optimization" keeps climbing is simple: acquisition costs have roughly doubled since 2013 according to SimplicityDX, and teams that can't squeeze more value from the users they already have are losing money. Optimizing the product is cheaper than buying more traffic. Profitwell's retention research pegs the cost of new-customer acquisition at roughly five times the cost of keeping an existing one, which is why optimization budgets are shifting away from paid media and toward product intelligence.
For a concrete example, look at Inspire Fitness. Their team used UXCam's session recordings, event analytics, and heatmaps to rebuild their content strategy and feature flows around actual user behavior. The results: a 460% increase in time spent in-app, a 181% lift in new user sign-ups, and a 40% decrease in app crashes. That's not a redesign. That's optimization applied with discipline.


Why product optimization matters
It keeps your UX defensible
Users don't grade your app against your last release. They grade it against whatever they opened before yours. PwC's Future of Customer Experience study found that 32% of customers will walk away from a brand they love after a single bad experience. Continuous optimization is what keeps you from being the bad experience.
It compounds performance gains
Crashes, UI freezes, and slow-rendering screens aren't just annoying, they're retention killers. Google's research shows bounce probability increases 32% as page load time goes from 1 to 3 seconds. Optimization work here has outsized payoff because every user benefits.
It turns retention into a flywheel
Bain & Company's classic research found that a 5% increase in retention produces anywhere from 25% to 95% profit lift. A well-optimized product keeps users engaged, and engaged users become the compounding asset you build the business on. Our own retention analytics work with clients shows the biggest retention wins come from fixing the boring stuff: onboarding friction, confusing empty states, broken permission prompts.
It's how you earn executive trust
When product teams can point to a specific optimization, "we changed the signup screen and lifted activation by 12%", they get more budget, more headcount, and more autonomy. Optimization is the receipts your team needs.
The 5-step product optimization process
I've walked dozens of teams through this loop. It's not glamorous, but it works.
Step 1: Instrument with the right analytics stack
Product optimization isn't a hunch machine. It's a data pipeline that turns observed behavior into targeted fixes. Before you change anything, you need visibility into what users are actually doing.
A complete optimization stack covers three layers:
Quantitative product analytics. Event tracking, funnels, retention cohorts, conversion rates. This tells you what is happening and how often.
Qualitative behavioral analytics. Session replay, heatmaps, rage taps, UI freezes, crash logs. This tells you why it's happening.
Voice-of-customer data. App store reviews, NPS, support tickets, in-app surveys. This tells you how users feel about it.
UXCam covers the first two layers natively and is installed in more than 37,000 products, for mobile apps and the web with full web support. Recora is a good example of why the qualitative layer matters: their heatmaps showed that older users were instinctively pressing and holding buttons in the app like a physical TV remote. The team had no way of knowing that from funnel drops alone. Adding press-and-hold support reduced support tickets by 142%.
This is also where Tara AI, our AI analyst inside UXCam, pulls its weight. Tara reviews thousands of sessions, clusters friction patterns, and recommends specific fixes, which is the difference between "we have the data" and "we know what to ship next."
Step 2: Define goals, baselines, and SMART objectives
With instrumentation live, you have a catalog of friction. Now you need to turn it into a prioritized list.
Start by listing every friction point you can observe: rage taps on a specific screen, abandoned funnels, crash-prone flows, features with low adoption. Then run each item through an Impact vs. Effort matrix. The Impact-Effort matrix from Facilitator School is a clean template if your team doesn't already use one.


Once priorities are set, convert the top items into SMART objectives with baselines. Don't say "reduce crashes." Say "reduce UI freezes on the checkout screen from 4.2% of sessions to under 1% within two sprints." Every optimization target needs a baseline number you can point to later.
This step is also where you decide your guardrails. If you're optimizing conversion, pick a retention or satisfaction metric to watch so you don't accidentally push users through a funnel they'll churn out of next week.
Step 3: Generate hypotheses from real evidence
With objectives locked, brainstorm the specific changes that might move the metric. The mistake I see teams make is running this step purely off opinions. The teams that ship the biggest wins source hypotheses directly from behavioral evidence.
For each objective, pull up:
Session replays of users who failed the flow. Watch 10-15 of them back to back.
Heatmaps of the screens in question. Look for dead zones, unexpected tap clusters, and scroll drop-off.
Rage tap and UI freeze reports to catch the micro-frustrations users won't tell you about in a survey.
Funnel drop-offs segmented by device, OS, and cohort to see if the problem is universal or isolated.
From there, your hypotheses write themselves: "Users are tapping on the price label because they expect it to expand product details. If we make it a tappable accordion, we should see checkout completions rise."
Pair this with qualitative research, user interviews or a lightweight survey, for the biggest bets. Nielsen Norman Group's research shows five user interviews will surface 85% of usability issues, so you don't need a huge sample to validate direction.
Step 4: Build, schedule, and ship
Now you execute. Assign owners, set timelines, and define what "done" looks like for each optimization. Map dependencies so engineering isn't blocked on design and vice versa.
A few practical rules I apply here:
Ship behind a flag when possible. A/B tests give you the cleanest signal, and the top A/B testing tools integrate cleanly with most analytics platforms.
Don't bundle unrelated changes. If you change three things at once and the metric moves, you don't know which change did it.
Document the hypothesis, the expected lift, and the actual result. This becomes the institutional memory your team will lean on for years.
For larger optimization programs, build a dashboard that tracks all live optimizations in one place. UXCam's customizable dashboards let you drag-and-drop widgets for conversion rates, feature engagement, load speed, and any custom event you care about.


Step 5: Measure, validate, iterate
An optimization isn't finished when the code ships. It's finished when you've measured the impact against the baseline you set in Step 2.
For each change, ask:
Did the target metric move, and by how much?
Did any guardrail metrics regress?
Did the change affect all user segments equally, or did some cohorts benefit more than others?
What did we learn that changes the next round of hypotheses?
Optimizations that work get expanded. Optimizations that don't get rolled back and feed into the next hypothesis cycle. This is where Tara AI saves teams real time, it flags the cohorts and screens where the new change is underperforming, so you don't have to hand-slice replays for a week to find out.
Housing.com ran this loop on their property discovery flow and grew feature adoption from 20% to 40%. Costa Coffee applied it to their registration funnel and lifted signups by 15%. In both cases the multiplier wasn't a single redesign, it was the rhythm of measure, ship, validate.
14 Product Optimization Patterns
After reviewing hundreds of optimization programs, I keep coming back to the same playbook of tactics. Each of these has produced double-digit lifts for teams inside UXCam, and most of them can be tested within a single sprint.
1. Shorten onboarding to a single activation moment
Most onboarding flows try to teach too much. The winners reduce the first session to one clear action, the "aha moment" Amplitude's North Star research describes, and defer everything else. Cut tutorial screens, delay permission prompts, and measure whether day-1 retention holds steady or improves.
2. Kill or defer non-essential permission prompts
Nothing tanks activation like asking for push, location, and contacts in the first 30 seconds. Apple's HIG guidance on requesting permissions is clear: ask in context, at the moment of value. Moving a push prompt from launch to "after first task completed" typically lifts opt-in rates 30-50%.
3. Fix rage-tap hotspots before anything else
Rage taps are users telling you something looks interactive but isn't. Pull the top five rage-tap targets from UXCam's issue analytics and either make them tappable or change the affordance so they stop looking clickable. This is usually a one-sprint fix with outsized retention impact.
4. Eliminate UI freezes over 2 seconds
The Core Web Vitals threshold for interaction-to-next-paint is 200ms on the web, and mobile expectations are similar. Anything that hangs the main thread for more than 2 seconds is a churn risk. Instrument with Firebase Performance Monitoring or UXCam's freeze detection and fix the top offenders first.
5. Tighten the signup form to the minimum viable field set
Every extra field costs you conversion. Baymard Institute's checkout research found the average checkout has 11.8 form fields when 6-8 would do. Apply the same logic to signup. If you don't need the phone number until checkout, don't ask for it at registration.
6. Replace empty states with guided first actions
Empty states are where new users churn silently. Instead of showing "no items yet," show a pre-populated example, a 15-second video, or a single CTA to create the first item. Slack's onboarding empty states are the canonical example worth studying.
7. Use progressive disclosure on complex screens
If a screen has 12 settings, most users will bounce. Show the three most-used options and tuck the rest under an "Advanced" toggle. NN/g's progressive disclosure pattern documents why this works across mobile and web.
8. Add inline validation to every form
Users who get an error only on submit abandon at 2-3x the rate of users who get inline feedback. Validate email format, password strength, and required fields as the user types. Pair this with clear microcopy so the error message actually tells them how to fix it.
9. Instrument silent failures, not just explicit errors
The scariest bugs are the ones users encounter without seeing an error screen: a button that does nothing, a search that returns empty, a payment that hangs. These show up in session replay but not in crash logs. Build a weekly ritual of reviewing "confused user" replays flagged by Tara AI.
10. Reduce cognitive load on checkout to one decision per screen
Stripe, Shopify, and Amazon all converged on the same pattern: one decision per checkout step. Address, then shipping, then payment, then confirm. Shopify's checkout research shows single-page checkouts can work for simple carts, but multi-step consistently beats for complex ones.
11. Surface social proof at the point of friction
Ratings, review counts, and "X people viewed this today" counters raise conversion on product pages. The trick is placement, right next to the CTA, not buried in a tab. Nielsen's social proof research documents which formats work.
12. Personalize the home screen based on the last session
The first screen a returning user sees should reflect what they did last time. If they abandoned a cart, surface it. If they completed a task, show the logical next one. Segment's personalization patterns give concrete examples of how to instrument this without a full CDP.
13. Cut animations on low-end devices
Fancy transitions look great on a Pixel 8 and terrible on a 3-year-old Android. Detect device tier and disable non-essential animations for the bottom quartile. This is especially important for global apps where StatCounter's device data shows a long tail of older hardware.
14. Add an escape hatch to every critical flow
Every funnel should have a visible back button and a "save for later" option. Users who feel trapped bounce; users who feel in control complete. This single change lifted completion rates 8% in a fintech onboarding flow I reviewed last year.
15. Audit your error messages for clarity and recovery
Generic "Something went wrong" messages are a silent churn engine. Every error should name what failed, why, and what the user can do next. Microsoft's error message guidelines are a good reference for the pattern. I've seen teams cut support ticket volume 20% just by rewriting their top ten error strings.
Industry-specific optimization considerations
Optimization looks different depending on the vertical you ship in. The metrics that matter, the regulatory guardrails, and the behavioral patterns all shift. Here's what I see across the industries we work with most.
Fintech and banking
Trust is the primary conversion lever. Users abandon fintech flows at the first sign of friction because the stakes feel high. Focus optimization on identity verification flows (where Jumio's research shows 30%+ drop-off is common), transaction confirmations, and error messaging on failed payments. Compliance with PSD2 SCA and similar frameworks means you cannot cut certain steps, so optimize the steps you do have with ruthless clarity.
E-commerce and retail
Checkout is the obvious battleground, but the bigger wins are usually upstream: search relevance, product detail pages, and cart recovery. Baymard's cart abandonment data puts the industry average at 70%, which means a 5-point reduction is a massive revenue lift. Pair UXCam's funnel analytics with on-site search analytics to find the zero-result queries that represent unmet demand.
SaaS and B2B tools
The metric that matters most is activation, the percentage of new accounts that reach their value moment within the first session or week. Optimize onboarding checklists, sample data, and the first workspace experience. OpenView's PLG benchmarks show top-quartile SaaS products activate 40%+ of new signups; median is closer to 20%.
Healthcare and telemedicine
Regulatory constraints (HIPAA in the US, GDPR in the EU) restrict what you can capture in session replay, but UXCam's data privacy controls support selective masking so you can still see behavior without exposing PHI. Optimization focus tends to be on appointment booking flows, prescription renewal, and accessibility. Older user cohorts especially benefit from the Recora-style interaction fixes.
Travel and hospitality
Price anxiety drives behavior. Users open five tabs and compare before committing. Optimize for speed of search results, clarity of total price (no surprise fees at checkout), and for mobile apps and the web booking flows. Skift's research on mobile conversion in travel shows the gap between mobile and desktop conversion is still 2x in some segments, mostly because of form friction.
Media and subscription content
Optimize the paywall moment and the first seven days of subscription. Piano's subscription benchmarks show most churn happens in the first 30 days, often because users never found the content that matched their original intent. Use UXCam funnels to trace signup intent through to content consumption and surface recommendations that close the loop.
The product optimization toolkit by category
You don't need every tool, but you do need coverage across the three layers. Here's the shortlist I recommend to teams setting up a stack from scratch.
Behavioral analytics and session replay. UXCam for mobile and web with Tara AI analysis. Alternatives include Hotjar for web-only session replay and FullStory for enterprise web.
Product analytics and event tracking. Amplitude, Mixpanel, and PostHog cover most use cases. UXCam's funnels and retention analytics eliminate the need for a second tool in many cases.
A/B testing and experimentation. Statsig, LaunchDarkly, Optimizely, and GrowthBook are the ones I see most often. See our A/B testing tools guide for a deeper comparison.
Voice-of-customer and surveys. Typeform, Survicate, and Sprig for in-app surveys. AppFollow for mobile review monitoring.
Crash and performance monitoring. Firebase Crashlytics, Sentry, and Datadog RUM cover performance telemetry that complements session replay.
Customer feedback and support data. Zendesk and Intercom ticket trends are an underused signal. Pipe them into the same dashboard as your analytics and you'll spot friction weeks before it shows up in funnel data.
10 common mistakes that kill optimization programs
I've seen smart teams derail their optimization work in predictable ways. Watch for these.
Optimizing before instrumenting. Shipping changes without a baseline means you cannot prove impact. Install session replay and event tracking before you touch code.
Chasing vanity metrics. Daily active users and total sessions look good on a slide but don't tell you whether users are getting value. Tie every optimization to activation, retention, or revenue.
Bundling unrelated changes in one release. If three things ship together and the metric moves, you cannot attribute the lift. Isolate variables.
Ignoring guardrail metrics. Lifting conversion while tanking 30-day retention is a loss, not a win. Always pair a target metric with a guardrail.
Running tests without enough traffic. Calling a winner at 200 users is how teams ship false positives. Use a sample size calculator before you start.
Treating optimization as a designer or PM solo sport. Engineering, data, and support all have signal. The best optimization meetings include all four roles.
Only watching the happy path. The users who complete the funnel are not the ones you need to learn from. Watch replays of the users who failed.
Over-relying on surveys. Users tell you what they think they'd do, not what they actually do. Behavioral data always beats stated preference.
Skipping segmentation. A 2% overall lift can hide a 20% lift for one cohort and a 15% drop for another. Always segment results by device, OS, tenure, and plan.
No institutional memory. Teams that don't document hypotheses and outcomes re-run the same tests every 18 months. Keep a running log of every optimization, what you expected, and what actually happened.
How we evaluated product optimization approaches
For this guide, I stack-ranked the techniques teams actually use based on four weighted criteria, drawn from reviewing optimization programs across UXCam's customer base:
Evidence quality (35%), how directly the method ties a change to observed user behavior rather than opinion.
Speed to insight (25%), how quickly a team can go from question to actionable finding.
Implementation cost (20%), the engineering and analyst hours required to run the loop once.
Measurable outcome (20%), whether the technique produces a number you can take to a leadership review.
Session replay, heatmaps, and issue analytics scored highest on evidence quality and speed to insight, which is why the five-step process above is built around them. Pure A/B testing scores well on measurable outcome but poorly on speed, you need traffic volume and time to reach significance. User interviews score well on evidence quality but poorly on speed. The strongest optimization programs blend all three.
90-Day Optimization Maturity Roadmap
Most teams I work with want a concrete plan, not a philosophy. Here's the 90-day rollout I recommend for a team starting from scratch or relaunching a stalled program.
Days 1-30: Instrument and baseline
Install UXCam or your chosen behavioral analytics platform across mobile and web. Turn on session replay, autocapture, and issue analytics. Define and instrument your North Star metric, activation event, and top three conversion funnels. At the end of the month you should have 30 days of baseline data and a ranked list of friction points from Tara AI or manual review.
Days 31-60: Ship the first five optimizations
Run the top five friction points through Impact vs. Effort prioritization. Write SMART objectives with baselines and guardrails. Ship each change behind a flag where possible and measure against the baseline. Hold a weekly 30-minute optimization review where product, design, engineering, and support walk through the latest replays and metrics together. By day 60 you should have at least two validated wins and two or three rolled-back experiments feeding the next hypothesis cycle.
Days 61-90: Build the operating rhythm
Convert the weekly review into a standing ritual. Add a monthly executive readout that shows optimization wins in dollar or retention terms. Expand instrumentation to secondary flows (settings, notifications, support handoffs) and start cohort-level optimization for power users, new users, and lapsed users separately. By day 90, optimization should feel like how your team works, not a special initiative. This is the maturity inflection point where the compounding gains start showing up in the business metrics that matter to the board.
Beyond 90 days: Scale with AI and automation
Once the rhythm is in place, bring Tara AI deeper into the workflow: automatic cohort detection, anomaly alerts on key funnels, and recommended fixes piped straight into your Jira backlog. Teams that reach this stage are shipping 2-3x the optimizations per quarter with the same headcount, which is the operational payoff of treating optimization as a system rather than a series of projects.
Why UXCam for Product Optimization


UXCam is a product intelligence and product analytics platform built for mobile apps and the web and now fully web-ready, installed in 37,000+ products worldwide with a 4.7-star rating on G2. A few reasons it's a natural fit for optimization work:
Session replay with auto-captured user flows. See exactly what users did before they churned, rage-tapped, or abandoned.
Heatmaps for taps, gestures, and scrolls. Spot dead zones and misdirected attention without instrumenting every element by hand.
Issue analytics. Rage taps, UI freezes, and crashes are surfaced automatically, so performance regressions don't hide inside aggregate metrics.
Funnels and retention analytics. Track conversion and cohort health in the same workspace as the qualitative evidence.
Tara AI. The AI analyst that watches sessions for you, clusters issues, and recommends what to fix next.
Autocapture. Start collecting data without shipping a tagging plan, which means your first insights land within hours of install.
Deep segmentation. Slice by device, OS version, cohort, or custom property to understand whether an issue is universal or localized.
If you're evaluating tools, I'd also recommend reading our guide to the best behavioral analytics tools and the best session replay tools for a broader comparison.
Frequently asked questions
What is product optimization in simple terms?
Product optimization is the ongoing process of using data and user feedback to make a live product better, faster, easier to use, and more valuable to the people using it. It's not a one-time redesign; it's a continuous loop of measuring behavior, identifying friction, shipping targeted improvements, and validating whether those improvements actually moved a meaningful metric. Most mature product teams run this loop weekly or bi-weekly as part of their standard sprint rhythm, not as a special initiative.
How is product optimization different from product management?
Product management is the broader discipline of deciding what to build, why it matters, and when to ship it. Product optimization is a specific practice within product management focused on improving products that already exist in the market. A product manager might spend half their time on roadmap strategy, stakeholder alignment, and new feature scoping, while the other half goes to optimization work: analyzing behavior, prioritizing fixes, and validating changes. Optimization tends to be more data-driven and tactical; strategy tends to be more directional.
What tools do I need to start optimizing my product?
At minimum you need three things: a product analytics layer for events and funnels, a behavioral analytics layer for session replay and heatmaps, and a feedback channel for qualitative input from real users. UXCam covers the first two in one platform and layers Tara AI on top to accelerate analysis. For feedback, most teams pair it with in-app surveys or review-monitoring tools. You don't need a huge stack to start, you need enough instrumentation to answer "what happened, why, and how did users feel about it."
How long does product optimization take to show results?
For performance optimizations (fixing crashes, reducing UI freezes, cutting load times), teams often see measurable improvements within one or two release cycles. Conversion and retention optimizations take longer because you need enough traffic to reach statistical significance, typically two to six weeks depending on volume. The bigger truth is that optimization compounds. A single 5% lift in a critical funnel is fine; ten 5% lifts across a year transform the business. Teams that commit to the rhythm see real results within a quarter and category-leading results within a year.
What metrics should I track to measure optimization success?
It depends on your product, but most teams should watch a core set: activation rate (% of new users who hit the "aha moment"), feature adoption rate, funnel conversion rates at each step, session length and depth, retention at day 1/7/30, rage tap and UI freeze frequency, crash-free session rate, and task success rate for critical flows. Pair every optimization with a specific target metric and at least one guardrail metric so you can catch unintended side effects early.
How does AI change product optimization in 2025?
AI changes the economics of analysis. Historically, the bottleneck in optimization was humans watching replays, reading tickets, and manually clustering issues, all of which took days or weeks. AI analysts like Tara inside UXCam now review thousands of sessions in minutes, cluster recurring friction, and surface specific recommendations with the supporting evidence attached. That doesn't remove the product manager from the loop; it lets them spend their time on judgment calls and prioritization instead of spreadsheet work. Teams that pair AI analysis with disciplined hypothesis testing are shipping 2-3x more optimizations per sprint than teams relying on manual review alone.
How often should we run optimization cycles?
The best teams I work with ship optimizations on a weekly or bi-weekly cadence, not quarterly. A weekly rhythm keeps the team in the loop of real user behavior and prevents hypothesis backlogs from piling up. If you're smaller or traffic-constrained, a bi-weekly cycle works fine, but longer than that and the insights go stale before you act on them.
Should I optimize or ship new features first?
It depends on the maturity of the feature. A feature with less than 20% adoption is usually an optimization problem, not a net-new-feature problem. Before building something new, run the existing feature through the five-step process. If adoption is already strong and usage is deep, new features compound the asset. If it isn't, new features just add surface area for friction.
How do I build a business case for an optimization program?
Tie it to revenue or retention, not clicks. Take a funnel with known drop-off, estimate the revenue impact of a 5-point lift, and compare that to the cost of instrumentation and three sprints of optimization work. Most teams find the payback period is under 90 days once they run the math. Case studies like Costa Coffee's 15% registration lift and Housing.com's feature adoption doubling give you external benchmarks to anchor against.
How is product optimization different from conversion rate optimization (CRO)?
CRO is a subset of product optimization focused specifically on moving users through funnels toward a conversion event. Product optimization is broader: it includes CRO but also performance, usability, feature adoption, and retention. CRO lives mostly on marketing and growth teams; product optimization lives across product, design, and engineering. The tooling overlaps, but the scope of product optimization is wider.
Can small teams without a dedicated data analyst do this?
Yes, and in some ways they have an advantage because they don't have analyst debt to unwind. Start with autocapture in UXCam so you don't need a tagging plan. Use Tara AI to cluster friction instead of hand-slicing replays. Run a weekly 30-minute review as a team and let the tooling surface what matters. The teams that struggle are not the small ones, they're the ones who try to build a perfect event taxonomy before shipping anything.
What's the relationship between product optimization and experimentation?
Experimentation (A/B testing) is one validation mechanism within the optimization loop. Not every optimization needs a controlled experiment. Performance fixes and bug eliminations can usually ship straight to production because the expected direction is unambiguous. Conversion and UX changes benefit most from A/B testing because the effect size matters and direction isn't always obvious. A mature program uses both, experiments for the changes where direction is uncertain, and direct rollouts with pre/post measurement for everything else.
How do I keep stakeholders aligned on optimization priorities?
Build a single shared dashboard that tracks the handful of metrics leadership cares about, and review it in a monthly readout. When optimization work is visible against those numbers, prioritization conversations get easier because everyone is arguing over the same data. UXCam's dashboards are designed for this, and most teams I work with run a weekly internal review and a monthly exec-facing one off the same underlying widgets.
What if our product is pre-launch or very early stage?
Optimization work applies the moment you have real users, even 100 is enough to see patterns. For pre-launch, the equivalent work is user research, prototype testing, and landing-page optimization. The minute you ship, install behavioral analytics on day one so you have baseline data from your first cohort. The teams that install UXCam at launch, not six months in, have a massive advantage because they get a clean behavioral record from the first user onward.
How do I prioritize optimization work across mobile and web?
Start with whichever surface drives the majority of revenue or active users, then mirror the instrumentation on the other. Because UXCam covers both mobile and web in one platform, you can compare friction signals across surfaces directly. In my experience the same friction patterns (rage taps, abandoned funnels, slow screens) show up on both, but the fixes differ, mobile wins more from reducing permission prompts and tap target sizing, while web wins more from form optimization and page speed. Treat them as equal citizens in the optimization backlog, not one primary and one secondary.
AUTHOR
Silvanus Alt, PhD
Founder & CEO | UXCam
Silvanus Alt, PhD, is the Co-Founder & CEO of UXCam and a expert in AI-powered product intelligence. Trained at the Max Planck Institute for the Physics of Complex Systems, he built Tara, the AI Product Analyst that not only analyzes user behavior but recommends clear next steps for better products.


TABLE OF CONTENTS
- Key takeaways
- What is product optimization?
- Why product optimization matters
- The 5-step product optimization process
- 14 Product Optimization Patterns
- Industry-specific optimization considerations
- The product optimization toolkit by category
- 10 common mistakes that kill optimization programs
- How we evaluated product optimization approaches
- 90-Day Optimization Maturity Roadmap
- Why UXCam for Product Optimization


Related articles


Product best practices
12 Apps with Great User Onboarding (2026 Examples)
The 12 mobile app onboarding flows I'd study if I were designing one today, with specific callouts for what each does well, common mistakes, and the...
Silvanus Alt, PhD
Founder & CEO | UXCam


Product best practices
Why creating a data-driven culture has less to do with data than you think
Kishan Gupta, CEO, shares 5 tips and techniques for fostering a data-driven culture based on his own experiences building and leading...


Kishan Gupta
Co-Founder of UXCam


Product best practices
Finance apps have a customer support problem, here's how to fix it
Learn about the customer support problem in finance apps and practical solutions to fix it in our latest blog post, and improve user satisfaction and...


Jane Leung
Product Analytics Expert