What Is a Product Positioning Map? (+ How To Create One)


In a highly competitive mobile app industry, a product positioning map is ideal for helping product teams see the forest for the trees. It gives you a snapshot of your position in the market and enables you to discover unique ways to outsmart your competitors by taking advantage of the gaps.
There are various types of product positioning maps, but feature or benefit-based maps are data-backed and effectively highlight value propositions. They offer great benefits, especially for product-led mobile app teams.
In this guide, UXCam will discuss what product positioning maps are and the best way to develop your own for maximum benefit.
Let’s get started.
What is a product positioning map?
A product positioning map visually represents how your product compares to competitors based on specific features or customer perceptions. Similar products are plotted on a two-dimensional graph with horizontal and vertical axes representing attributes like price, features, and quality.
These maps are tools for identifying gaps and opportunities, since they help you visualize both of these in one comprehensive view.
Types of product positioning maps
There are two types of product positioning maps:
Perceptual Positioning Maps: Qualitative in nature, perceptual maps plot perceptions or customer impressions of a product's attributes.
Attribute Positioning Maps: These are quantitative in nature and compare specific attributes (e.g., features) across competitors.
One example of a product positioning map you may have seen before is G2’s Grid:


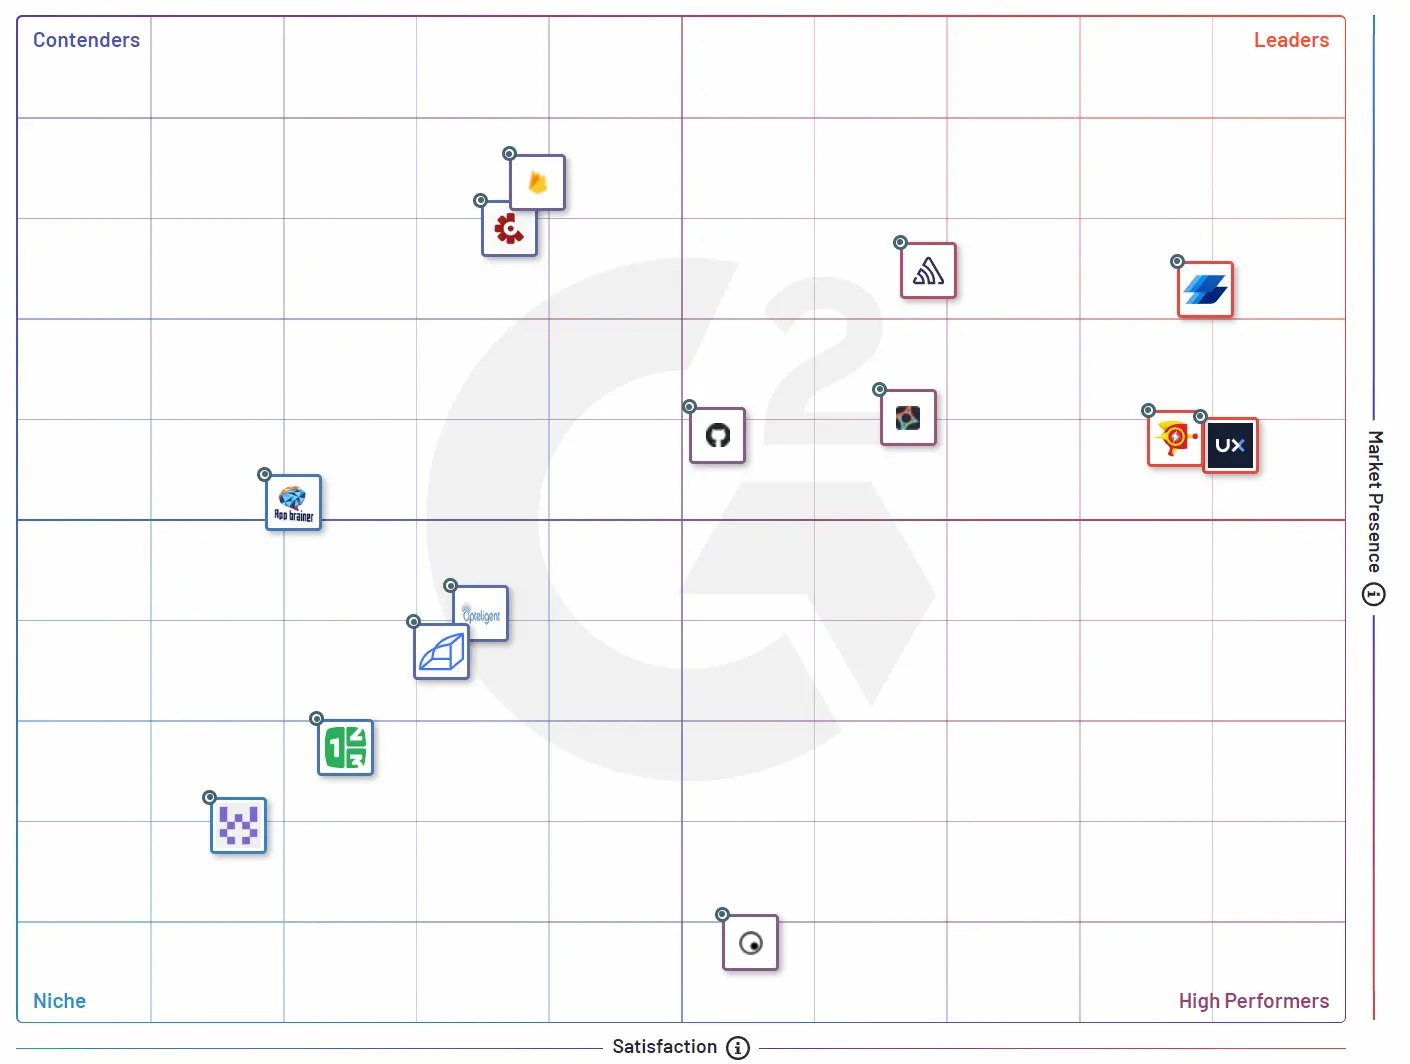
In this map, the Satisfaction axis is determined by a product’s G2 reviews and the Market Presence axis is determined by 15+ data points ranging from website traffic to G2 searches. It helps G2 users get a broad view of the software landscape to easily compare tools.
In the mobile crash reporting category, UXCam is in the Leaders quadrant due to high user satisfaction and higher-than-average market presence.
Why are product positioning maps important?
Product positioning mapping is a strategic approach to support your market position goals. At a glance, you can see where your competitors are in relation to where you’d like to be positioned in the market and what you need to do to get there.
Other reasons include:
Understanding the market: When you can see exactly where you stand in relation to other tools, it's much easier to plot a course to where you want to be. Everything becomes easier—figuring out product areas to focus on, targeting customers, marketing, and more.
Identifies potential risks: Product positioning maps help to identify potential risks that you may encounter when launching a new product or making strategic decisions.
Learn what’s important: Perceptual product positioning shows you what consumers find most important about products like yours.
Foundation of Value Proposition Statement: It lays the groundwork for summarizing why customers should choose your product over competitors.
Supports communication and decision-making: This visual representation of market positioning and basic market insights is easier to understand by different stakeholders.
How to create a product positioning map
Step 1 - Outline your goals and axes
What are you hoping to get out of your product positioning map?
This is an important question to start with—the goal or objective of the map will determine how you go about creating it, what your axes are, and how you frame your thinking about the competitive landscape.
If you don’t have a goal in mind yet, here are some examples:
To determine whether your product is priced competitively.
To see if there are any gaps in the market for your product.
To fine tune your target market segment.
Once you have a goal, start to think about what axes you’ll need to use to map out the competitive landscape.
For example, if your goal is to see whether your tool is prices competitively, you could use the axes Price and Value—a composite metric that could include customer satisfaction, feature breadth, etc.
Step 2 - Identify your competitors
Next, it’s time to decide which competitors you’ll be adding to the map. You’ll want to be certain you include direct competitors, as well as any potential disruptors (up-and-comers with the potential to become direct competitors).
It can also be useful to include indirect competitors—products or services that have the same end goal but use a different solution—so you can understand how customers might view your product in comparison.
For more depth and valuable insight, come up with 7–10 brands to plot with your product. And if resources permit, in finalizing your list, you could ask customers to name alternative brands during a focus group, for example.
Step 3 - Collect data
Collecting data will be the most time-consuming part of this process. It’s also the most important, though—take your time!
Collecting data on competitors will be difficult since they're unlikely to hand over their internal documents. But luckily, there are tons of ways to get access to information on competitor products and services, like:
Reading reviews on sites like G2, GetApp, Google Play, App Store, etc.
Surveying their customers.
Monitoring web traffic with tools like SimilarWeb.
Reading press releases and industry reports.
Setting up alerts for news related to your competitors.
Collecting information on pricing, features, and other details from their websites.
Collecting data on your product will be easier—especially with an analytics tool that’s up to the task.


For example, UXCam allows mobile product teams to automatically track every in-app interaction. Features like session replays, heatmaps, and user journey maps allow teams to spot and fix issues quickly. Plus, UXCam integrates with over a dozen of the most popular analytics solutions on the market to centralize your data.
If your map will be more benefit-based, you can ask your customers for feedback on the tangible or intangible benefits they receive using your platform.
Step 4 - Analyze data
Now, look at how your competitors perform on the chosen attributes.
To do this, you’ll need to come up with a scoring system for each axis. If an axis is a single metric (e.g., App Store rating), this is a simple process—just assign a score based on the value that metric has.
However, if an axis is made of different features (e.g., user onboarding), you’ll need to come up with a weight system or some other scoring system to accurately assess how well each competitor performs in this area.
Weighted scoring example
Let’s say we have a market presence axis made up of two weighted data points—web traffic (70%) and number of web mentions (30%).
For each tool, we score each of these variables from 1 to 10 (or whatever scale you choose):
Web traffic: 8
Web mentions: 4
To get a score for market presence, we need to multiply the score of each variable by its corresponding weight and sum them up:
8 × 0.7 + 4 × 0.3 = 6.8
The market presence score for this competitor is 6.8 out of 10.
Step 5 - Draw your product position map
Create four quadrants by drawing a vertical line for the Y-axis across your page and a horizontal line for the X-axis. Label your two axes and come up with names for each quadrant to help you stay organized.
In our G2 Grid® example earlier, the quadrants of the Satisfaction – Market Presence matrix were Niche, Contenders, Leaders, and High Performers. These labels give you a quick way to identify the position of each competitor.
Then, chart each competitor in its corresponding quadrant.
Step 6 - Interpret brand positioning
Your map should offer an easy-to-understand picture of your product's competitive marketplace. You should be able to observe the distribution of products, clusters, outliers, and market gaps. The results should help you evaluate your competitive advantage, new opportunities, and areas for advancement.
If you’re working on a perceptual position map, it could be that the attributes you chose don’t result in a worthwhile positioning gap or niche. In that scenario, you can change one or both attributes. Remember to use attributes your customers care about more for the most valuable result.
Step 7 - Monitor and update
Consider updating your positioning map regularly to keep up with changes in consumer preferences, market trends, and your product’s performance. Changes in consumer behavior may alter the details on your map. Additionally, you’ll need to add new competitors to ensure the map is valuable in helping your product stand out.
Use UXCam to support your position mapping research
A product positioning map is a strategic document to drive businesses forward. By keeping it updated with new brands and position changes, you’ll gain valuable insight into the success of your growth strategies while analyzing your competitors.
UXCam’s accurate data intelligence for mobile apps is trusted by over 37,000 leading brands. We deliver the feature engagement stats you need to back position mapping. Find out how your customers feel about current and new features and redesigns. And use our precise product and behavior analytics to keep updated with customer preference shifts and more.
Request a free demo today to see how else we support mobile app teams, or get started with a free trial.
You might also be interested in these;
How to analyze session recordings
Product adoption strategy - How to increase adoption rates
Product adoption dashboard - How to track adoption metrics
AUTHOR
Tope Longe
Product Analytics Expert
Ardent technophile exploring the world of mobile app product management at UXCam.


Related articles


Product best practices
12 Apps with Great User Onboarding (2026 Examples)
The 12 mobile app onboarding flows I'd study if I were designing one today, with specific callouts for what each does well, common mistakes, and the...


Silvanus Alt, PhD
Founder & CEO | UXCam


Product best practices
Why creating a data-driven culture has less to do with data than you think
Kishan Gupta, CEO, shares 5 tips and techniques for fostering a data-driven culture based on his own experiences building and leading...


Kishan Gupta
Co-Founder of UXCam


Product best practices
Finance apps have a customer support problem, here's how to fix it
Learn about the customer support problem in finance apps and practical solutions to fix it in our latest blog post, and improve user satisfaction and...


Jane Leung
Product Analytics Expert