Back to blog
9 MIN READ
Top 11 SaaS Analytics Tools and Software 2025
PUBLISHED
4 December, 2024

Product Analytics Expert
Feeling overwhelmed by the countless SaaS analytics tools out there? You're not alone. Choosing the right tool is crucial for scaling your business effectively.
In this article, we'll explore the top SaaS analytics tools poised to make a significant impact in 2025.
We'll explore each tool's unique features and benefits, helping you make informed, data-driven decisions.
From user behavior tracking to revenue analysis, we'll cover the essentials that can propel your business forward.
Let's dive in and find the perfect analytics solution tailored to your needs.
Summary - Top SaaS analytics tools
Certainly! Here's the updated summary table with the tools in your specified order:
| Tool | Ideal For/Segment |
|---|---|
| Mixpanel | Product & User Behavior Analytics |
| UXCam | Mobile App User Experience Analytics |
| ChartMogul | Subscription and Revenue Analytics |
| Google Analytics 4 | Web & Multi-Platform Analytics |
| Gainsight | Customer Success Analytics |
| Heap Analytics | Automatic User Behavior Tracking |
| Twilio Segment | Customer Data Platform (CDP) |
| Databox | Business Performance Monitoring |
| HubSpot | Customer Relationship Management (CRM) & Marketing Analytics |
| Tableau Online | Data Visualization & Business Intelligence |
| Datadog | Infrastructure and Application Performance Monitoring |
Mixpanel
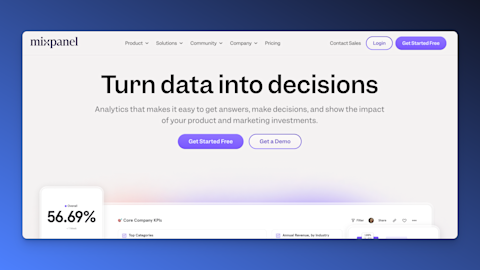

Unique differentiator: Advanced funnel and cohort analysis capabilities for in-depth understanding of user behavior.
Mixpanel is a leading analytics platform focused on tracking user interactions with web and mobile applications. It helps businesses understand how users engage with their products, enabling data-driven decisions to improve user experience and increase retention. Mixpanel offers powerful tools for analyzing user behavior, including advanced funnel and cohort analysis.
Use case
Optimizing product features based on user interaction data.
Identifying and reducing churn by analyzing user cohorts.
Personalizing user experiences to enhance engagement.
Key features
Real-time event tracking
Detailed funnel analysis
Cohort analysis for retention tracking
User segmentation and profiles
A/B testing tools
Customizable dashboards
Data visualization tools
Pros
In-depth user behavior insights
Powerful analysis tools for funnels and cohorts
Real-time data processing
User-friendly interface
Supports both web and mobile analytics
Cons
Pricing can be high for large data volumes
May require technical expertise for advanced features
Limited integrations compared to some competitors
Learning curve for users new to product analytics
UXCam
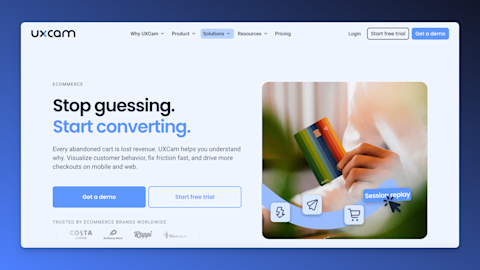

Unique Differentiator: Simplified mobile app analytics complimenting quantitative data with session replays.
UXCam is a mobile app analytics tool that provides in-depth insights into user interactions and experiences. It offers features like session recordings, heatmaps, and user journey analysis to help app developers and designers understand how users interact with their apps, identify usability issues, and improve the overall user experience.
Use case
Identifies usability issues impacting user experience.
Provides insights to optimize app design and functionality.
Enhances user satisfaction and retention rates.
Key features:
Session replay to watch real user interactions
Heatmaps showing touch gestures and navigation patterns
User journey analytics to identify drop-offs and friction points
Crash analytics and performance monitoring
User segmentation
Integration with other analytics and debugging tools
Pros
Provides qualitative insights into user behavior
Helps identify and fix usability issues
Enhances app optimization and user satisfaction
User-friendly interface with visual data
Supports iOS, Android Flutter, React Native, Flutter and .NET MAUI platforms
Cons
Focused primarily on mobile apps, with beta web analytics
Advanced features may require higher-tier plans
ChartMogul
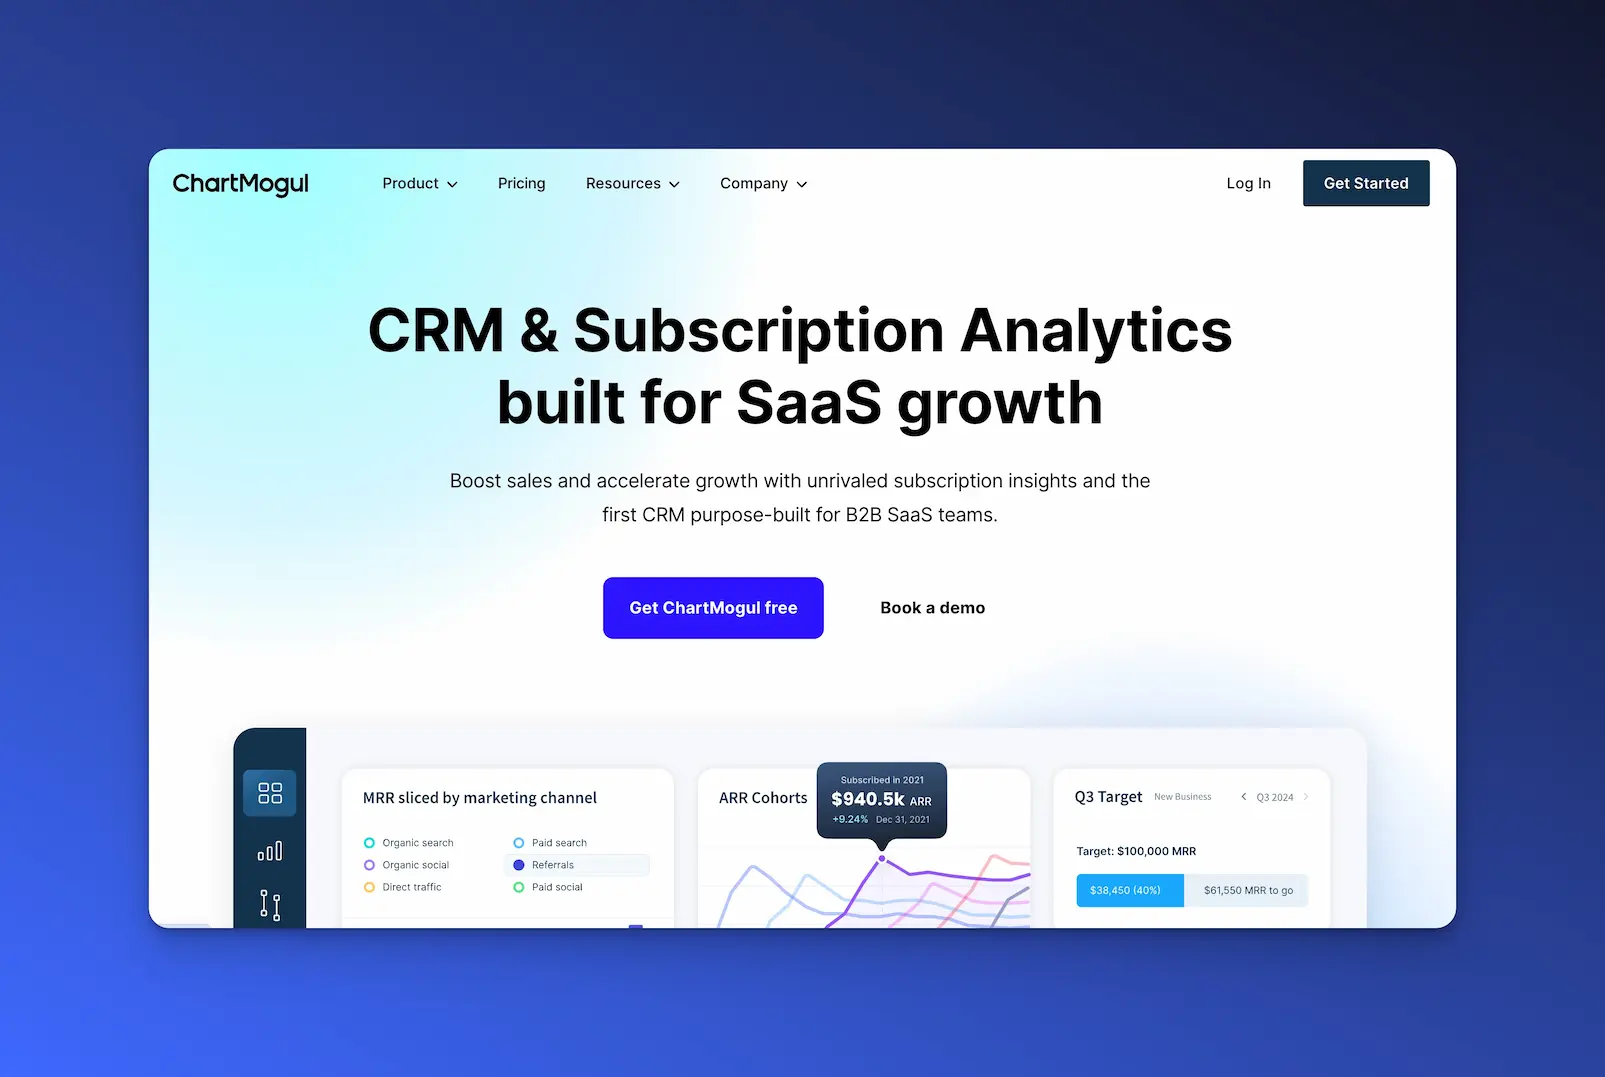
Unique differentiator: Automated revenue recognition and advanced segmentation for detailed subscription analytics.
ChartMogul is a subscription analytics platform designed for SaaS businesses to track and analyze key revenue metrics. It integrates with billing systems to provide real-time insights into MRR, churn, LTV, and other critical financial metrics, helping businesses make informed decisions to drive growth.
Use case
Provides clarity on financial health and growth trends.
Helps identify revenue opportunities and risks.
Simplifies financial reporting and compliance.
Key features
Real-time MRR, ARR, churn rate, and LTV calculations
Revenue recognition compliant with accounting standards
Customer segmentation and cohort analysis
Data enrichment with custom attributes
Integration with multiple billing systems
Reporting and forecasting tools
Pros
Provides clear visibility into financial health
Simplifies revenue reporting and compliance
Helps identify growth opportunities and risks
User-friendly interface with customizable dashboards
Supports multi-currency and international businesses
Cons
Limited to subscription-based business models
May require setup time to integrate with billing systems
Pricing may be high for startups or small businesses
Advanced features may require higher-tier plans
Google Analytics 4 (GA4)
Unique differentiator: Event-based tracking model that unifies web and app analytics for comprehensive cross-platform insights.
Google Analytics 4 (GA4) is Google's latest analytics platform designed to provide insights across websites and apps. It uses an event-based data model to track user interactions more flexibly. GA4 offers a holistic view of the customer journey across different platforms and devices, enabling businesses to enhance user engagement and optimize marketing strategies.
Use case
Provides unified tracking of user interactions across web and app platforms.
Offers predictive insights through machine learning analytics.
Enhances marketing strategies with event-based data analysis.
Key features
Event-based data collection
Cross-platform tracking (web and app)
Enhanced user journey analysis
Machine learning insights and predictive metrics
Privacy-centric design with cookieless tracking capabilities
Integration with Google Ads and other Google services
Pros
Unified view of user interactions across platforms
Advanced analytics with machine learning
Improved tracking of user engagement and retention
Better data controls for privacy compliance
Free to use with robust features
Cons
Steeper learning curve compared to previous versions
Some features from Universal Analytics are missing
Requires reimplementation of tracking for existing users
Limited data retention periods in the free version
Gainsight
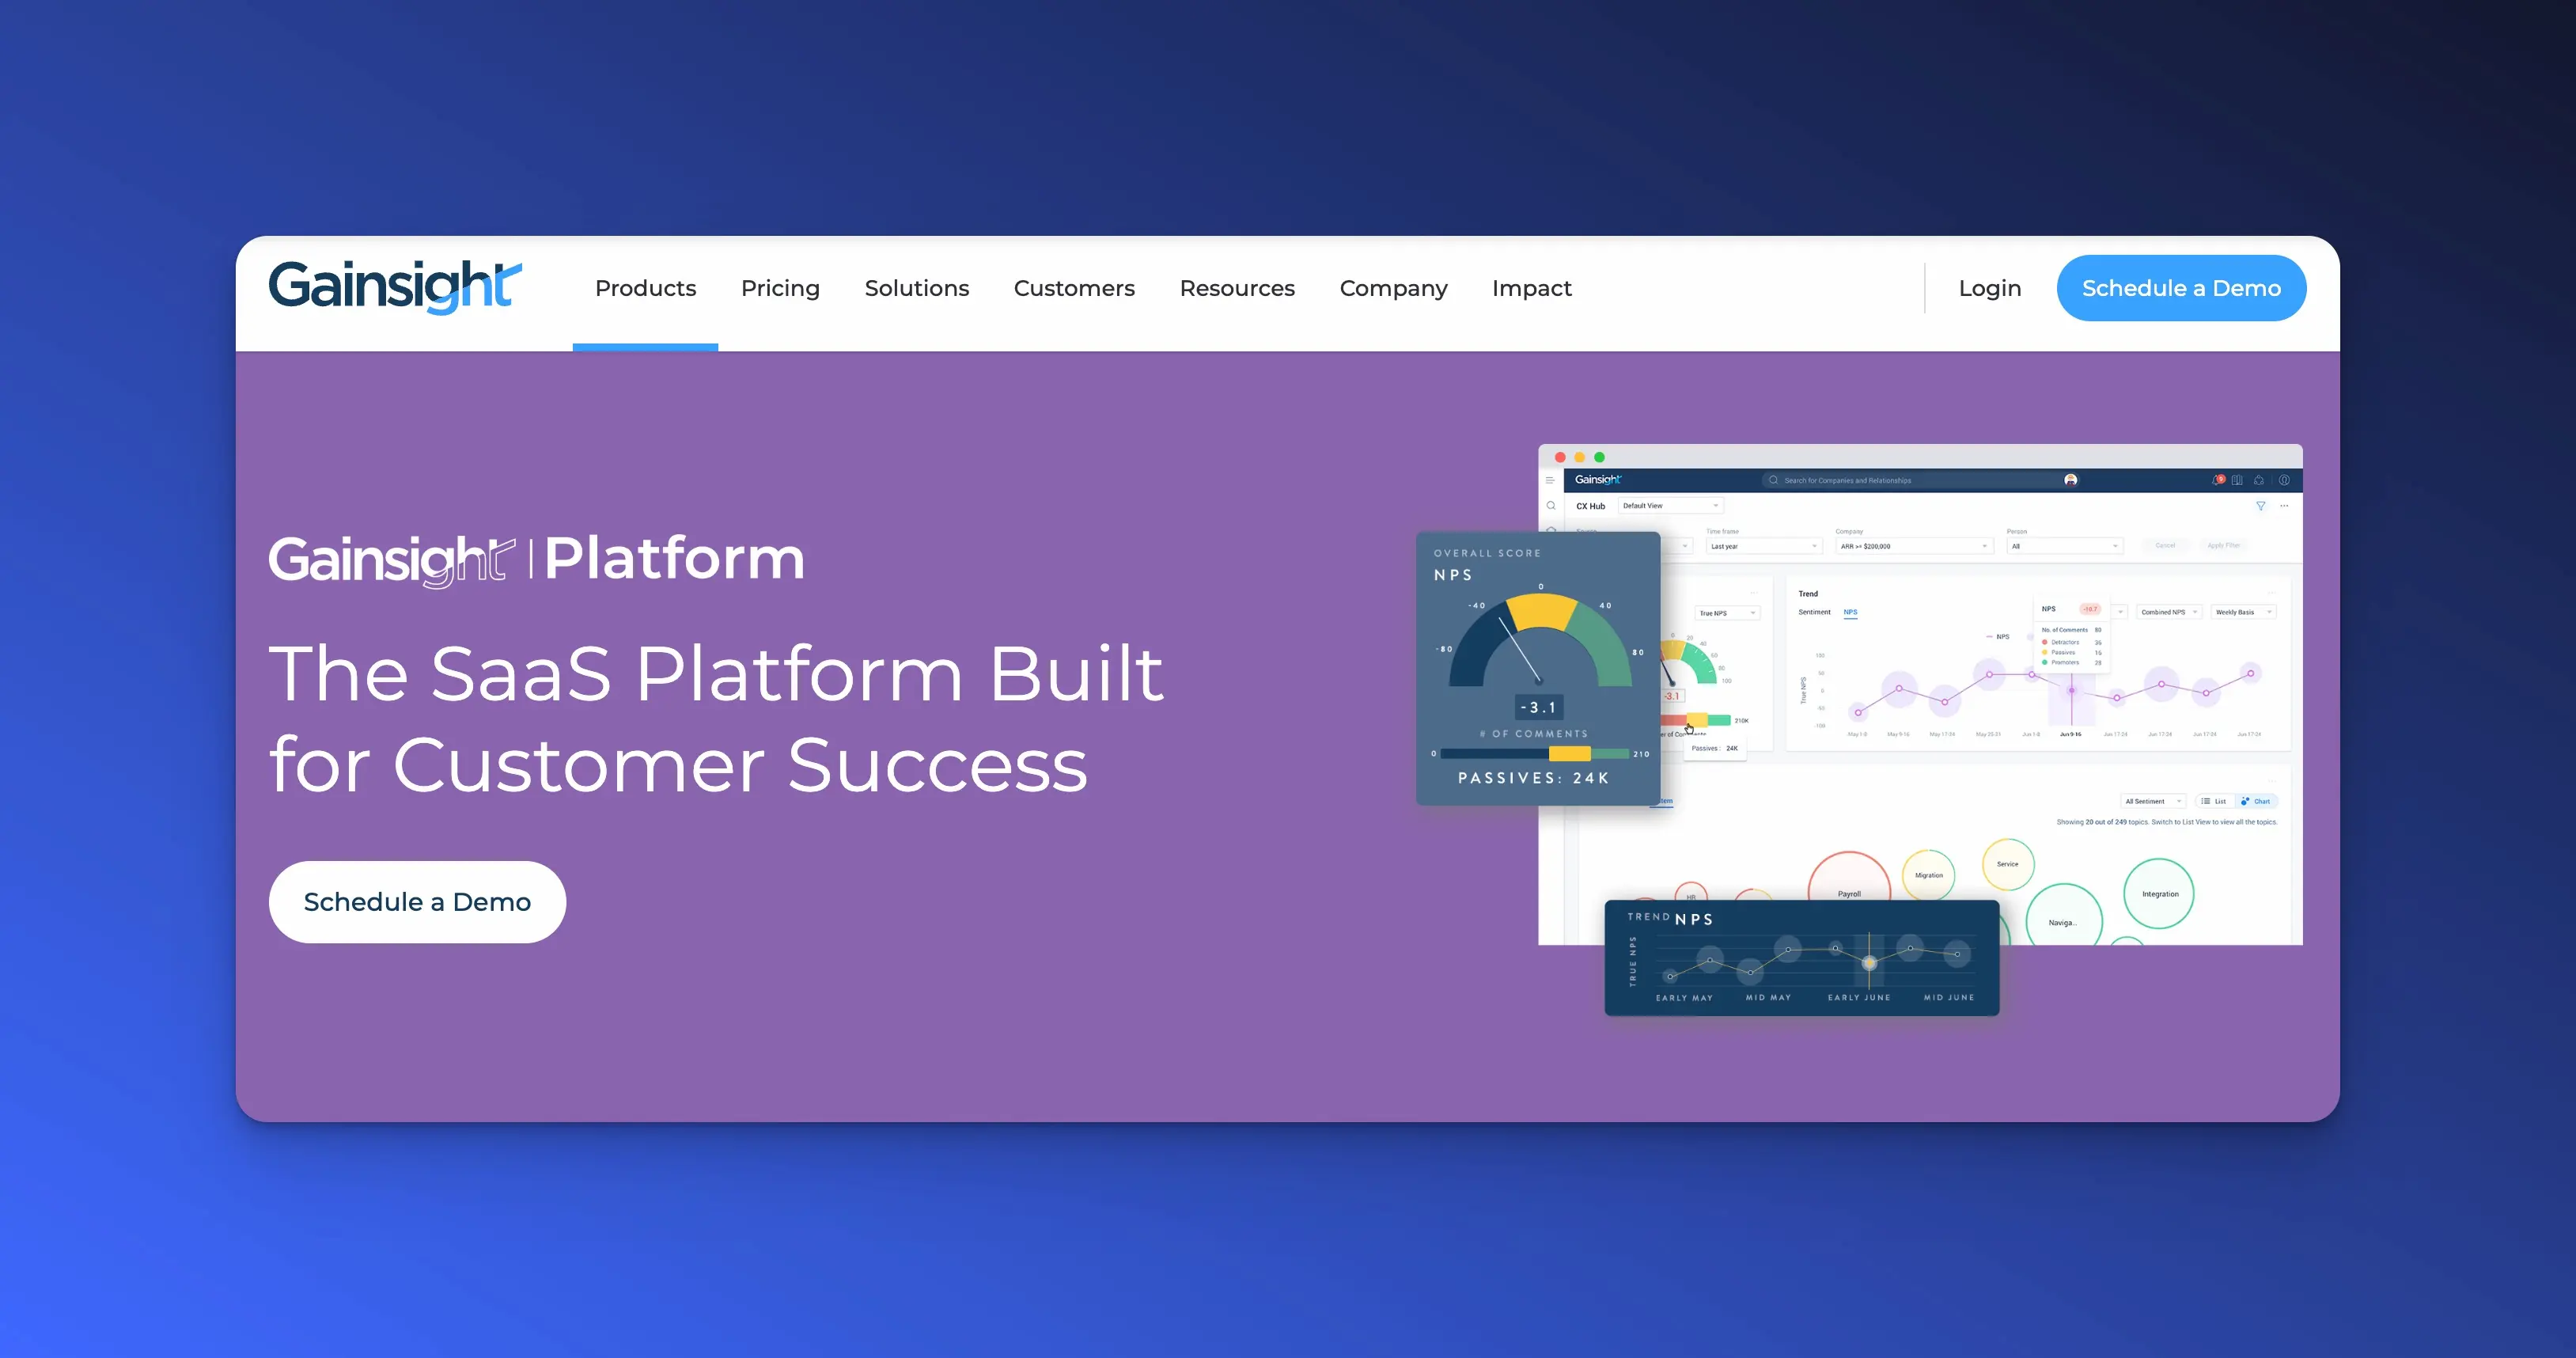
Unique differentiator: Comprehensive customer health scoring and success playbooks for proactive customer management.
Gainsight is a customer success platform designed to help businesses retain customers and drive growth by leveraging data-driven insights. It consolidates customer data from multiple sources to provide a holistic view of customer health, enabling teams to proactively address risks and identify opportunities for expansion.
Use case
Identifies at-risk customers through comprehensive health scoring.
Enhances customer retention with proactive engagement strategies.
Drives growth by uncovering upsell and cross-sell opportunities.
Key features
Customer health scoring based on various metrics
Automated workflows and alerts
Customer journey mapping
Success planning and tracking tools
Surveys and feedback collection
Integration with CRM and other data sources
Pros
Helps reduce churn by identifying at-risk customers
Facilitates proactive customer engagement
Customizable health scores and dashboards
Enhances collaboration across customer-facing teams
Supports scalability for growing businesses
Cons
Can be complex to implement and configure
Higher cost compared to some alternatives
May require training to fully utilize features
Integration setup may require technical support
Heap Analytics

Unique differentiator: No-code event tracking that captures all user interactions automatically.
Heap Analytics automatically captures all user interactions on your website or app without requiring manual event tracking. It provides retroactive analysis of user behavior, allowing businesses to gain insights into user actions and optimize their products and user experiences accordingly.
Use case
Eliminates manual event tracking with automatic data capture.
Enables retroactive analysis of user behaviors.
Accelerates product optimization with comprehensive insights.
Key features
Automatic data capture of clicks, taps, form submissions, etc.
Retroactive analysis without pre-defined events
Funnel analysis and conversion tracking
User segmentation and cohort analysis
Visualization and reporting tools
Integration with other analytics and data platforms
Pros
Eliminates the need for manual event tracking setup
Ensures no data is missed due to tracking oversights
Enables quick analysis of user behavior
User-friendly interface
Saves time for teams without dedicated analytics resources
Cons
Large data volumes can impact performance or cost
May capture irrelevant data requiring filtering
Less control over data collection compared to manual tracking
Advanced analysis may require technical expertise
Twilio Segment
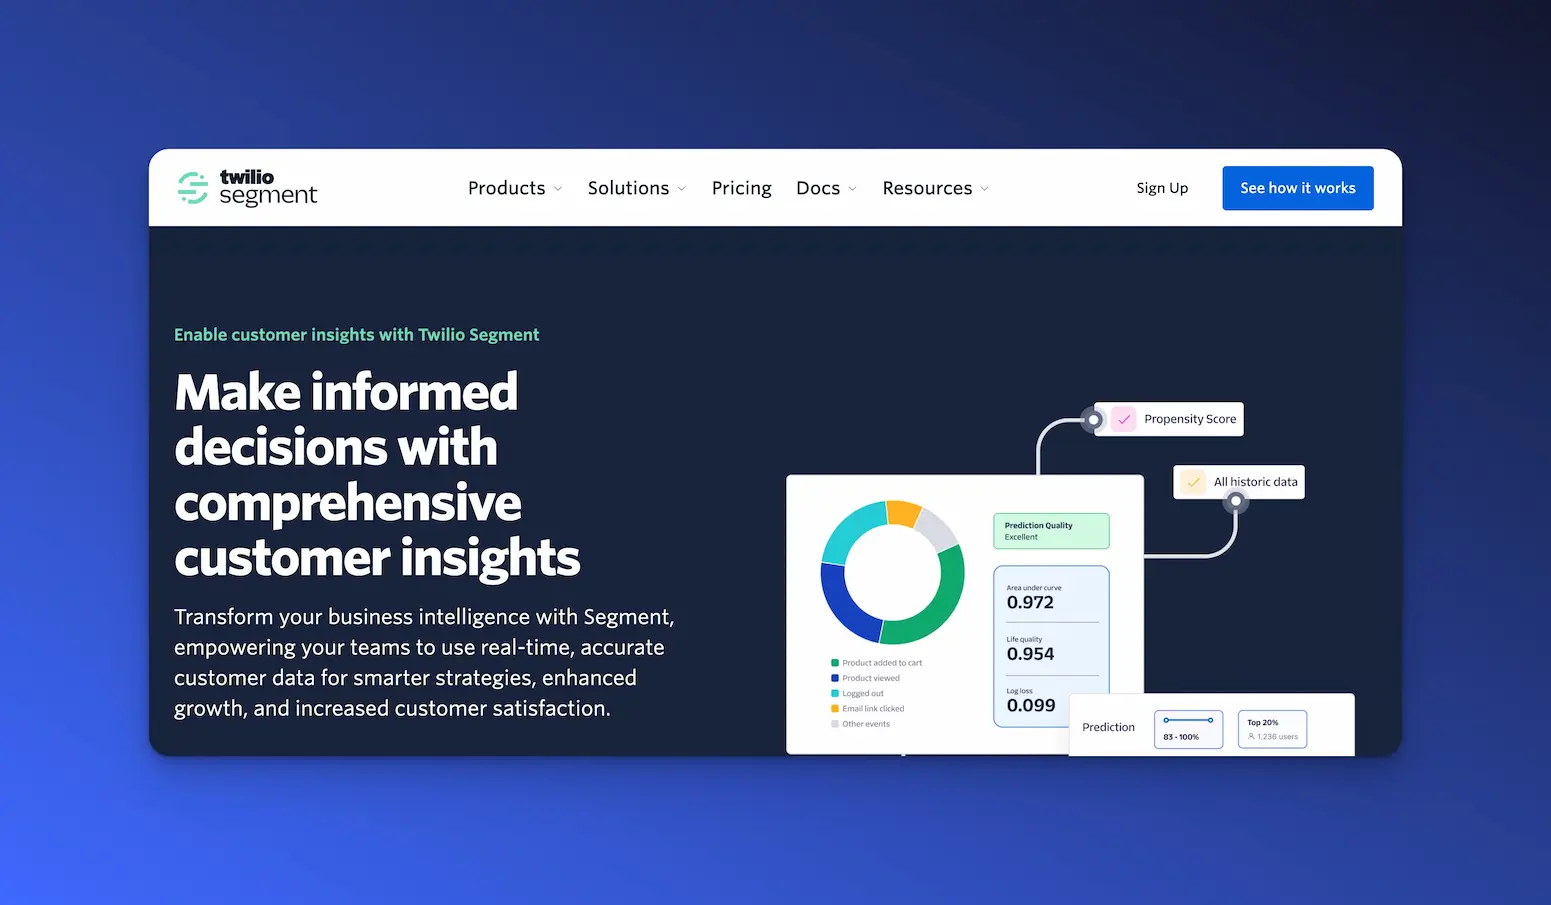
Unique differentiator: Unified customer data collection and routing for seamless integration across platforms.
Segment is a customer data platform that helps businesses collect, clean, and route customer data to various tools and systems. By providing a unified view of customer interactions, Segment ensures consistent data across marketing, analytics, and customer service platforms, enhancing data reliability and enabling better decision-making.
Use case
Eliminates data silos by centralizing customer data.
Enhances data quality and reliability.
Simplifies integration with other tools and platforms.
Key features
Data collection from web, mobile, and server sources
Data transformation and enrichment
Data routing to hundreds of integrated tools
Real-time data streaming
Privacy controls and compliance support
Audience segmentation and personalization
Pros
Simplifies data integration across multiple tools
Reduces engineering effort for data pipelines
Improves data consistency and quality
Enhances compliance with privacy regulations
Scalable for businesses of all sizes
Cons
Pricing can be high for larger data volumes or advanced features
Initial setup may require technical expertise
Reliance on a third party for data routing
Requires careful management to avoid data duplication
Databox
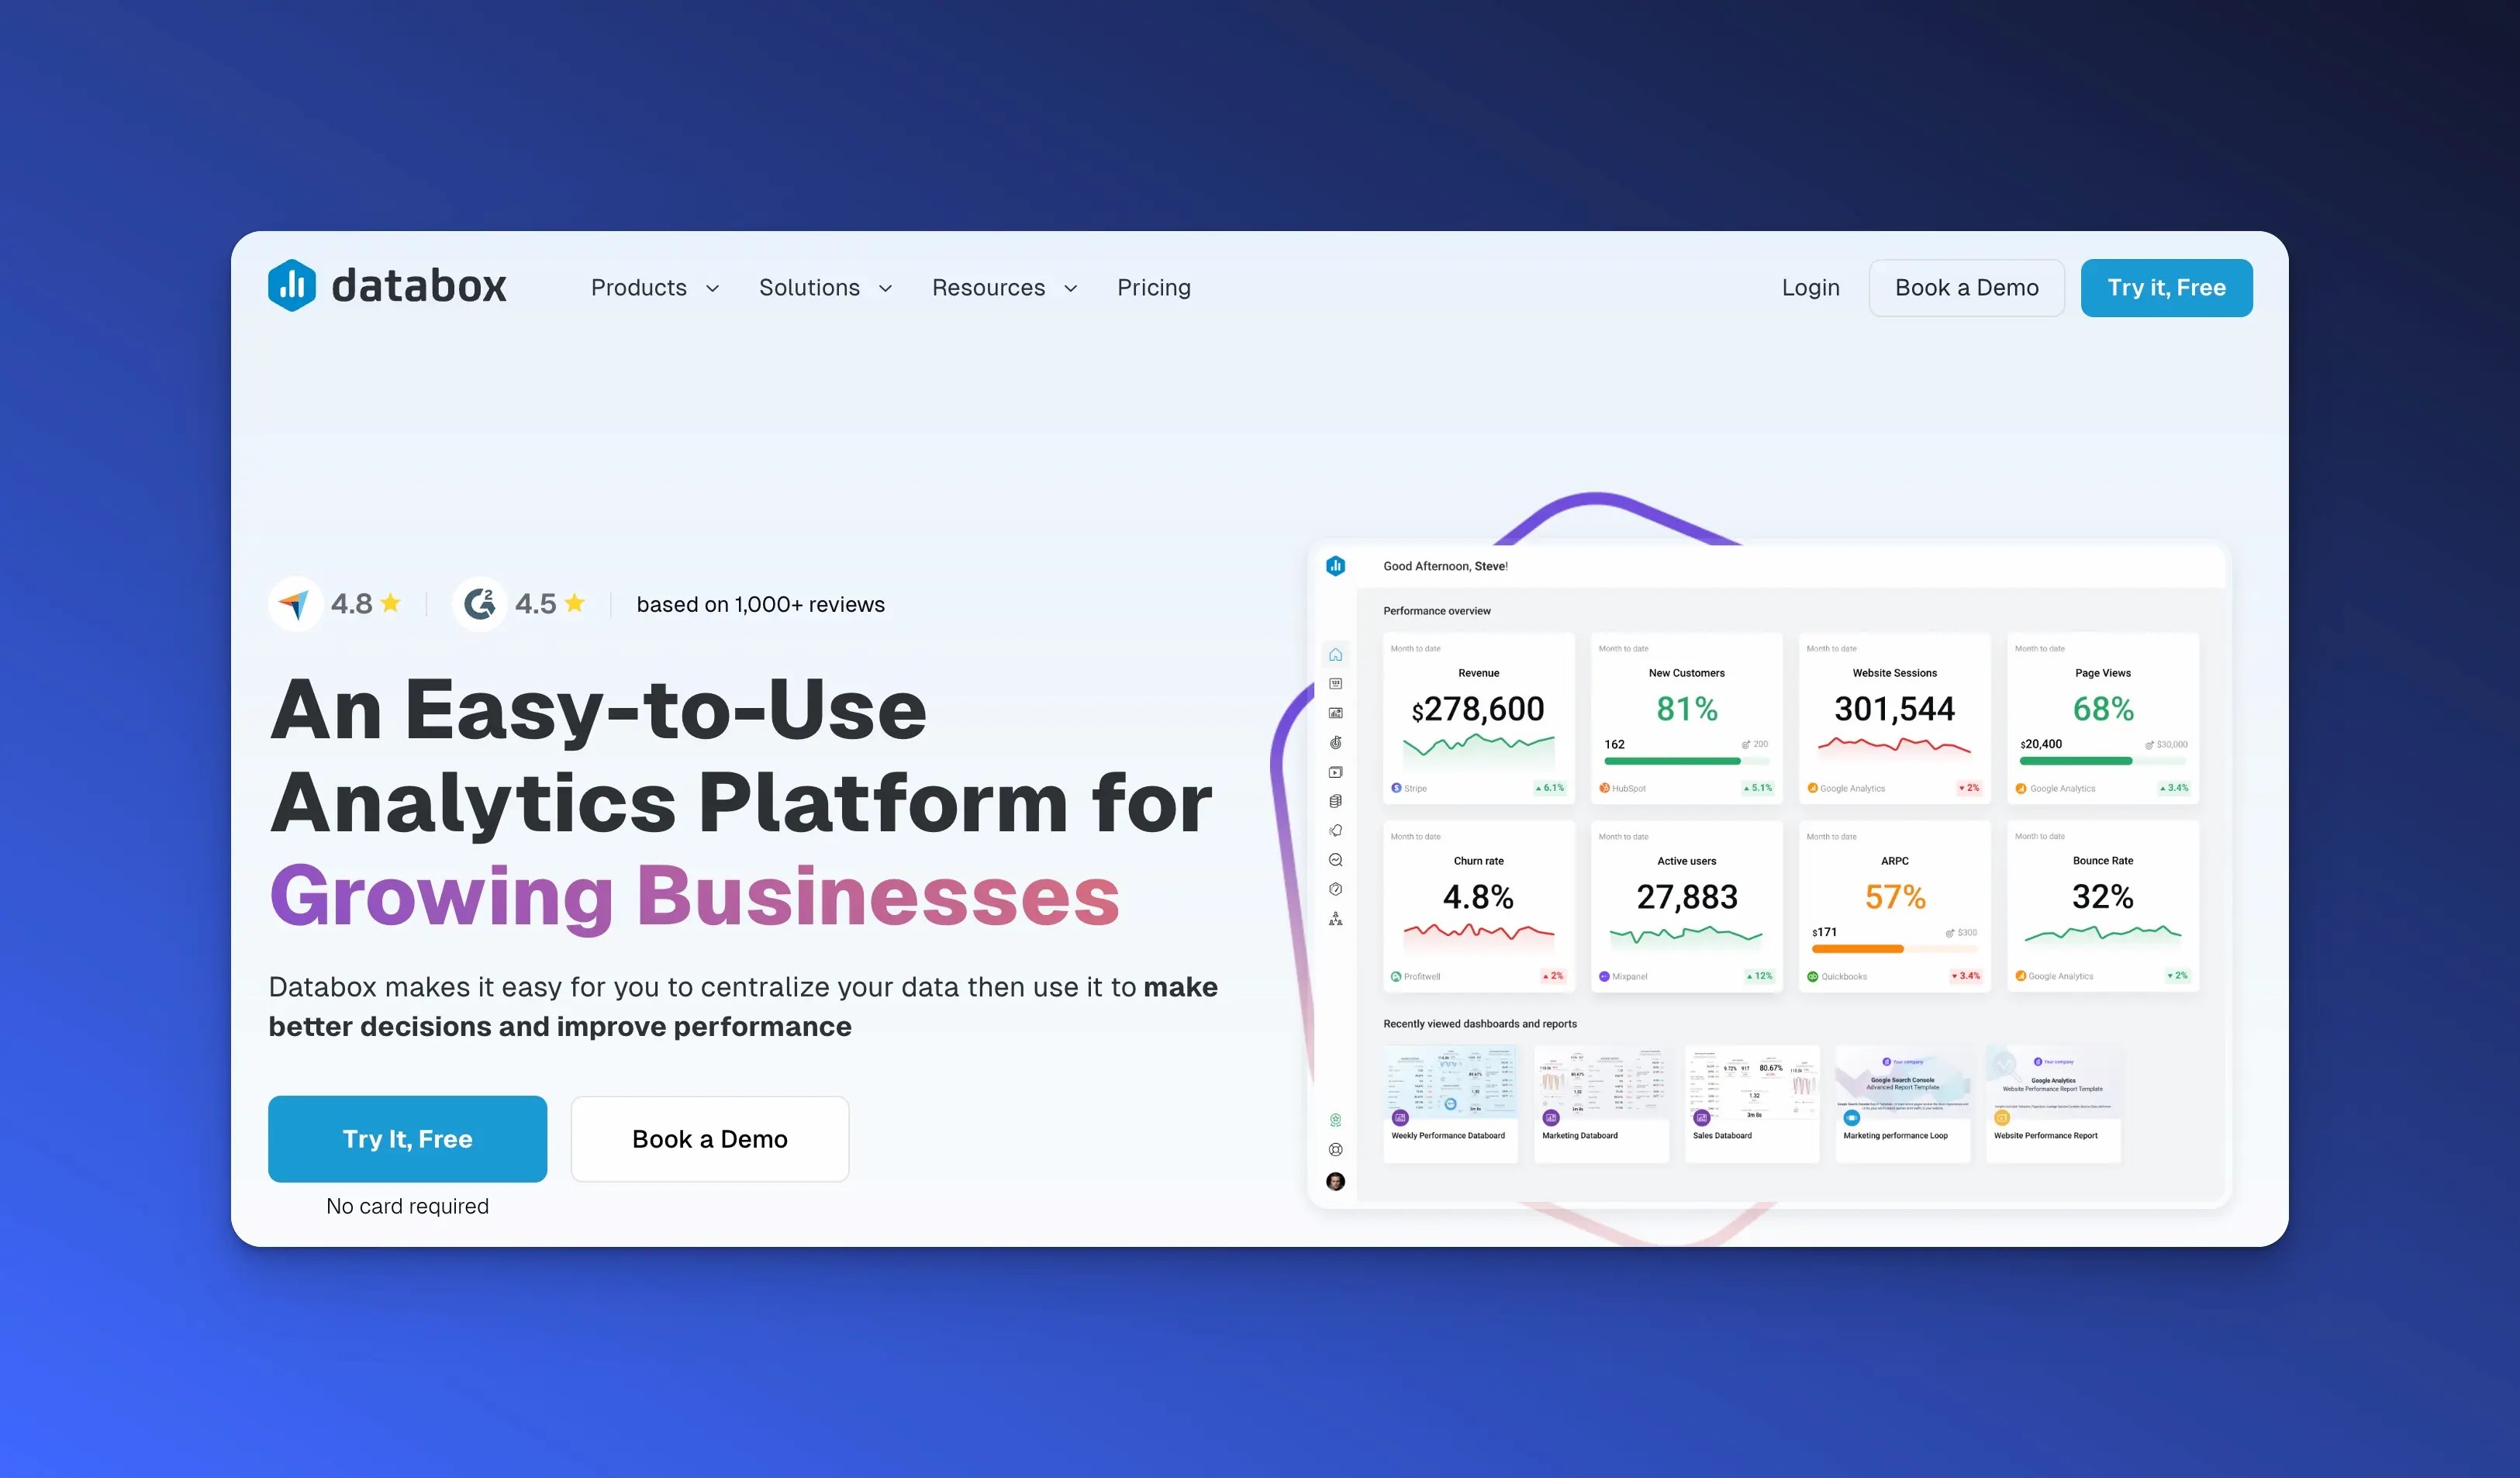
Unique differentiator: Comprehensive real-time dashboards aggregating data from multiple sources.
Databox is a business analytics platform that allows organizations to track, analyze, and report on key performance indicators (KPIs) from multiple data sources in real time. It provides customizable dashboards that bring together data from various tools, enabling teams to monitor performance metrics and make informed decisions quickly.
Use case
Consolidates key performance metrics from various sources into a single dashboard.
Enables real-time monitoring for swift, data-driven decision-making.
Aligns teams by providing accessible and customizable KPI visualizations.
Key features
Integration with numerous data sources (CRMs, marketing tools, databases)
Customizable dashboards with drag-and-drop interface
Goal tracking and KPI monitoring
Data visualizations and reporting tools
Mobile app for accessing dashboards on the go
Alerts and notifications for key metric changes
Pros
Centralizes data from multiple sources into one dashboard
User-friendly interface with easy customization
Real-time data updates
Helps align teams around shared metrics
Mobile access for monitoring on the go
Cons
May require time to set up integrations and dashboards
Some advanced features only available in higher-tier plans
Customization options may be limited compared to specialized BI tools
Data refresh rates may vary depending on data sources
HubSpot
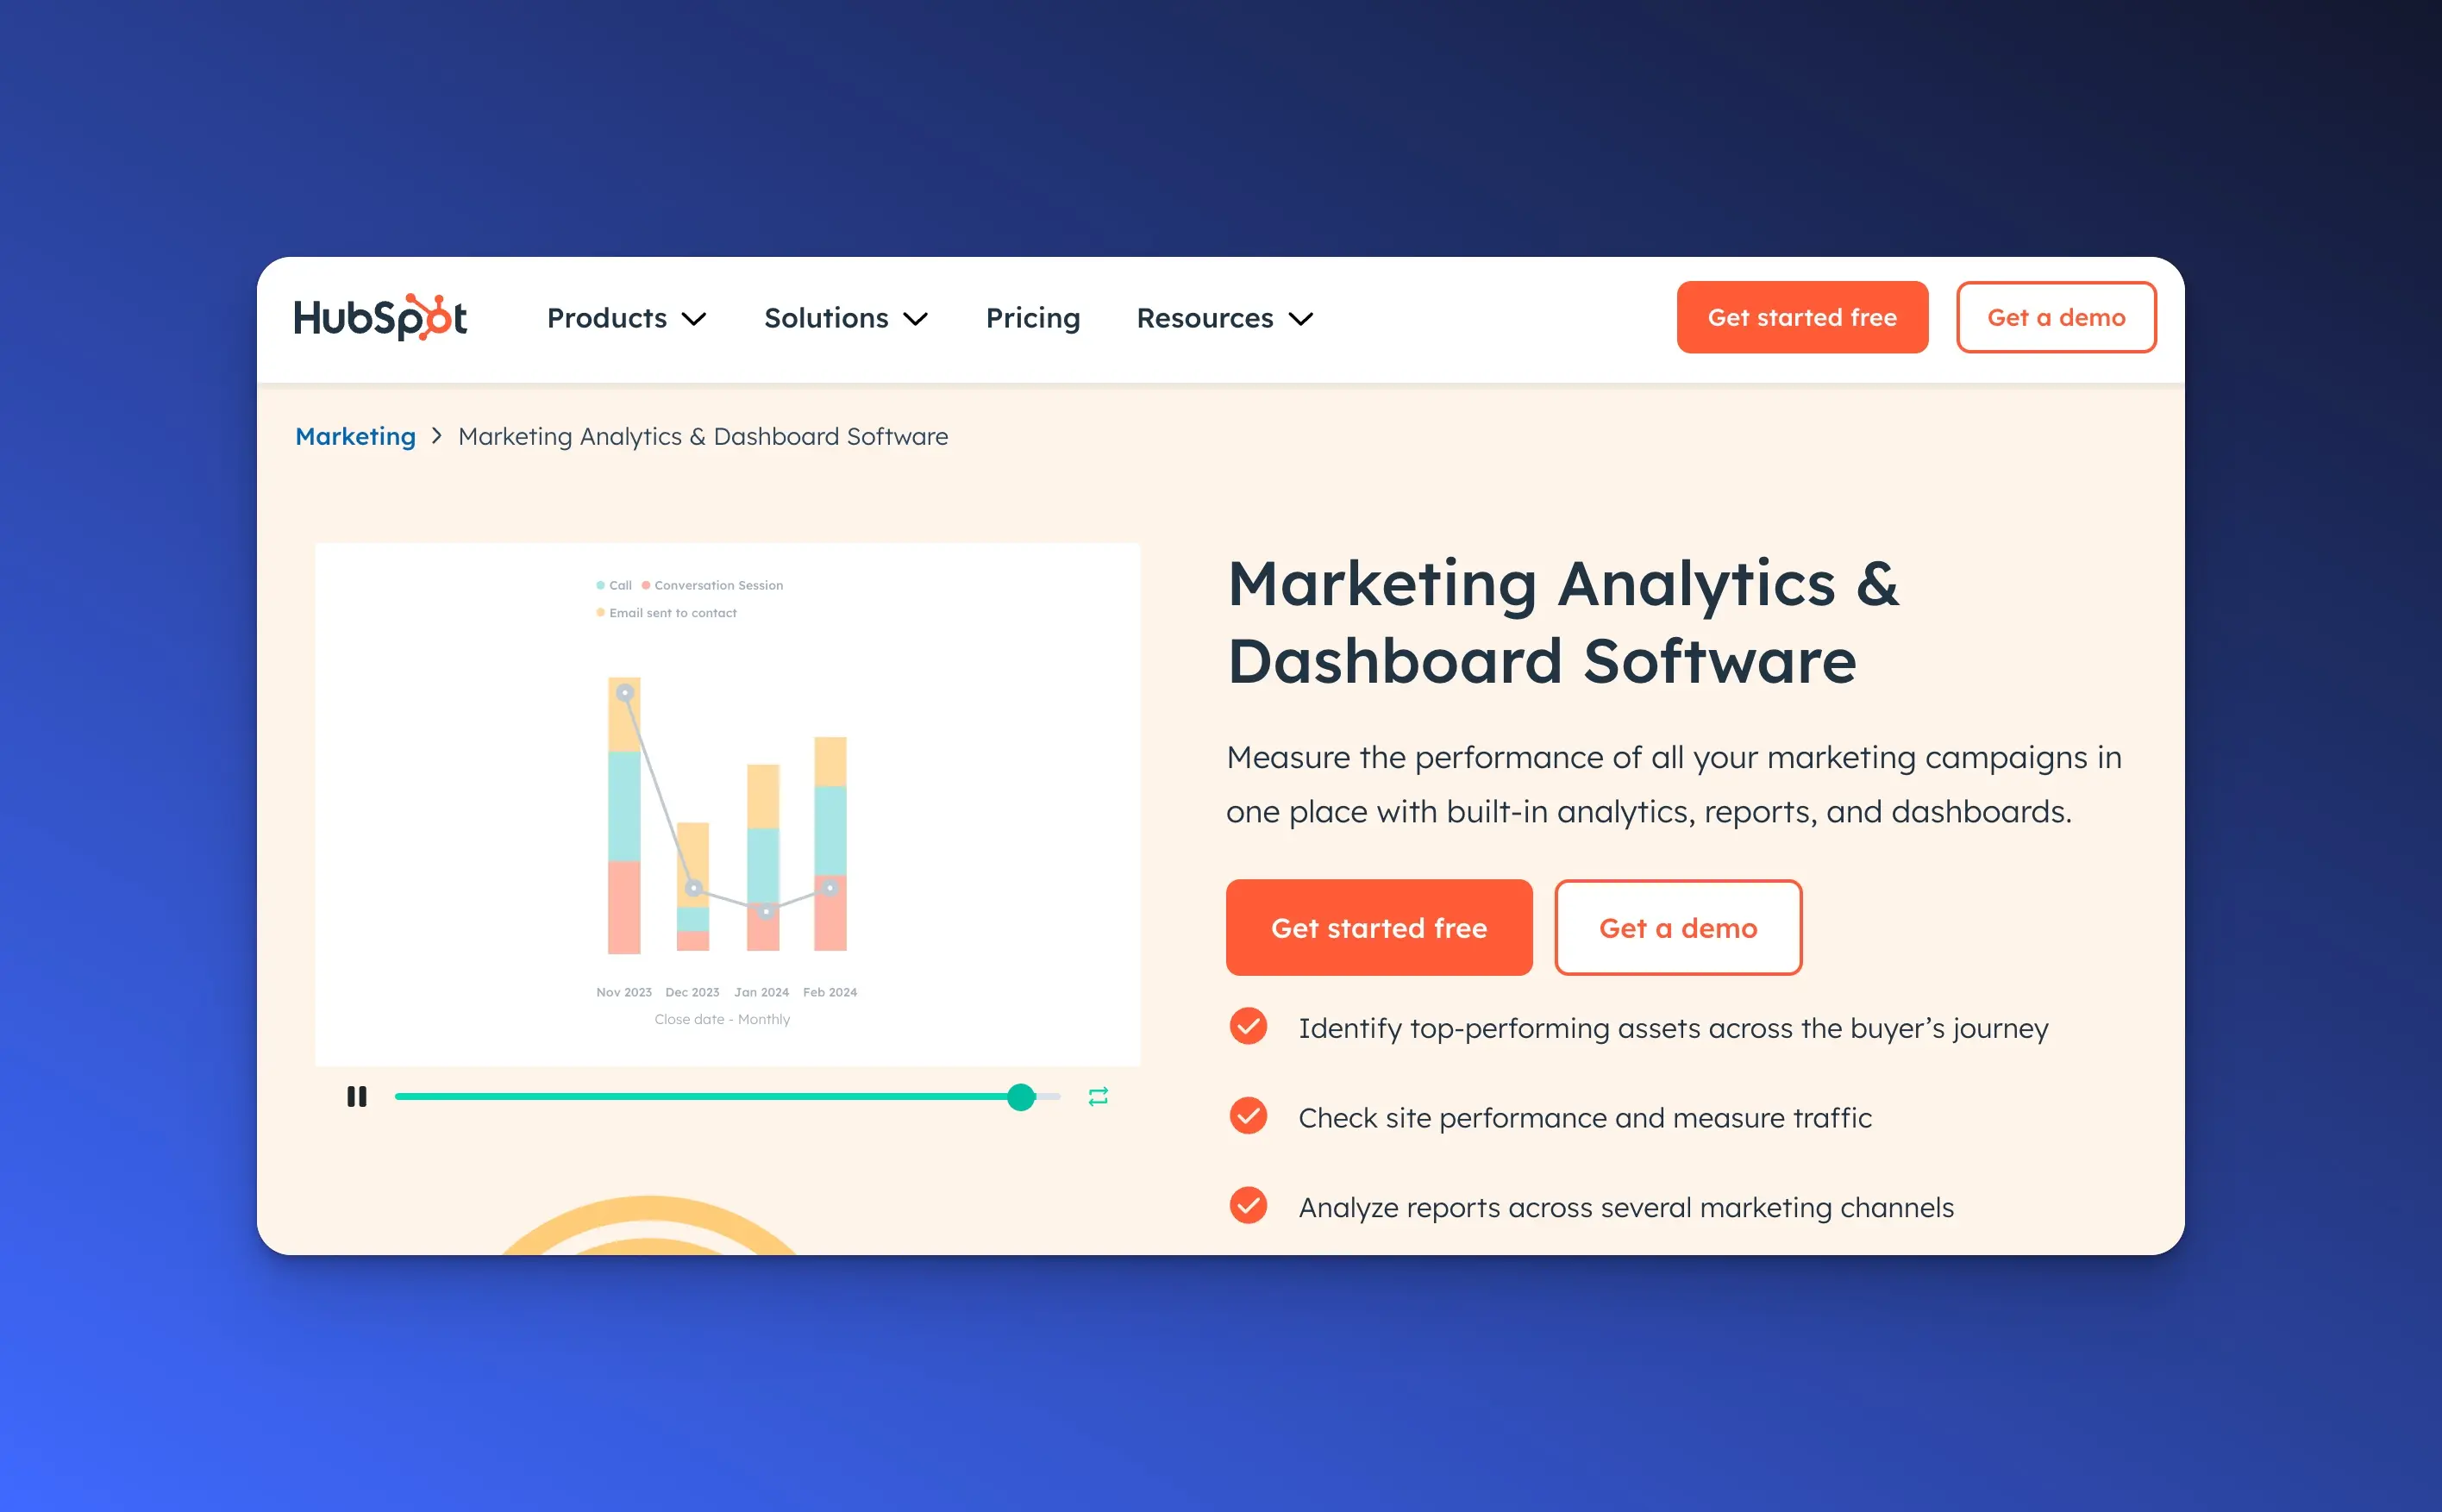
Unique differentiator: Integrated CRM and marketing automation platform for end-to-end customer engagement.
HubSpot is an all-in-one CRM platform that offers tools for marketing, sales, customer service, and content management. It provides businesses with the ability to attract, engage, and delight customers by centralizing customer data and automating marketing efforts, leading to better customer relationships and business growth.
Use case
Aligns marketing and sales efforts for better results.
Provides end-to-end visibility of customer journeys.
Enhances personalization and targeting in campaigns.
Key features
Contact and lead management
Email marketing and automation workflows
Sales pipeline management and analytics
Customer service tools and ticketing system
Marketing analytics and campaign tracking
Content management system (CMS)
Integration with a wide range of third-party tools
Pros
Unified platform for marketing, sales, and service teams
User-friendly interface suitable for non-technical users
Extensive automation capabilities
Comprehensive analytics and reporting
Strong support and educational resources
Cons
Pricing can increase significantly with added features and contacts
Some advanced features may require higher-tier subscriptions
Customization may be limited compared to specialized tools
Data export and migration can be complex
Tableau Online
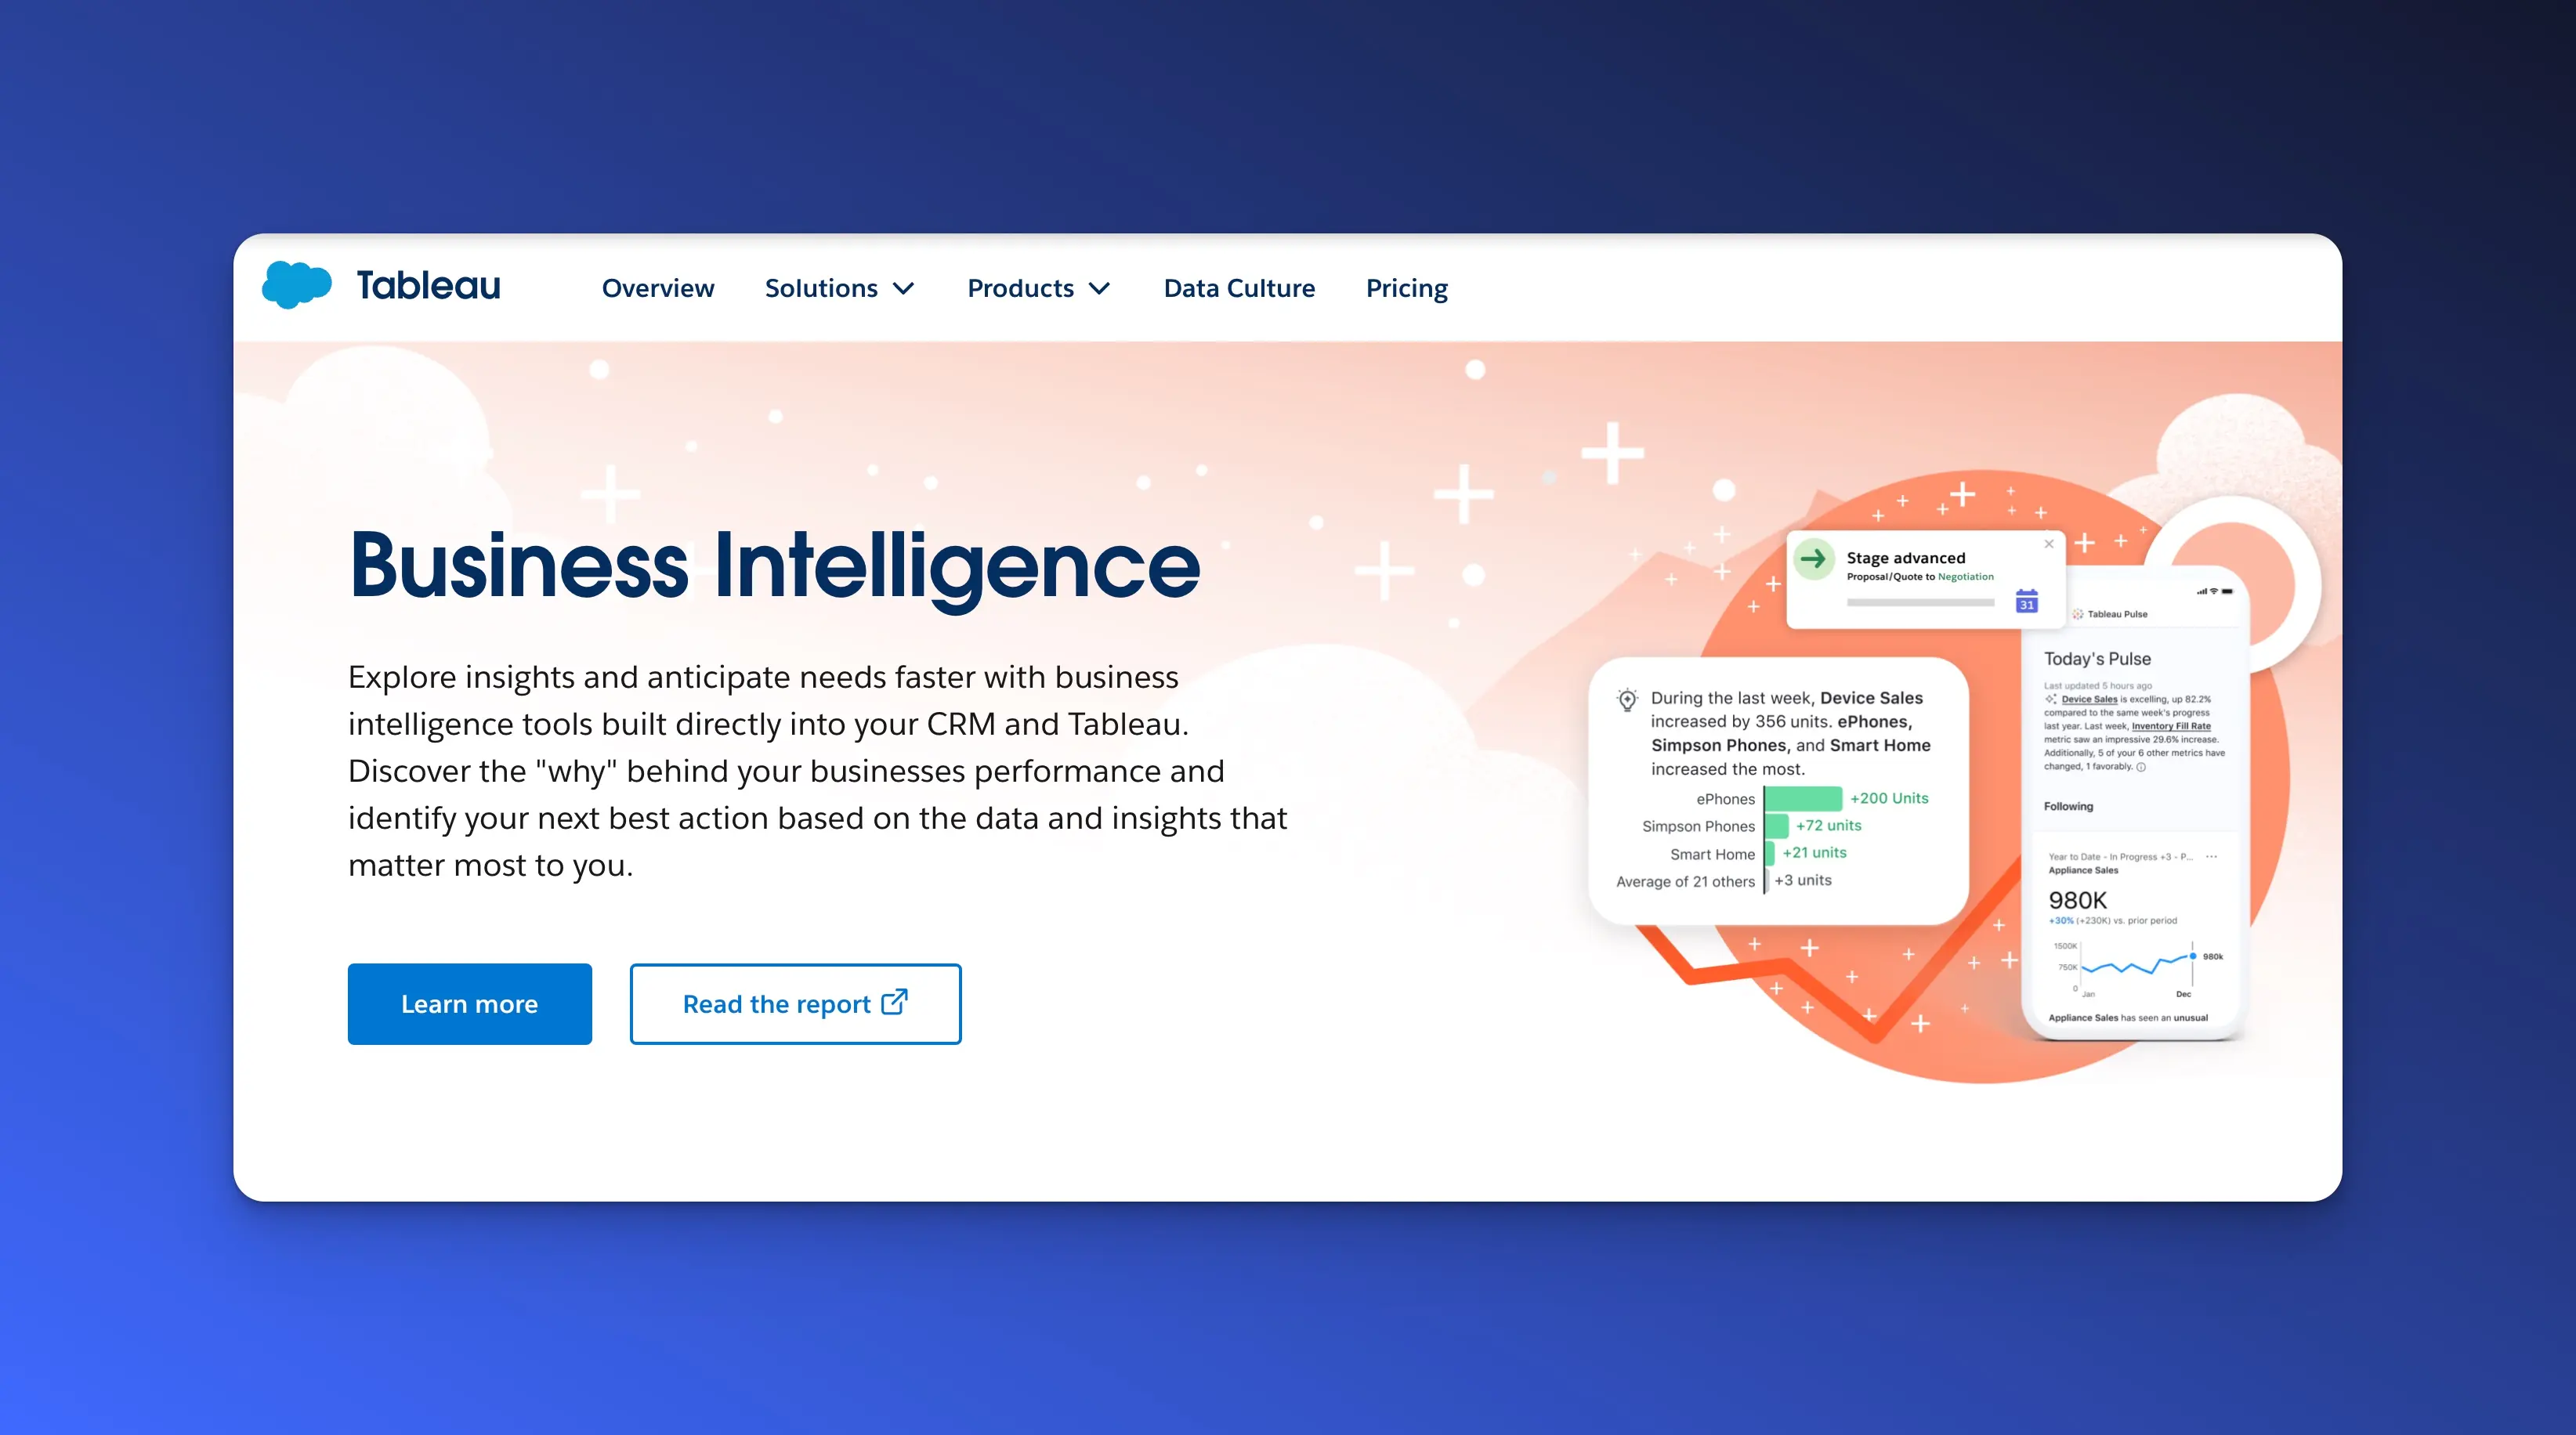
Unique differentiator: Highly customizable dashboards with powerful data visualization capabilities.
Tableau Online is a cloud-based analytics platform that allows users to visualize and share data insights across an organization. It provides interactive dashboards and reports, making it easier to understand complex data and make data-driven decisions. Tableau Online enables teams to collaborate on analytics without the need for on-premises infrastructure.
Use case
Transforms complex data into understandable visuals.
Enables stakeholders to uncover insights quickly.
Supports data-driven storytelling within organizations.
Key features
Drag-and-drop interface for creating visualizations
Interactive dashboards and reports
Live data connectivity and automatic data refresh
Collaboration features for sharing insights
Integration with various data sources
Advanced analytics functions, including calculations and forecasting
Pros
Intuitive interface suitable for non-technical users
Rich set of visualization options
Enables sharing and collaboration across teams
Accessible from anywhere with cloud deployment
Strong community and support resources
Cons
Can be expensive, especially for larger teams
Limited data preparation capabilities compared to some BI tools
Performance may be affected with very large datasets
Requires separate tools (e.g., Tableau Prep) for data cleaning
Datadog
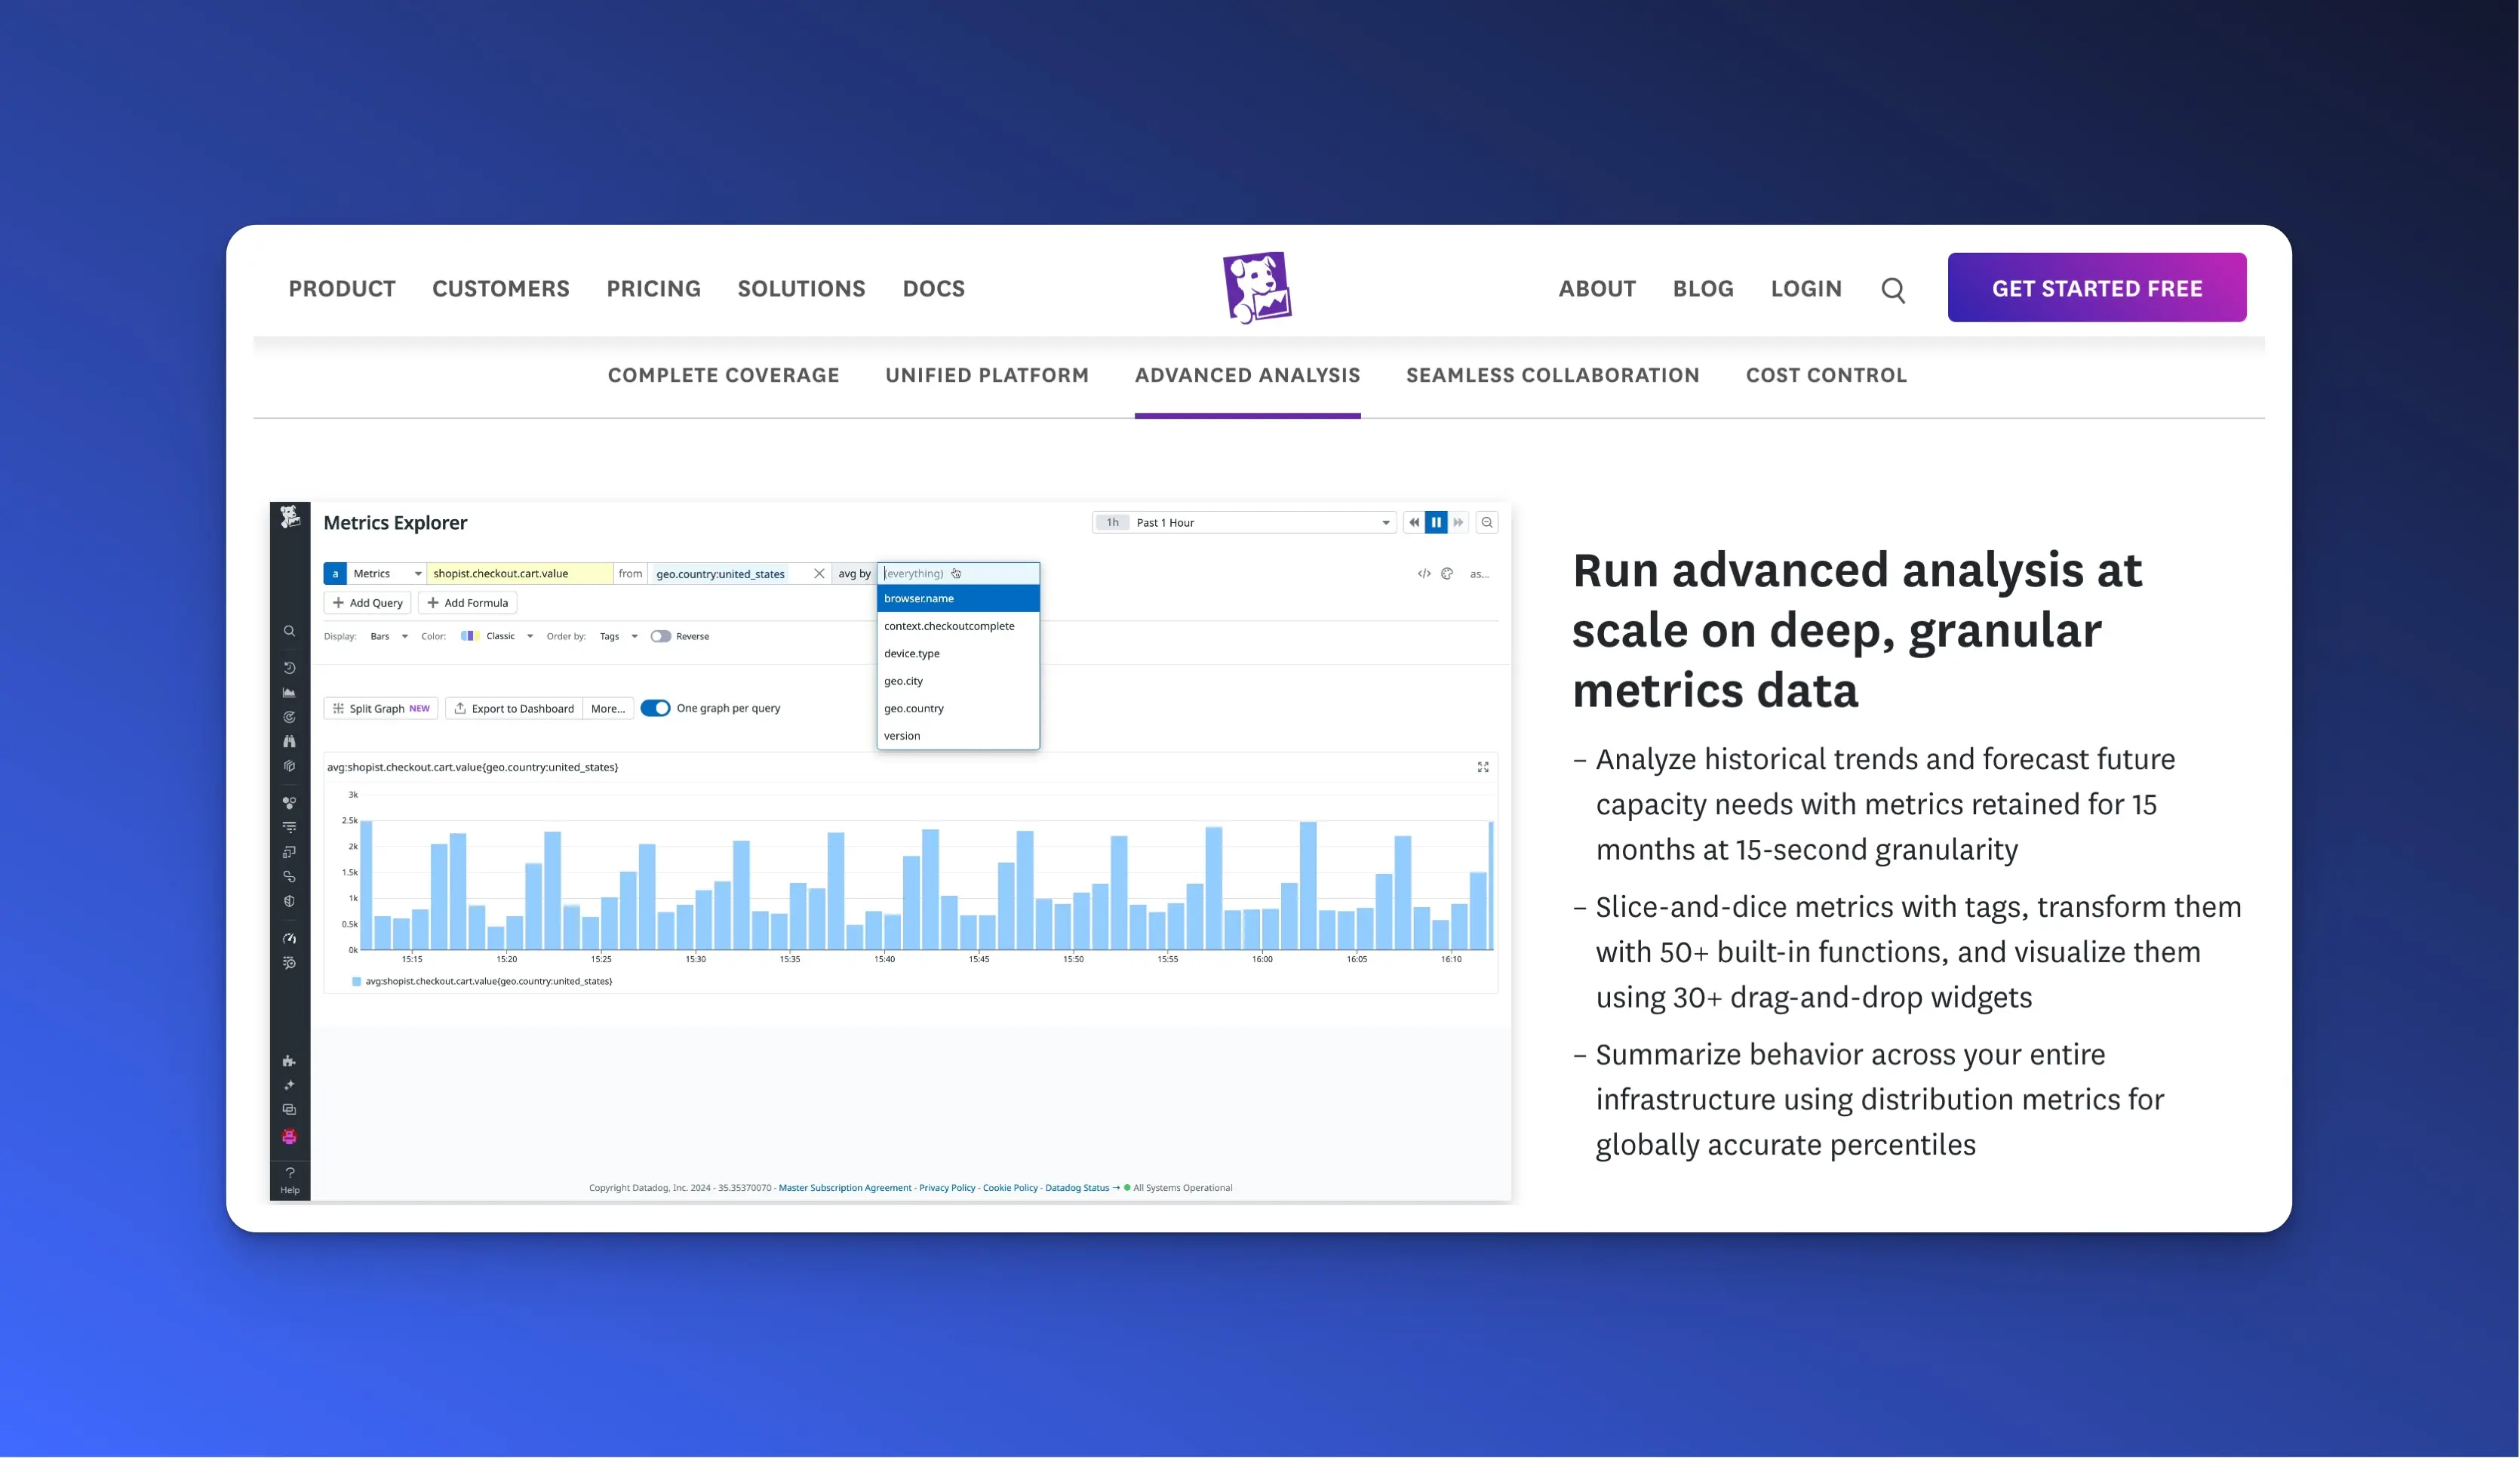
Unique differentiator: AI-driven anomaly detection and predictive analytics for proactive monitoring.
Datadog is a cloud-based monitoring and security platform that provides comprehensive visibility into an organization's entire tech stack. It monitors infrastructure, applications, logs, and user experience, enabling businesses to identify performance issues, track key metrics, and ensure high availability of their services.
Use case
Monitors performance to prevent downtime.
Detects anomalies with AI analytics.
Maintains high application reliability.
Key features
Infrastructure monitoring
Application performance monitoring (APM)
Log management and analytics
Real user monitoring (RUM)
Network performance monitoring
Machine learning-powered alerts and anomaly detection
Dashboard and visualization tools
Pros
Comprehensive monitoring across the full stack
Real-time visibility into performance metrics
Scalable for organizations of all sizes
Extensive integrations with cloud services and tools
Proactive alerts with AI-driven insights
Cons
Can be complex to set up and configure
Pricing can increase with data volume and features
Steeper learning curve for new users
May require technical expertise for advanced features
Conclusion
We’ve covered the top 11 SaaS analytics tools, each designed to tackle specific challenges, from user behavior tracking to subscription analytics. Together, they create a powerful toolkit for optimizing your SaaS business and driving growth.
The future of SaaS analytics lies in AI-powered insights, predictive capabilities, and robust data privacy. Staying ahead means adopting tools that evolve with these trends, ensuring your business remains competitive in 2025 and beyond.
Choosing the right tools starts with understanding your unique goals. Look for solutions that align with your needs, offer seamless integration, and scale as your business grows.
Have you used any of these tools? Share your experiences in the comments. And if you're looking to refine your mobile app experience, give UXCam a try for actionable insights into user behavior.
You might also be interested in these;
What is Web Analytics? Definition, Metrics & Best Practices
Website Visitor Tracking - A Comprehensive Guide
Top 10 Digital Analytics Tools You Need to Know
Ultimate Website Optimization Guide: Must-Know Tactics
Website Analysis 101: How to Analyze for Peak Performance
AUTHOR

Tope Longe
Product Analytics Expert
Ardent technophile exploring the world of mobile app product management at UXCam.
What’s UXCam?
Related articles
Website Analysis
Website Heatmap - Ultimate Guide and Best Tools [2026]
Read the ultimate 2026 guide to website heatmaps: discover types, implementation, and the best heatmap tools to optimize user experience and site's...

Jonas Kurzweg
Product Analytics Expert
Website Analysis
Best Free Web Analytics Tools [2026]
Compare the best free web analytics tools for UX, product, and privacy. See why UXCam is the top choice for behavioral insights, compliance, and...

Jonas Kurzweg
Product Analytics Expert
Website Analysis
What is Web Analytics? Definition, Metrics & Best Practices
Discover what web analytics is, its definition, key examples, and the best tools to optimize your website's performance and user...

Tope Longe
Product Analytics Expert
