What Is Web Analytics? Definition, Metrics, and Top 10 Tools (2026)


TABLE OF CONTENTS
- Key takeaways
- What is web analytics?
- Why web analytics matters for your business
- What web analytics can tell you
- Key metrics in web analytics
- The 10 best web analytics tools in 2026
- How to set up web analytics for your website
- Why UXCam for web analytics
- Best practices for web analytics
- Turn your data into actionable insights with UXCam
Web analytics is the collection, measurement, and analysis of data about website visitors to understand their behavior, optimize conversions, and inform product and marketing decisions. The data covers traffic sources, pageviews, session duration, conversion rates, scroll depth, clicks, rage taps on interactive elements, and dozens of other signals, quantitative and qualitative, that together describe what's happening on a site.
Web analytics splits into two camps that most teams conflate: quantitative analytics (how many, how often, at what rate) and qualitative analytics (why, what did the user actually experience). The tools that handle both well in one place are rare. The tools that handle one or the other are common. Knowing which half you're looking at is usually the difference between "our bounce rate went up" and "our bounce rate went up because the new hero image is 3MB and kills load time on mobile."
This guide covers the definition, the metrics that matter most, the 10 tools worth using in 2026, and how to set up measurement that actually informs decisions rather than building a dashboard graveyard.
Key takeaways
Web analytics is not the same as "having GA4 set up." GA4 is one tool in one layer. Full web analytics covers four layers: traffic, behavior, conversion, and qualitative diagnosis.
The single most useful metric for a product team is conversion rate by page, not bounce rate or session duration. Pair it with qualitative diagnosis (session replay, heatmaps) to understand the why behind the numbers.
Most teams I audit have too many metrics and too little behavioral data. Cutting to 10 tracked metrics and adding session replay almost always improves decision quality.
Post-cookie-deprecation and post-ATT, first-party event tracking matters more than third-party attribution. Your analytics stack should emphasize what happens on your site, not what happens before users arrive.
UXCam's web analytics is built on the same product intelligence platform that handles mobile analytics for 37,000+ products, bringing session replay, heatmaps, funnels, and AI-powered issue detection to websites in one tool.
What is web analytics?
Web analytics is the practice of measuring and analyzing user behavior on a website to improve the experience and business outcomes. It combines passive measurement (what users did) with active interpretation (why and what to change about it). The field has four distinct layers:
Traffic analytics: where users come from, how many arrive, at what rate. Tools: GA4, Google Search Console, Cloudflare Web Analytics. Answers "who is visiting and from where?"
Behavior analytics: what users do once they arrive. Pageviews per session, scroll depth, click patterns, form abandonment. Tools: GA4, UXCam, Mixpanel. Answers "what are they doing?"
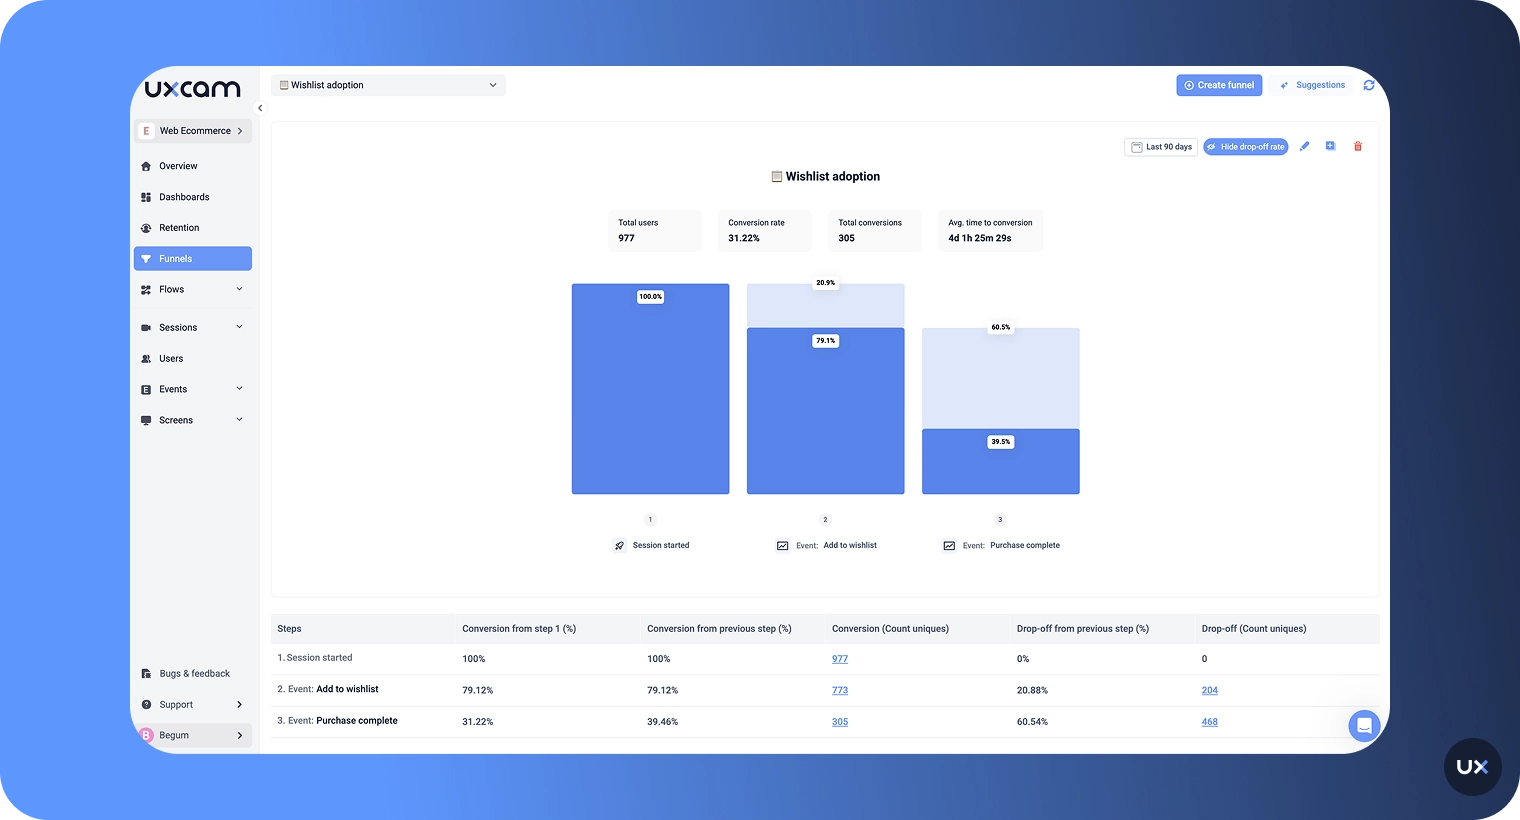
Conversion analytics: how often visitors complete the actions that matter (signup, purchase, add-to-cart). Tools: GA4, UXCam funnels, Heap. Answers "how well are we turning visitors into customers?"
Qualitative analytics: why users behave the way they do. Session replays, heatmaps, surveys, rage-click detection. Tools: UXCam, Hotjar, FullStory. Answers "why are they leaving / converting / struggling?"
Most teams invest heavily in the first two layers and barely touch the fourth. That's where I find most of the actionable insight.
Examples of web analytics in practice
An e-commerce team notices cart abandonment spiking on mobile. Session replay shows the shipping calculator's dropdown doesn't fit the screen on mid-range Android phones.
A SaaS signup flow converts at 18%. Funnel analytics pinpoints step 3 (email verification) as the bottleneck. Session replay confirms users are typing their email wrong and getting a generic error without a retry option.
A content site's bounce rate looks bad on paper. Segmentation reveals most "bounces" are users reading the full article on a phone and leaving in under 2 minutes, which is actually success. The metric needed a better definition, not a new design.
Why web analytics matters for your business
Three concrete reasons:
Revenue. Every conversion improvement compounds. A 10% lift on a 2% conversion rate grows your revenue by 10% without increasing traffic costs. Web analytics surfaces the specific friction points where those lifts live.
Budget justification. You can't defend a marketing spend or a product investment without measured impact. Web analytics is how you show what's working, what isn't, and what to cut.
User experience. Analytics surfaces UX issues that QA testing misses: a button that doesn't respond on a specific browser, a form that errors silently, a flow that breaks on a mobile device nobody on the team owns.
What web analytics can tell you
Which marketing channels actually drive qualified traffic (vs. just traffic)
Which pages convert and which drag conversion down
Where users drop off in your critical funnels (signup, checkout, upgrade)
What content keeps users on your site vs. what pushes them away
How fast (or slow) your site feels to real users in different regions
Which devices and browsers you're underserving
What users struggle with, via rage clicks and abandoned interactions
Key metrics in web analytics
The metrics I'd pin to any web analytics dashboard:
Sessions and unique visitors (baseline traffic measurement)
Bounce rate (carefully defined; engaged-session rate in GA4 is the modern equivalent)
Pages per session and session duration (engagement depth)
Conversion rate by page (the single most important metric for product teams)
Source and medium (where traffic comes from)
Core Web Vitals (LCP, INP, CLS; performance affects everything else)
Rage click rate (qualitative signal of friction)
Form abandonment rate (conversion-blocking signal)
Ten or fewer is the right number for a primary dashboard. More than that and nobody reads it.
The 10 best web analytics tools in 2026
UXCam (product intelligence + session replay for web)
Google Analytics 4 (baseline traffic analytics)
Mixpanel (product-style web analytics)
Amplitude (product analytics with web support)
Hotjar (qualitative web analytics)
Microsoft Clarity (free session replay + heatmaps)
Heap (auto-capture event analytics)
Plausible (privacy-first lightweight analytics)
Cloudflare Web Analytics (free, privacy-focused, server-side)
Google Search Console (SEO and organic traffic analytics)
Why UXCam is at the top: for product teams that need behavioral depth plus quantitative metrics in one platform, UXCam is the only tool that combines session replay, heatmaps, funnels, retention analytics, and an AI analyst in a single product. Most of the tools below handle one layer well. UXCam handles all four.
How to set up web analytics for your website
1. Choose the right analytics tool
Pick your stack based on what you need:
GA4 alone: adequate for marketing-focused teams with basic questions
GA4 + Hotjar: adds qualitative layer, common starter stack
UXCam: single platform covering quantitative + qualitative + AI-powered diagnosis
Mixpanel or Amplitude: product-focused analytics if you're heavy on events
For most product teams in 2026, I recommend UXCam as the primary behavioral tool with GA4 in parallel for marketing-level reporting.
2. Install the tracking code
Add the JavaScript snippet to your site's
. For most tools this is a copy-paste. For single-page applications, make sure the snippet fires on route changes, not just initial page load. Verify the install with the browser extension or live events view each tool provides.3. Set up goals and conversions
Define your key conversion events: signups, purchases, form submissions, content downloads. These become the outcome metrics you'll measure everything else against. Keep the list short (3-5 primary conversions).
4. Create custom reports and dashboards
Build dashboards by audience: one for marketing (traffic sources, channel performance), one for product (conversion by page, funnel drop-off), one for leadership (weekly high-level trends). Each dashboard should have fewer than 10 metrics.
Why UXCam for web analytics


UXCam is a product intelligence and product analytics platform built for both mobile apps and websites. Its web analytics product automatically captures every user interaction, with no manual event tagging, so teams can retroactively analyze any behavior without code changes or redeploys.
Quick to set up, easy to use
Install the JavaScript snippet and start collecting session data immediately. The auto-capture means you don't spend weeks instrumenting events before you can answer your first question. Teams typically go from install to first actionable insight in hours rather than weeks.
Built for both quantitative and qualitative


UXCam brings together session replay, heatmaps, funnels, retention analytics, segmentation, and issue analytics in one platform. Every metric is backed by real user sessions. See a drop-off in a funnel? Click to watch the actual sessions where users left.
Get insights in a few clicks with Tara AI
Tara, UXCam's AI analyst, watches session replays at scale and automatically surfaces UX issues like rage taps, dead clicks, and unresponsive flows. Instead of scrubbing through hundreds of recordings, you ask Tara a question in natural language and get a prioritized list of issues with session evidence. For teams without a dedicated analyst, that's a step-change in how fast you can diagnose problems.
Best practices for web analytics
Set clear goals
Every metric you track should map to a decision someone will make. If you can't name the decision, stop tracking the metric.
Focus on key metrics
Ten metrics on your primary dashboard. No more. Focus beats comprehensiveness for day-to-day decision-making.
Use segmentation for deeper insights
Aggregate numbers hide patterns. Segment by device, traffic source, new vs. returning, and geography to find the actual signal.
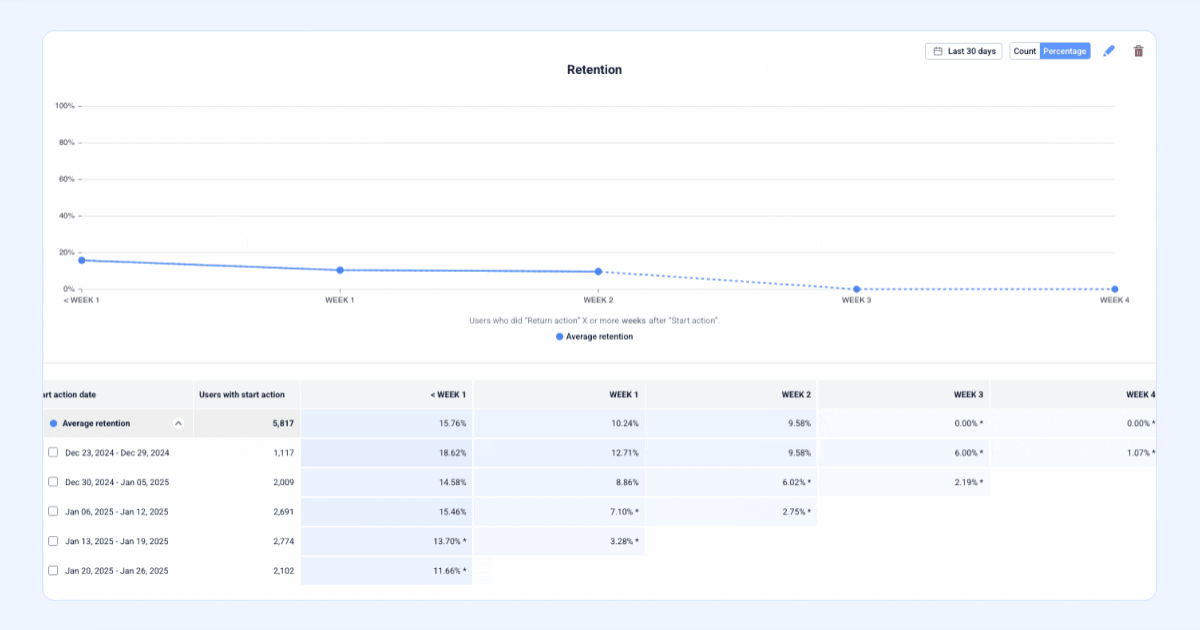
Track user journeys
Map the paths users take through your site. UXCam User Journeys visualizes the actual navigation patterns, including unexpected routes, dead ends, and the routes most tied to conversion.
Use conversion funnels
Define your top 3 funnels (signup, checkout, key conversion). Measure drop-off between each step. The biggest percentage drop is usually your highest-leverage fix.
A/B test for continuous improvement
Pair web analytics with an experimentation platform (see the A/B testing tools guide) to validate changes before rolling out to all users.
Set up custom alerts
Alert on significant daily drops in conversion rate, rage-tap rate 3x above baseline, and completed-form rate drops. Three alerts catch most silent outages before support tickets start piling up.
Use dashboards for quick insights
Daily glance, weekly deep-dive, monthly cohort review. Each cadence needs a different dashboard.
Essential dashboard metrics by goal
| Goal | Primary metrics |
|---|---|
| Grow traffic | Sessions, new users, top landing pages, referral sources |
| Improve engagement | Pages per session, session duration, scroll depth, rage clicks |
| Lift conversion | Conversion rate by page, funnel drop-off, form completion rate |
| Reduce friction | Core Web Vitals (LCP, INP, CLS), rage taps, dead clicks, error rate |
Turn your data into actionable insights with UXCam
UXCam is a product intelligence and product analytics platform that automatically captures every user interaction on websites and mobile apps, with no manual event tagging. Tara, UXCam's AI analyst, processes session replays to surface UX issues and recommend specific actions, so product teams get answers without waiting on analysts and the evidence to convince stakeholders.
Installed in 37,000+ products across 50+ countries. Mobile-first, web-ready. Request a demo to see it for your site.
Frequently asked questions
What is web analytics?
Web analytics is the collection, measurement, and analysis of data about website visitors to understand behavior, optimize conversions, and inform product and marketing decisions. It covers four layers: traffic (where users come from), behavior (what they do on site), conversion (what they complete), and qualitative diagnosis (why they behave the way they do). Most teams invest in the first three layers and skip the fourth, which is where the biggest insights usually live.
How does web analytics work?
Web analytics tools place a JavaScript snippet in your site's HTML that records user interactions (pageviews, clicks, scrolls, form submissions) and sends them to an analytics platform for analysis. Modern tools like UXCam auto-capture every interaction, so you don't need to manually instrument each event. The platform aggregates, segments, and visualizes the data, often with session replay and heatmap layers on top to show the "why" behind the numbers.
What are the key metrics in web analytics?
The most important: conversion rate by page, funnel drop-off rate, engaged-session rate (GA4's modern bounce-rate replacement), pages per session, Core Web Vitals (LCP, INP, CLS), rage-click rate, and form abandonment rate. Traffic sources and channel mix matter for marketing. Focus your primary dashboard on 10 metrics or fewer.
What's the difference between web analytics and product analytics?
Web analytics focuses on website interactions: pageviews, sessions, traffic sources, conversions. Product analytics focuses on what users do inside a product (feature usage, retention, cohorts), which applies to both web and mobile apps. The distinction is blurring as platforms like UXCam, Mixpanel, and Amplitude cover both. If you're running a SaaS web app, you probably need product analytics more than pure marketing-focused web analytics.
What's the best free web analytics tool?
Google Analytics 4 for baseline traffic and conversion data. Microsoft Clarity for free session replay and heatmaps. UXCam has a free tier (up to 3,000 sessions) that gives access to the full product intelligence platform. For most small sites, GA4 plus Clarity is a reasonable free starting stack.
How do I set up web analytics for my website?
- Pick your tool (GA4 minimum; add UXCam or Hotjar for qualitative). 2) Install the tracking snippet on every page. 3) Define 3-5 key conversion events. 4) Build a 10-metric primary dashboard. 5) Set up alerts for significant drops in the metrics you care most about. This process takes a few hours and sets you up for continuous improvement rather than one-off analyses.
Do I need web analytics if I already have GA4?
GA4 is a good foundation but misses the qualitative layer. Adding session replay and heatmaps (via UXCam, Hotjar, or Clarity) catches the specific UX issues GA4 can surface as "a number moved" but can't explain. Most teams I audit need this qualitative layer more than more quantitative tools. If you only have GA4, adding a session replay tool is usually the highest-ROI next analytics investment.
AUTHOR
Silvanus Alt, PhD
Founder & CEO | UXCam
Silvanus Alt, PhD, is the Co-Founder & CEO of UXCam and a expert in AI-powered product intelligence. Trained at the Max Planck Institute for the Physics of Complex Systems, he built Tara, the AI Product Analyst that not only analyzes user behavior but recommends clear next steps for better products.


TABLE OF CONTENTS
- Key takeaways
- What is web analytics?
- Why web analytics matters for your business
- What web analytics can tell you
- Key metrics in web analytics
- The 10 best web analytics tools in 2026
- How to set up web analytics for your website
- Why UXCam for web analytics
- Best practices for web analytics
- Turn your data into actionable insights with UXCam


Related articles


Website Analysis
Digital Analytics: The Complete 2026 Guide
A practical guide to digital analytics in 2026. The four types (descriptive, diagnostic, predictive, prescriptive), how each actually gets used,...
Silvanus Alt, PhD
Founder & CEO | UXCam


Website Analysis
Website Visitor Tracking: Tools, Metrics, How-To (2026)
Website visitor tracking is the practice of capturing how individual users behave on your site (clicks, scrolls, form interactions, page paths) so you...
Silvanus Alt, PhD
Founder & CEO | UXCam
Website Analysis
What Is Web Analytics? Definition, Metrics, and Top 10 Tools (2026)
Web analytics is the collection, measurement, and analysis of data from website visitors to understand behavior, optimize conversions, and inform...
Silvanus Alt, PhD
Founder & CEO | UXCam