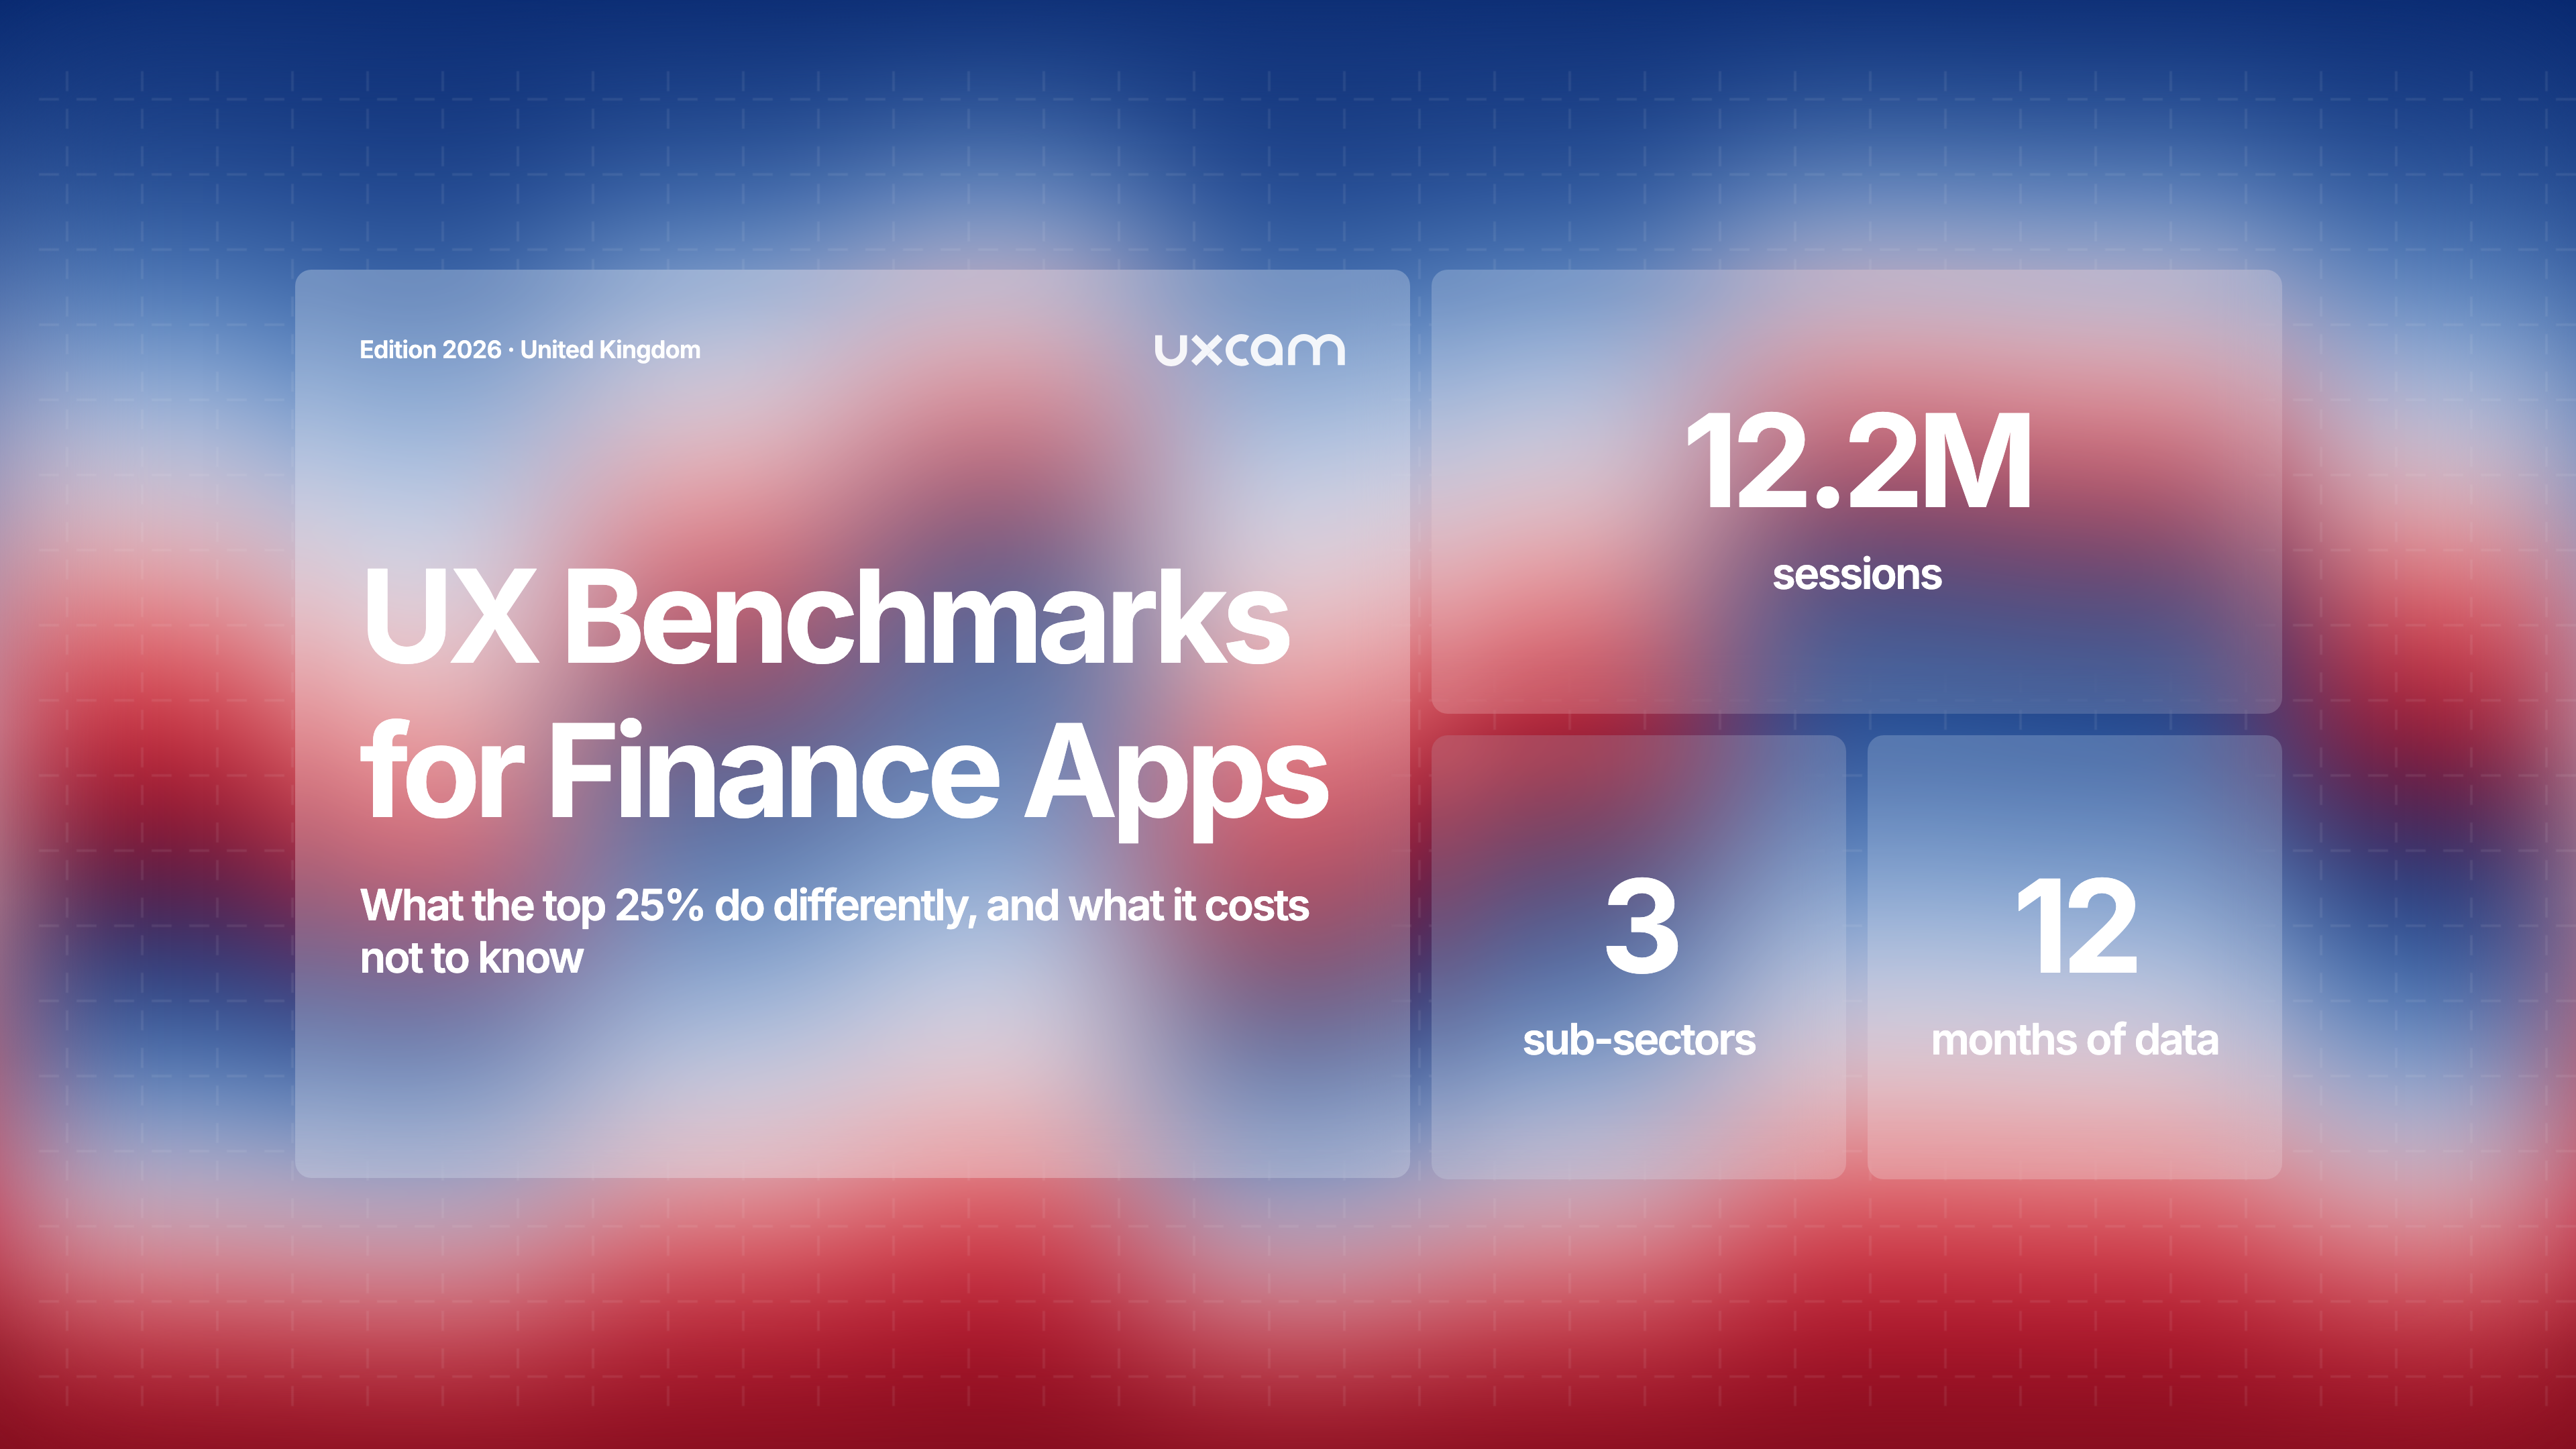
UX Benchmarks for Finance Apps in the UK
What the top 25% do differently, and what it costs not to know
12.2Msessions analysed
3sub-sectors
12months of data
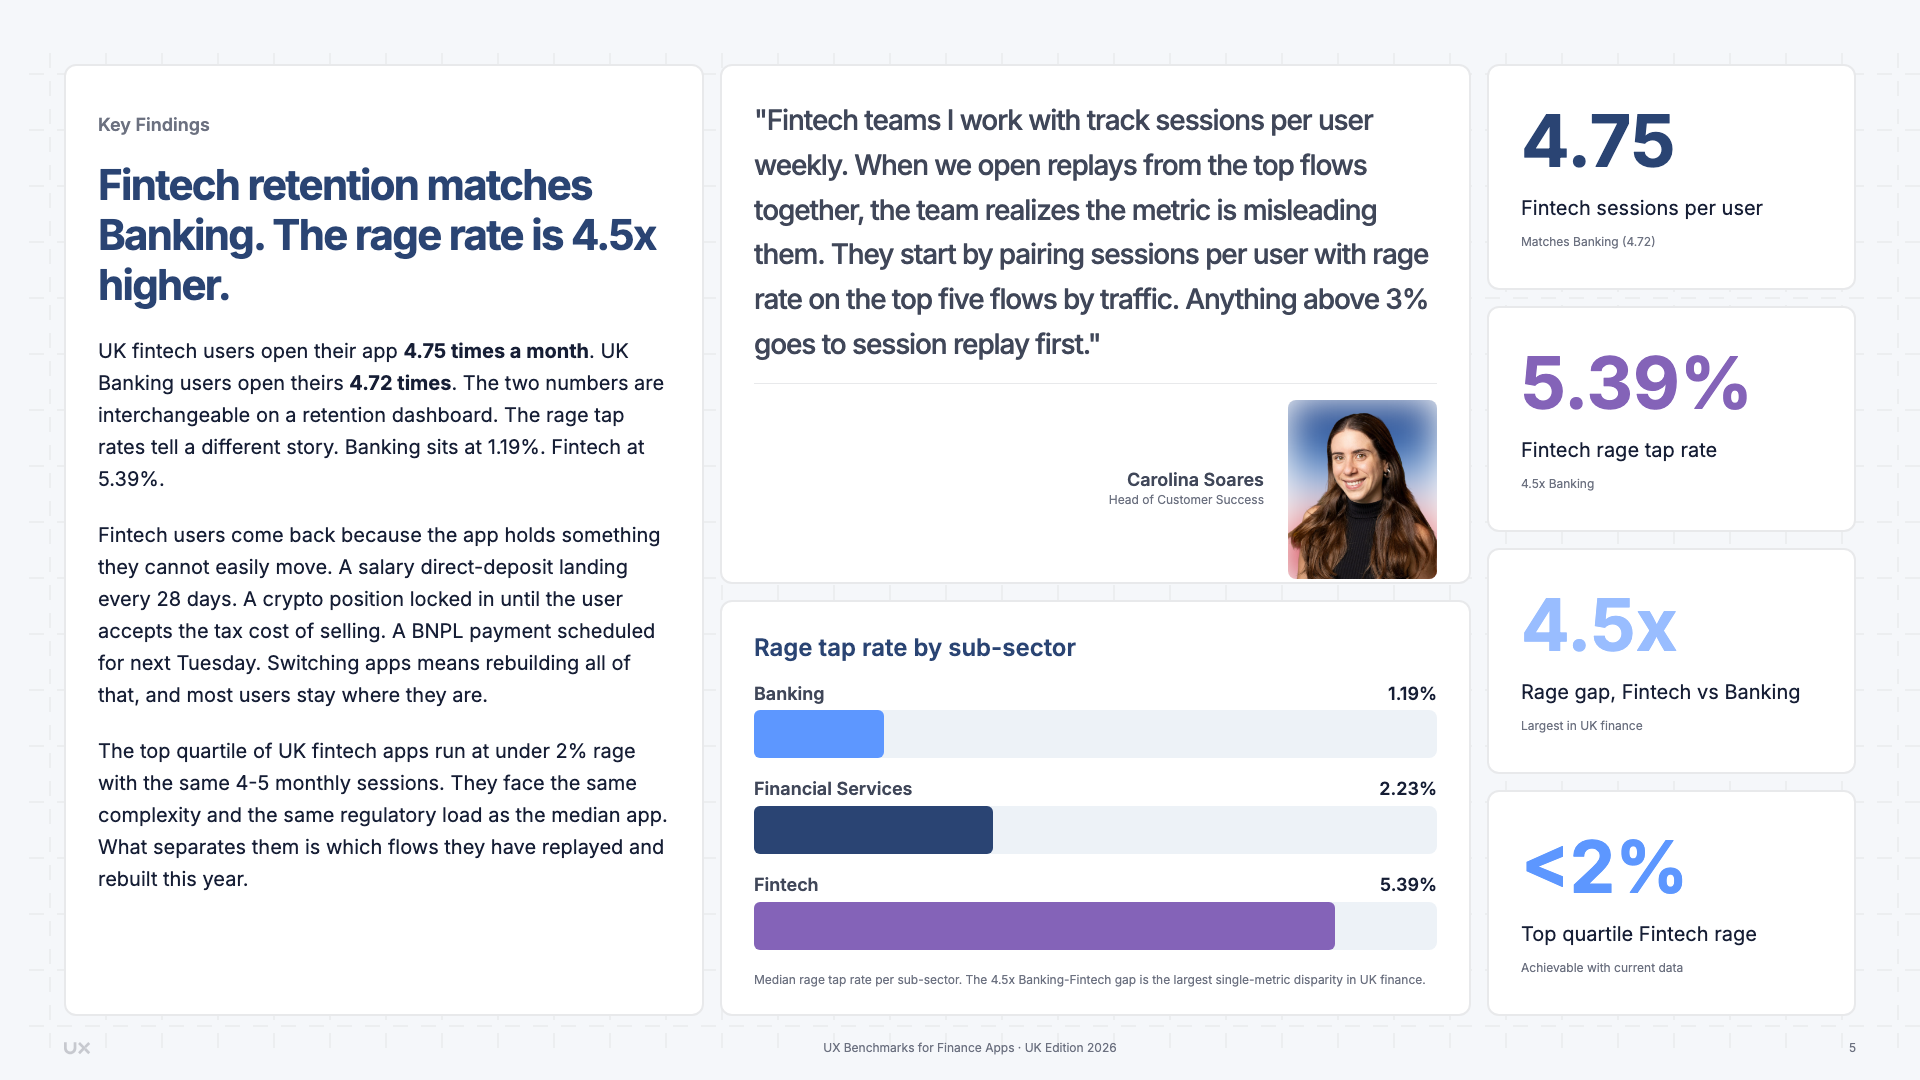
Rage gap4.5x
Banking
Fintech
Rage taps5.39%
Fintech
Banking
Sessions/user
4.00
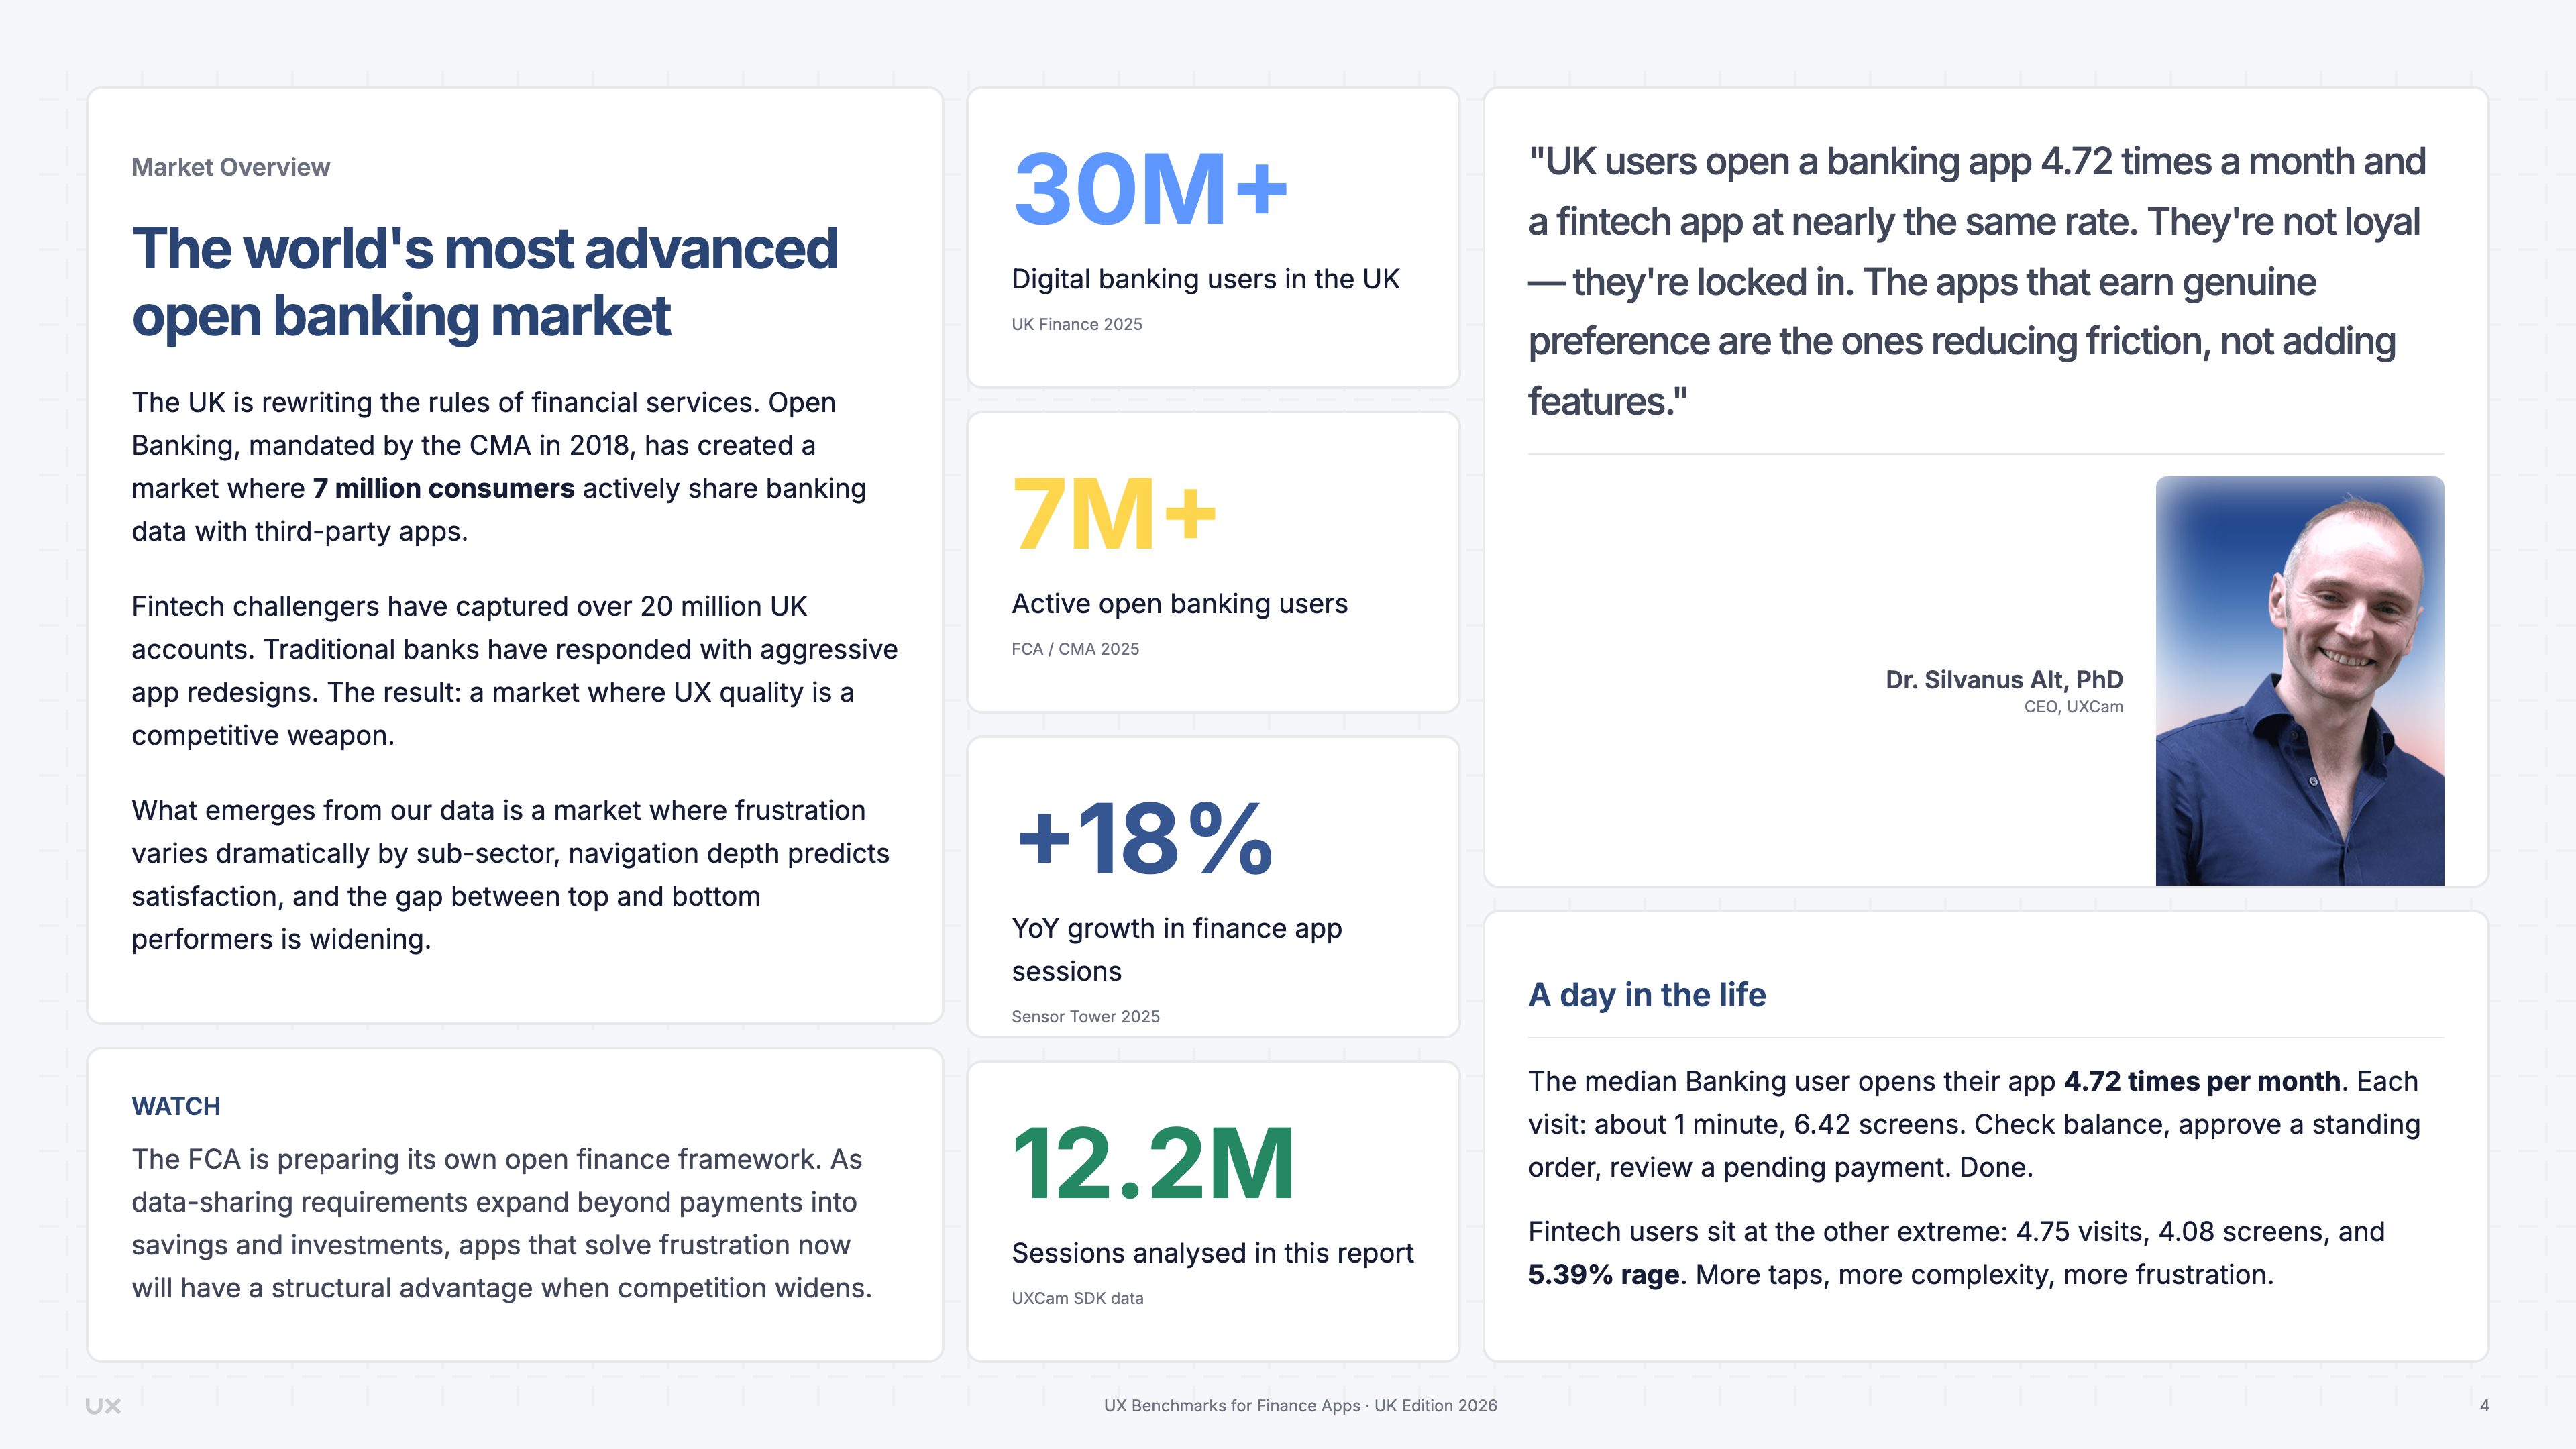
Sessions analysed12.2M
What you'll find inside
We analysed 12.2 million sessions across Banking, Financial Services, and Fintech apps in the United Kingdom over 12 months. The result is the most detailed portrait of mobile finance UX in the UK market, with data that reveals where leaders separate from the rest.
- Fintech retention matches Banking, but rage is 4.5x higher.
- Financial Services has the shallowest flow in UK finance with 87% more rage than Banking.
- Benchmarks for rage, engagement, screens per session, and retention across Banking, Financial Services, and Fintech.
What the experts say

Harry James CoburnHead of Sales
Banking conversations shifted from session-level to screen-level metrics. At six screens per session the aggregate hides everything. Teams measuring per screen find the problem in days, not quarters.
Trusted by product teams worldwide


