Analytics for Product Managers - Go From Data to Insights


Wondering how to use data analytics as a product manager to make product decision?
Not yet sold on data-driven product management?
A recent study from McKinsey found that companies using customer data are 23X more likely to win new customers than their competitors. So, if you’re not using data to inform and drive your product decisions, you could miss out on growth opportunities.
But we understand that diving into data can be overwhelming and intimidating—especially for PMs who may not have a technical background. In this guide, we break down the basics of data-driven product management into an easy-to-follow process.
Why Listen To Us?
Data analytics can feel overwhelming, especially if you’re not especially technical. At UXCam, we’ve helped more than 37,000 product teams with different backgrounds get started with product analytics.
We’ve seen what works and what doesn’t, and we’re excited to share our knowledge with you. By following our process, you can confidently make data-driven decisions that will lead to success for your product.
Helpful Summary
Overview: We explore how product managers (PMs) can use data analytics to optimize their decision-making process.
Why It Matters: Gathering insights into user experience is crucial for enhancing mobile app development.
Action Points: We recommend defining key metrics, collecting and integrating data, analyzing and visualizing this data, conducting user research, and continuously iterating based on insights to improve product and user experience.
Further Research: Check out the UXCam blog for more insights into data-driven development and product analytics.
What is product management data analytics?
Product management data analytics helps you make better, smarter, and more user-centric product decisions. It involves collecting, analyzing, and interpreting data to gain insights into user behavior, preferences, and patterns.
A great example of this process comes from UXCam customer JobNimbus.
The JobNimbus team was struggling with low app store ratings, abysmal adoption rates, and overall negative user feedback. They knew they needed to make changes but didn't know where to start.
They turned to UXCam’s product analytics suite to answer two key questions:
What do our users actually want from our product?
What pain points are causing them to leave negative reviews or not use our product?
Using UXCam's product analytics, they tracked and analyzed user behavior within their app. Tools like season replays, heatmaps, and user journeys allowed them to see how users interacted with their product.


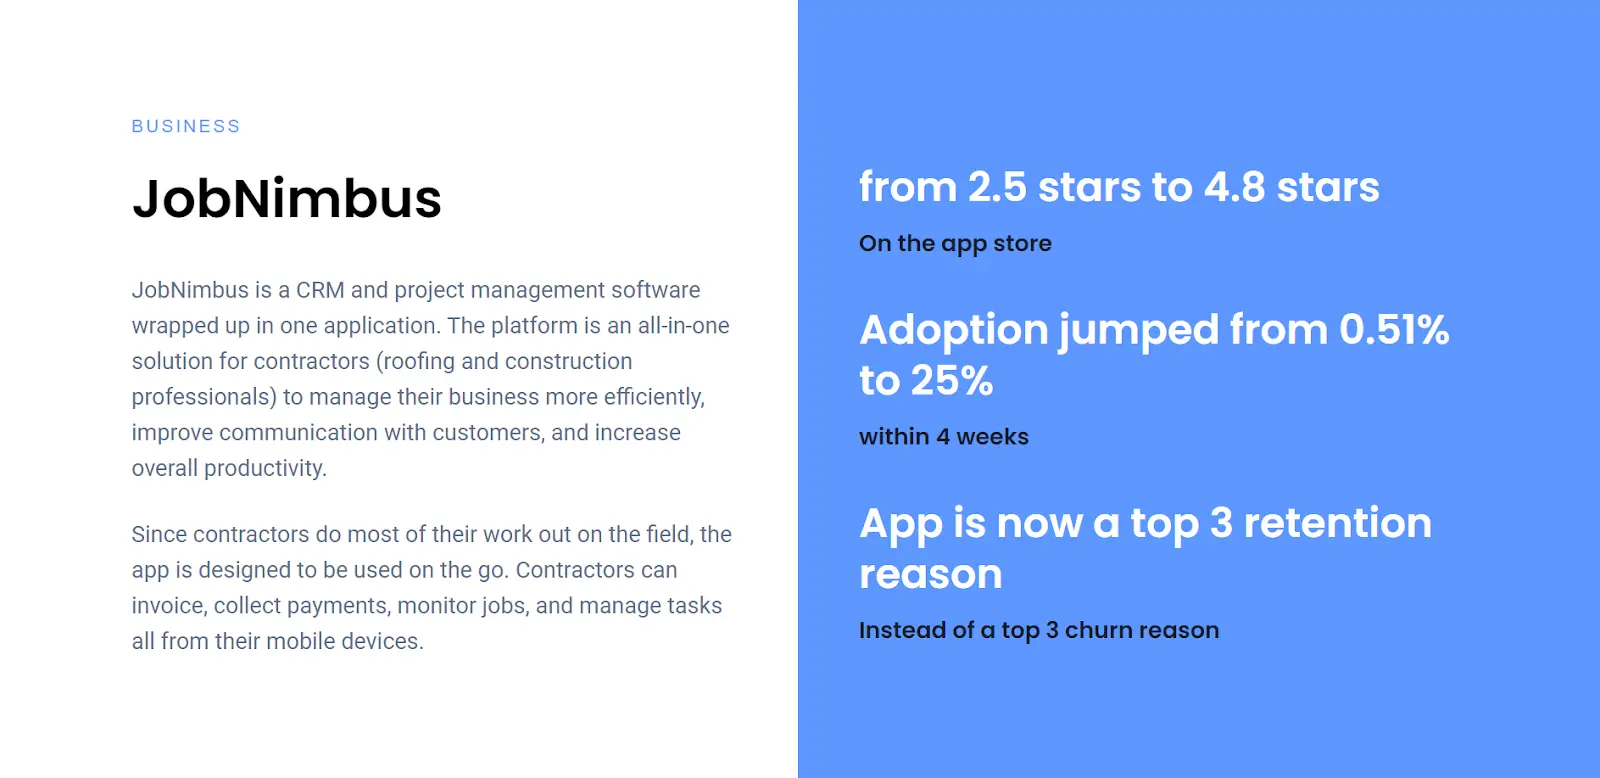
Through data analysis, user testing, and iterative design changes, the JobNimbus team improved their app and increased customer satisfaction. The result was a 2.3-star rating increase on the App Store and a 25% increase in adoption.
Types of data to focus on
Product managers should pay attention to data points that cover four key questions—Who? What? Why? and How?
For example:
Who are our users? Demographics, user segments, and persona behavior patterns.
What are they doing? User actions, feature usage, and user flows.
Why are they doing it? Surveys, user feedback, and user pain points.
How are they doing it? Click heatmaps, session recordings, and A/B testing.
As a product manager or business owner, understanding your customer's needs and preferences is crucial in creating a successful product. This involves identifying pain points that may be causing negative reviews or low adoption rates.
Benefits of data analytics for product managers
Understanding user behavior
By analyzing user data, product managers can gain valuable insights into user behavior, preferences, and pain points. A study by Forrester found that data-driven companies are 58% more likely to beat revenue goals than non-data-driven companies.
Identifying opportunities
Data analytics helps product managers identify new opportunities for product improvement, feature development, and market expansion. According to a survey, 79% of executives agree that companies not embracing big data will lose their competitive position and may face extinction.
Measuring product performance
Product managers can use data analytics to track key performance indicators (KPIs) and measure their products' success. A Mckinsey study found that companies that use data-driven decision-making are 5% more productive and 6% more profitable than their competitors.
How to implement data analytics for product managers
Map metrics to goals
Choose your tools
Build dashboards
Analyze and visualize quantitative data
Contextualize with qualitative data
Iterate and optimize
1. Map metrics to goals
Start by identifying your goals for the product and map out which metrics will help you track progress toward those goals. For example, if your goal is to increase user engagement, you may track metrics like:
Daily active users
Time spent on the product
Retention rate
2. Choose your tools
Next, you need to choose the tools that wil allow you to collect the data you need. THere are all kinds of options out there, including:
Product and user behavior analytics tool (e.g., UXCam)
User feedback tools (e.g., UserTesting)
A/B testing tools (e.g., Optimizely)
Customer relationship management (CRM) software (e.g., HubSpot)
Data visualization and reporting tools (e.g., Tableau)
Make sure you prioritize features and ease of use when selecting your tools.


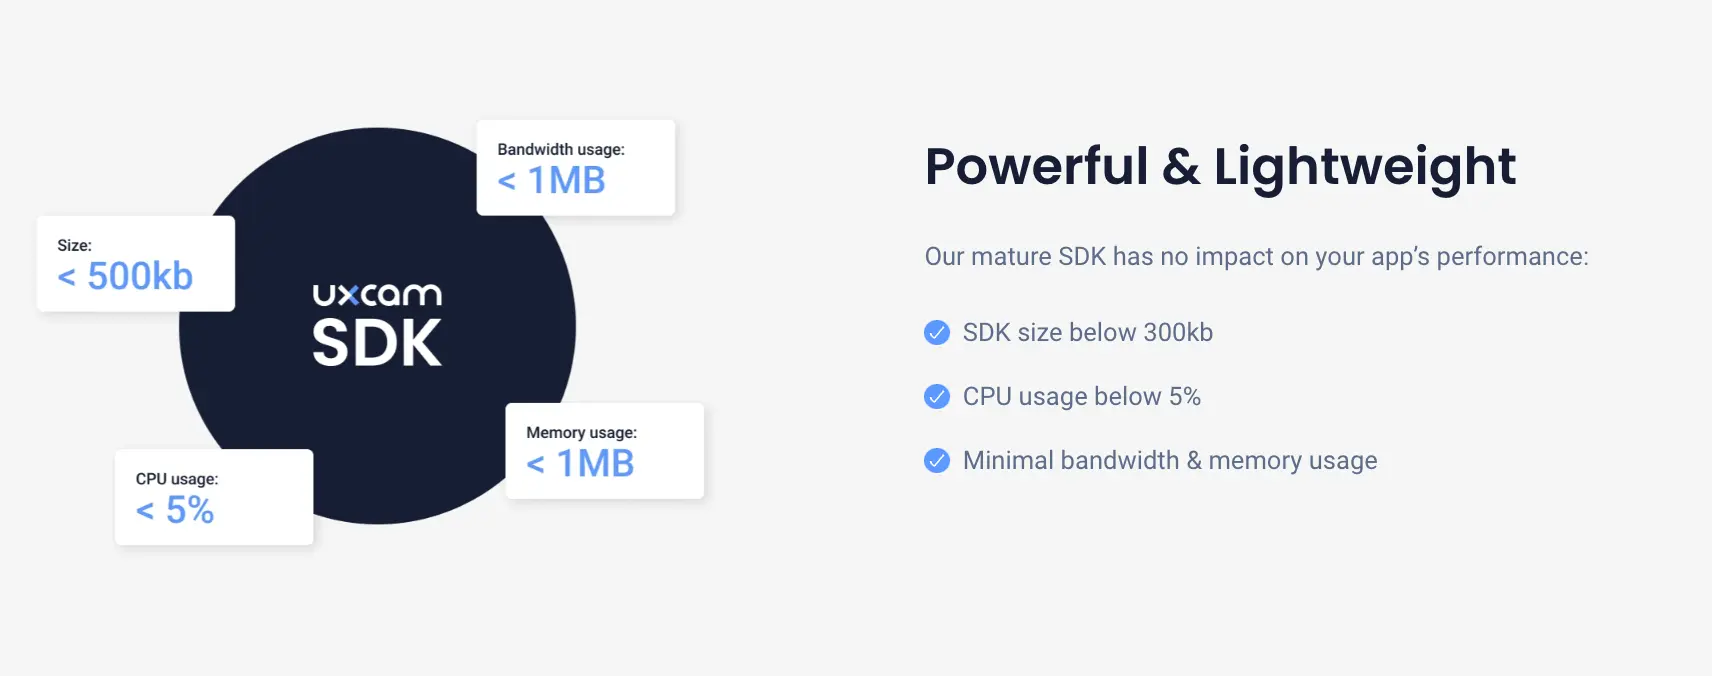
For example, UXCam offers a suite of tools specifically designed to analyze user behavior on digital products. Plus, all it takes to get started is to add a small snippet of code to your website or app. This makes it easy for users to use and for you to gather data on their behavior.
3. Build dashboards
The first thing you should do once you’ve set up tracking is to build a dashboard (or multiple). This will allow you to monitor key metrics and data in real time. Look for tools that offer customizable dashboards so that you can tailor them to your specific needs.


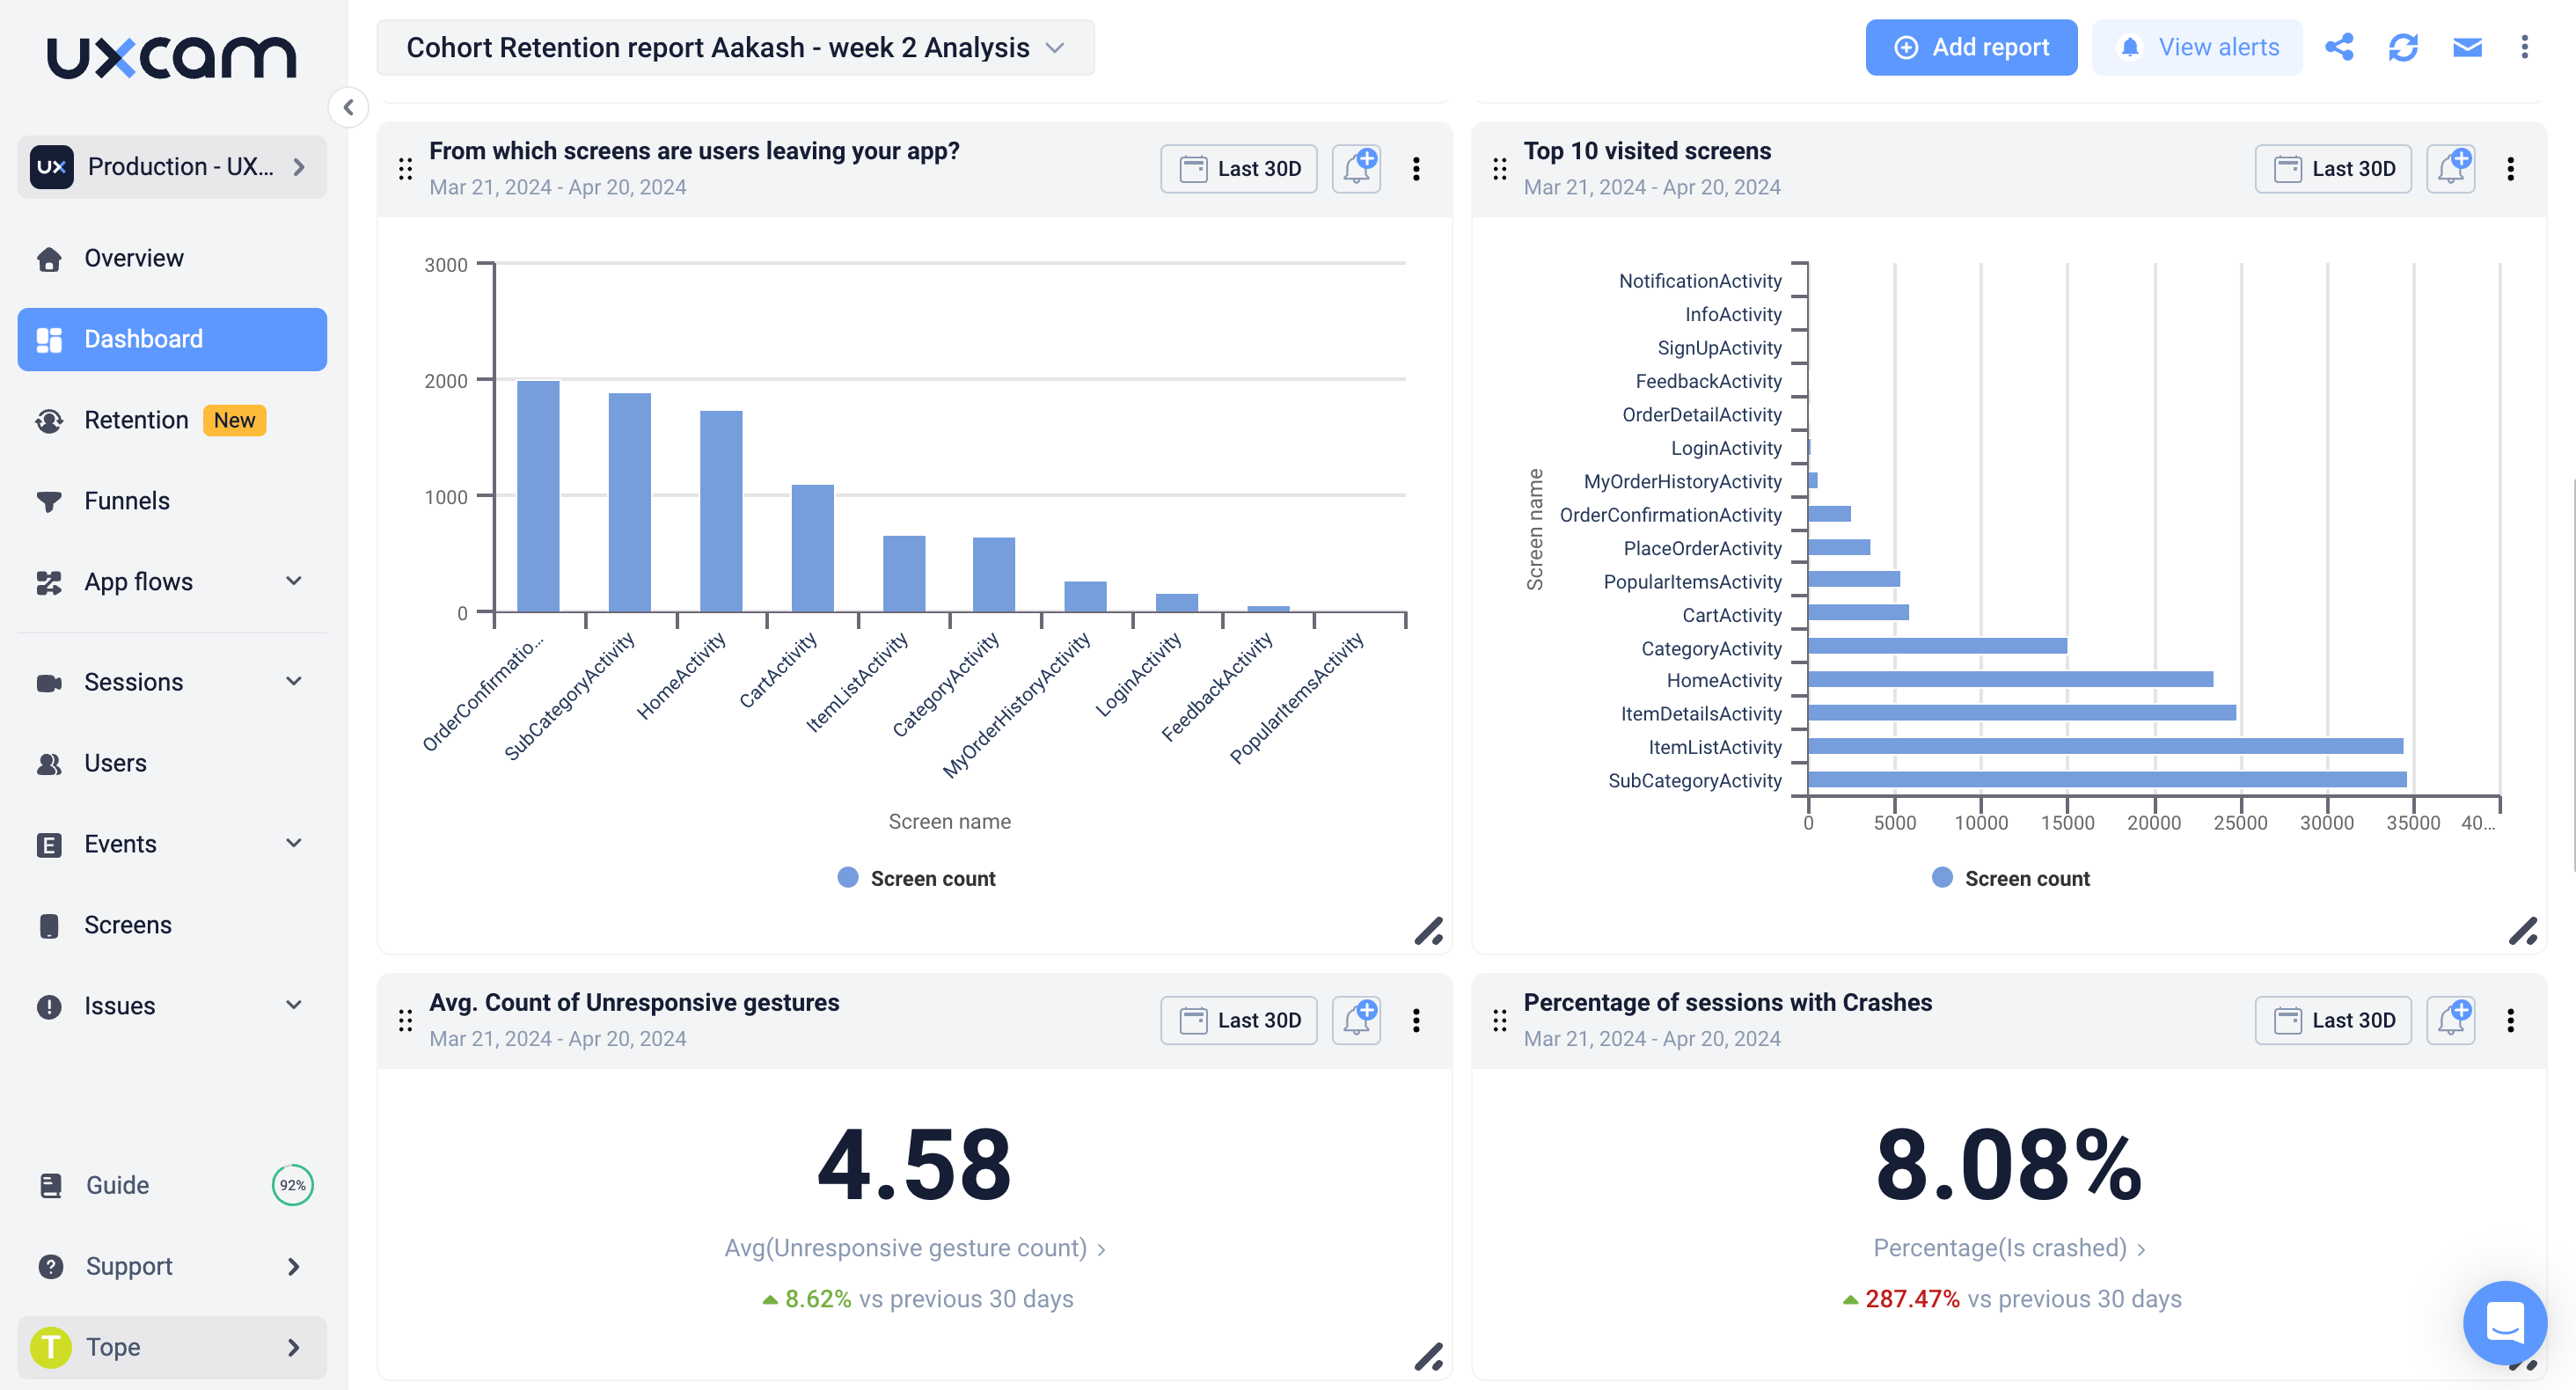
UXCam offers a modular dashboard feature that lets you customize and arrange widgets to display the data that matters most to you. This can include metrics, charts, tables, and more—it all depends on what you want to track and analyze.
4. Analyze and visualize quantitative data
Use data analysis techniques and visualization tools to extract meaningful insights from your collected data. By analyzing and visualizing your data, you can uncover valuable insights that may not be apparent through raw data alone.
UXCam provides powerful visualization features, including:
Heatmaps: See where users are spending the most time on your website or app, and identify areas that may need improvement.


Funnel analyses: Track how users move through your website or app and pinpoint areas where they drop off or encounter difficulties.


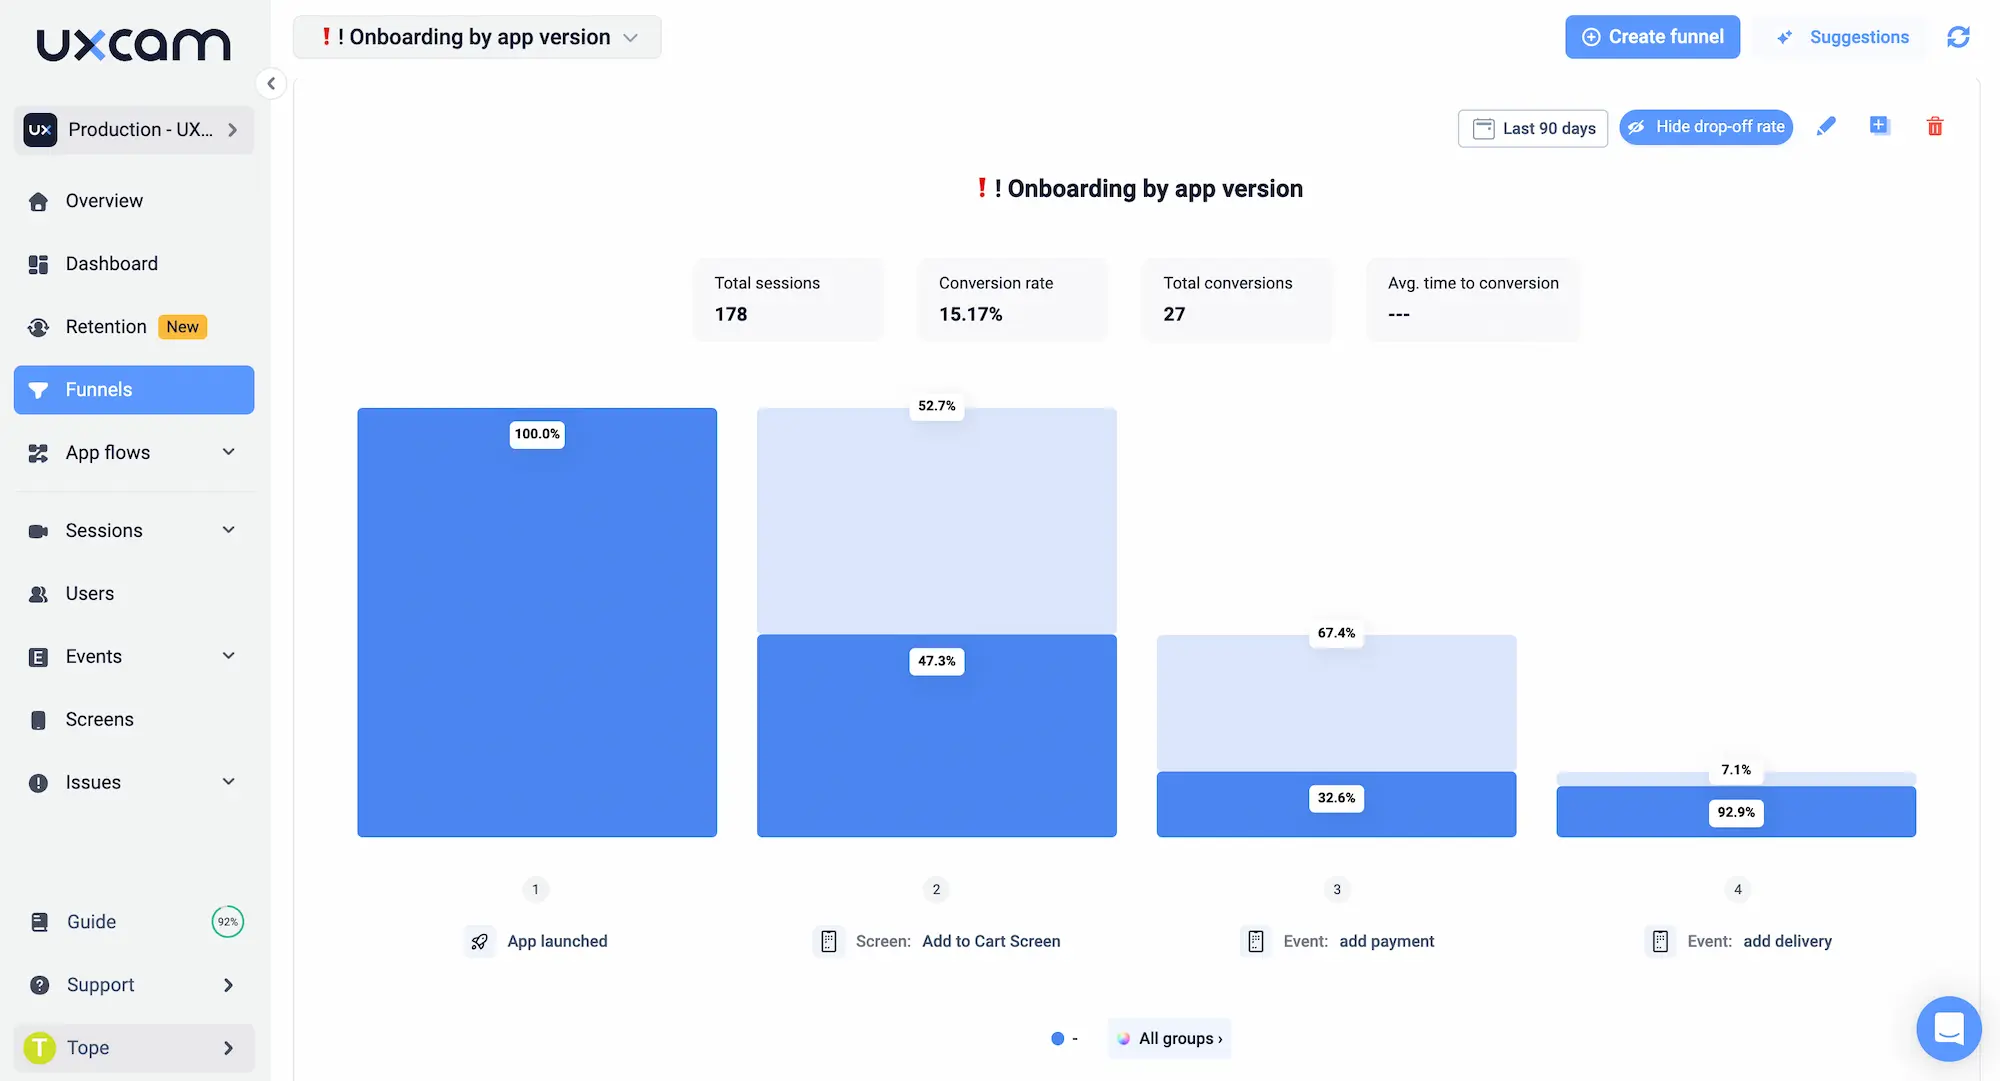
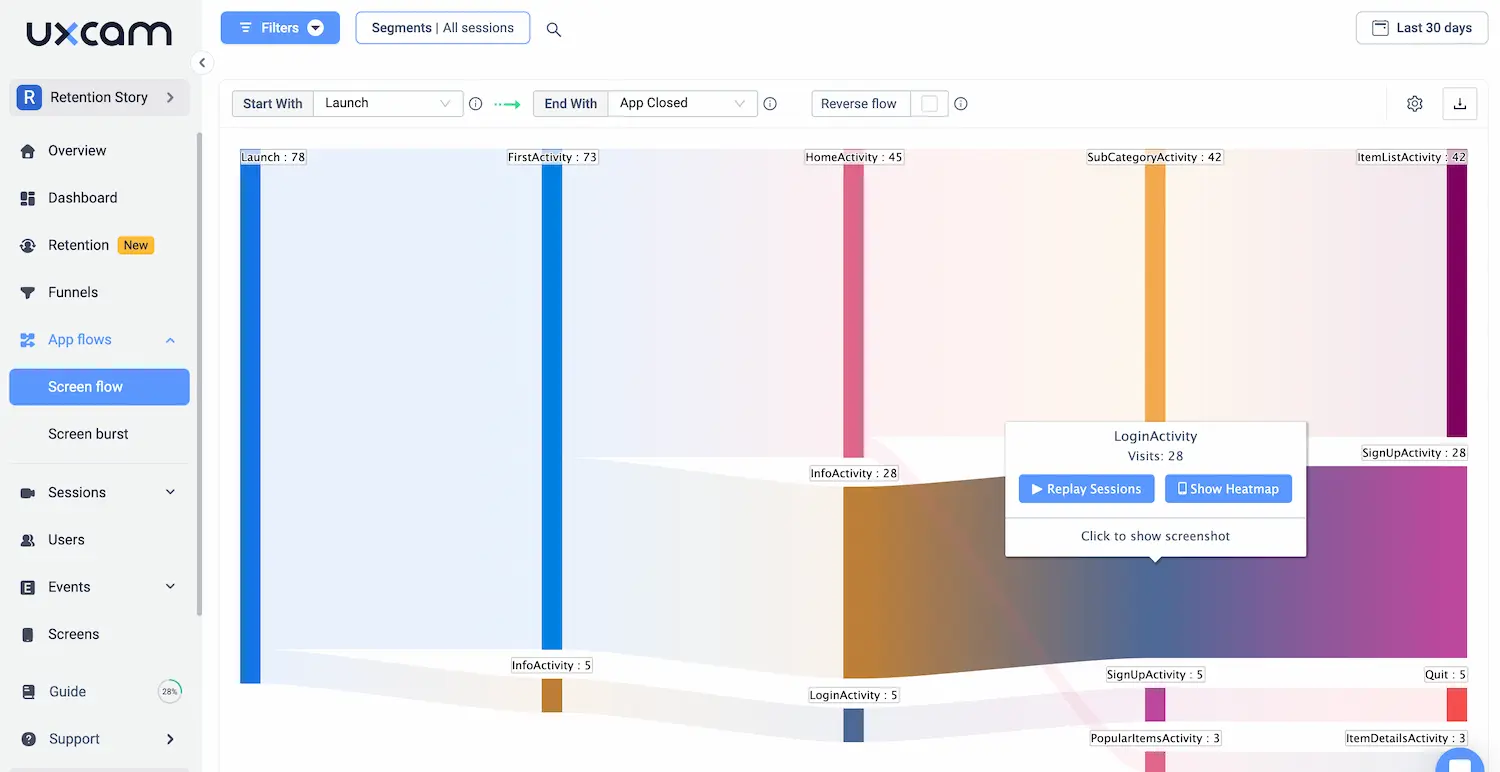
Screen Flow & Burst: Visualize the flow of screens and actions that users take within your app, allowing you to identify patterns and areas for optimization.


With these tools, you can gain a deeper understanding of user behavior and make data-driven decisions to improve the user experience.
4. Contextualize with qualitative data
Quantitative data is important—but you need qualitative data to understand the “why” behind user behavior. When you spot an interesting trend or pattern in the quantitative data, it’s important to contextualize it with qualitative data.
This can take the form of:
Customer surveys
In-app ratings
User testing
Session replays
For example, one of our customers (Recora) was struggling with a high number of mysterious customer support tickets. This was a worrying trend quantitative data trend that they struggled to answer until they took advantage of UXCam’s session replays.


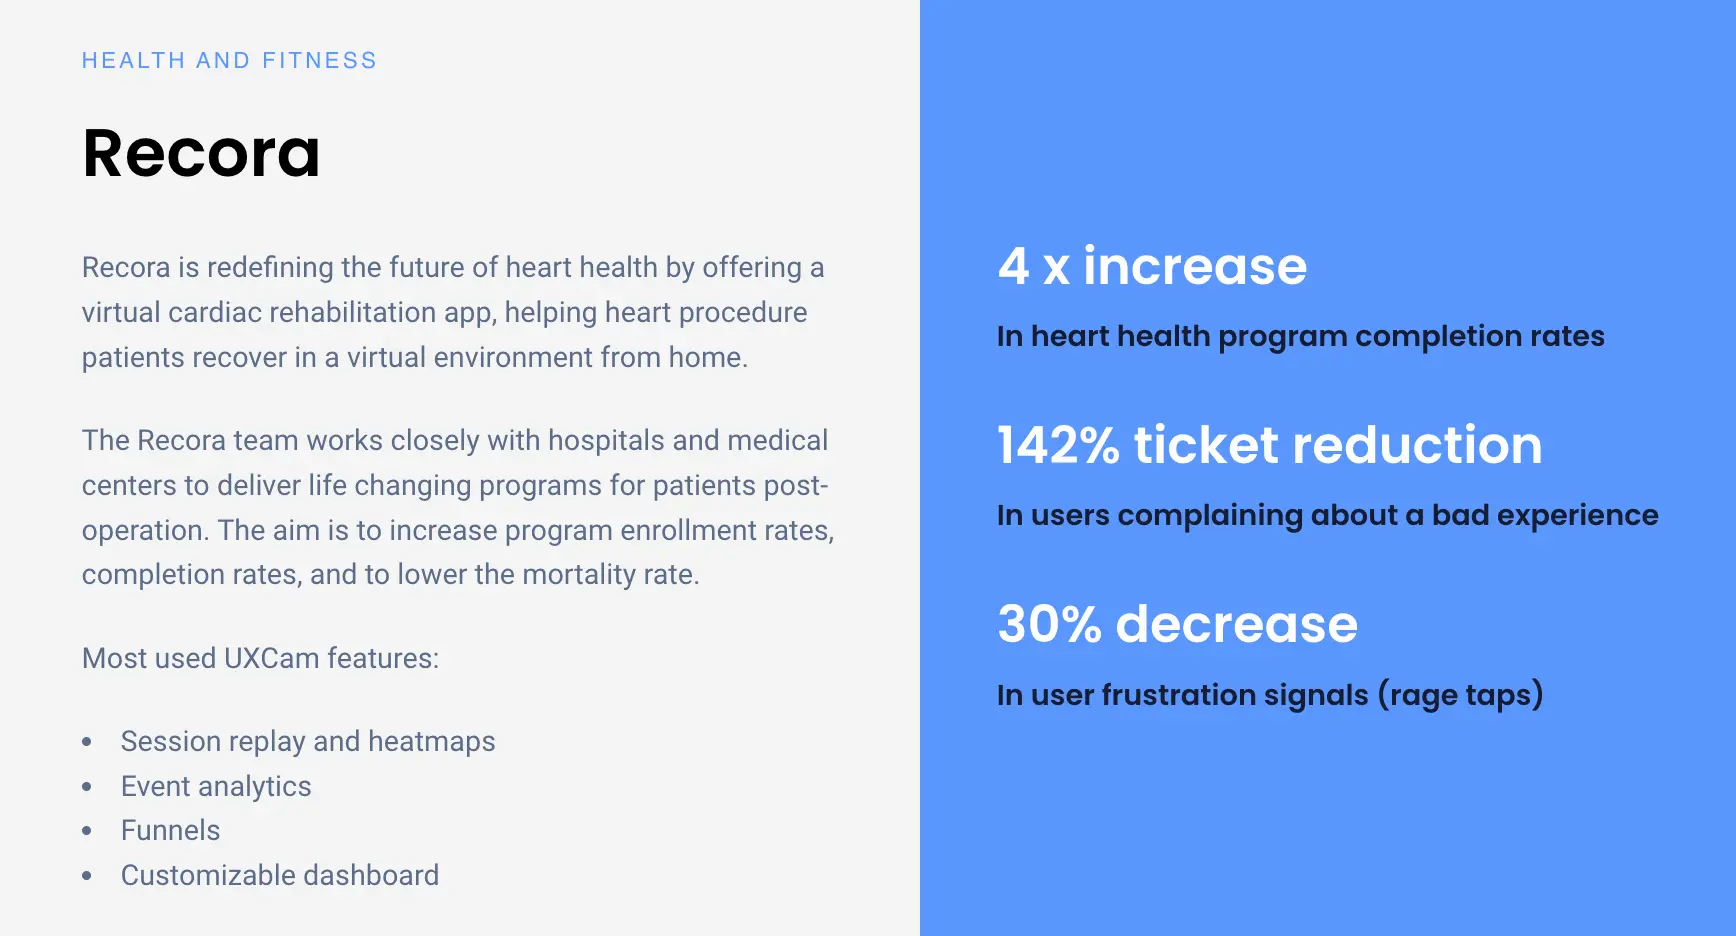
They eventually figured out that users were pressing and holding a button that was only meant to be tapped. When this didn’t produce the desired result, they repeatedly tapped the button, leading to errors and frustration.
Adding this functionality cut support tickets by 142%.
5. Iterate and optimize
Continuously monitor your metrics and analyze data. Data analytics is an ongoing process. By regularly monitoring your metrics and making data-informed decisions, you can continuously improve your product and user experience.
Conclusion
Data analytics is a vital tool for product managers seeking to navigate the complexities of today's business landscape. The insights gained from data analysis empower product managers to make informed decisions, improve products, and enhance user experiences.
At UXCam, we recognize the pivotal role of data analytics in product management success. Our platform’s robust analytics tools streamline this process, enabling product managers to make data-driven decisions with confidence and agility.
You might also be interested in these;
Top 19 Mobile App Analytics Tools in 2024
Product usage analytics - Examples and how to set it up
Event-based analytics - What it is and how to set it up
Product analytics framework - Examples and how to use them
AUTHOR
Tope Longe
Product Analytics Expert
Ardent technophile exploring the world of mobile app product management at UXCam.


Related articles


Mobile app analytics
12 Mobile App Analytics Metrics That Actually Matter in 2026
Mobile app analytics metrics are the quantitative signals product teams use to measure performance, engagement, and...


Silvanus Alt, PhD
Founder & CEO | UXCam


Mobile app analytics
Mobile App Retention Benchmarks by Industry (2026)
Mobile app retention benchmarks for 2026, broken down by industry. Day-1, day-7, day-30 retention rates for fintech, ecommerce, social, gaming, and more,...
Silvanus Alt, PhD
Founder & CEO | UXCam


Mobile app analytics
Sentry vs Datadog: Features, Pricing, and Which One Fits Your Production Stack
Sentry vs Datadog compared head-to-head on features, pricing, and the production stacks each one...
Silvanus Alt, PhD
Founder & CEO | UXCam