Product Usage Analytics - Definition, Guide & Implementation


Looking to enhance your understanding of how customers interact with your product using real usage data?
Knowing how users use your product is super important today—and product usage analytics is your main tool for gaining those insights.
User experience is a crucial factor in the success of any mobile app. It can be the difference between a thriving product and one that fails to gain traction. As such, it is essential for businesses to gather insights into user experience and make data-driven decisions for their products.
Not sure where to start? In this guide, we explain how to use product usage analytics to grow your business and make users happier, all while boosting your bottom line.
Why listen to us?
At UXCam, we’ve helped more than 37,000 mobile product teams implement accurate, effective, and efficient product usage analytics. Our customers have seen a significant increase in user retention and overall app satisfaction.
Just look at Housing.com.
Thanks to UXCam’s suite of product analytics tools, the team was able to design an app that users love to use. The result was a 20% increase in feature adoption and more than 5 million installs on Google Play.
Summary - How to measure the usage of a product
| Steps | Details |
|---|---|
| Define goals | Set objectives like engagement, churn reduction, or satisfaction improvement. |
| Track key metrics | Focus on DAU, MAU, retention, churn, session duration, and feature adoption. |
| Use Analytics Tools | Use UXCam for session recordings, heatmaps, and user behavior insights. |
| Collect qualitative data | Use session recordings, surveys, interviews, user testing, and feedback forms for insights. |
| Segment users | Analyze by demographics, user type, or behavior patterns. |
| Monitor trends over time | Track metrics regularly to spot seasonal changes or feature impacts. |
| Benchmark against goals | Compare data to goals or industry standards for performance evaluation. |
| Act on insights | Improve features, address pain points, personalize experiences, innovate. |
What are product usage analytics?
Product Usage Analytics is the process of collecting, analyzing, and interpreting data on how users interact with a product. It helps businesses understand user behavior, feature adoption, engagement patterns, and pain points to improve the product experience and drive decision-making.
Product usage analytics tracks and analyzes how (and how much) users use a digital product.
A simple example? Let’s say you want to understand how users interact with your app’s features. Product usage analytics lets you calculate the percentage of time users spend interacting with each feature to see which are the most popular.
That’s just the beginning, though. Product usage analytics can track all kinds of things, such as user flows, session length, and crash reports. This helps identify areas for improvement and allows for data-driven decisions in product development.
At the center of it all is the tool you use to collect and analyze this data. Take UXCam, for example.


Our mobile-only analytics platform gives you countless ways to track and analyze user behavior. From screen recordings and heatmaps to funnels and retention analysis, UXCam provides a comprehensive view of how users interact with your app.
Examples of Product Usage Analytics Metrics
Product usage analytics encompasses a wide range of metrics and data points that help companies understand how their products are being used. Here are some key examples of product usage analytics:
Active Users: This metric tracks the number of users who engage with the product over a specific period, such as daily active users (DAU) or monthly active users (MAU). It helps measure user engagement and the overall stickiness of the product.
User Engagement Metrics: These include metrics like session length, frequency of use, and page views per session. They help determine how deeply and how often users are interacting with the product.
Feature Usage: Analysis of which features are most and least used within a product. This can help teams decide where to allocate development resources and which features may need redesigning or better user education.
Conversion Rates: Tracking how many users complete desired actions, such as signing up, upgrading to a paid plan, or successfully completing a process. This helps measure the effectiveness of the product in achieving its business goals.
Retention Rates: Measures how many users return to the product after their initial use. This is crucial for understanding long-term user satisfaction and loyalty.
Churn Rate: The rate at which users stop using the product. Analyzing churn can provide insights into potential issues with the product that may be causing users to leave.
Customer Journey Mapping: Analyzing the paths users take within the product and identifying common drop-off points or friction areas. This can guide improvements in user flow and interface design.
Segmentation Analysis: Breaking down user data by specific segments such as demographics, user behavior, or customer type. This allows for more targeted and effective product enhancements.
Heat Maps and Gesture Tracking: Visual tools that show where users tap, scroll, swipe and spend time on a page. These insights can help improve user interface design.
Benefits of product usage analytics
Enhanced customer experience: Analytics provide insights into how users engage with a product, highlighting areas for improvement to create a more satisfying and engaging user experience. Studies have shown that 59% of customers with a bad experience will never return to a business.
Driving product development: Usage analytics provide valuable insights into which features to prioritize, helping companies make data-driven decisions. A McKinsey study revealed that companies extensively using customer analytics are more likely to outperform competitors on key performance metrics.
Increasing revenue: Product usage analytics can help companies identify upselling, cross-selling, and targeted marketing opportunities. According to a report by Nucleus Research, analytics can provide an average return of $13.01 for every dollar spent.
How to implement product usage analytics
Define your goals and metrics
Integrate an analytics tool
Build a product usage dashboard
Collect enough data
Identify usage patterns and insights
Make data-driven decisions
1. Define your goals and metrics
Start by pinning down your “why”—why do you want to track usage analytics and what specific metrics will help you achieve your goals? You’re trying to identify a goal and a collection of metrics to help you tell whether you’re progressing toward that goal.
For example, say your goal is to increase user engagement with your product. In this case, some relevant metrics might include:
DAU and MAU
Session length
Retention rate
Feature adoption rate
You can set targets for these metrics and track them over time to see how your product is performing.
2. Integrate an analytics tool
Next, you’ll need to integrate a tool to help you collect and analyze usage data. There are plenty of tools available on the market, so it’s important to do your research and choose one that best fits your needs and budget.
Looking for a mobile-first solution?


UXCam is designed to give mobile product teams high-level and granular insights into user (and usage) behavior. We offer all kinds of features—from session replays and heatmaps to event tracking, issue analytics, and segmentation—that can be set up instantly by installing our lightweight SDK.
But more about what we do in a minute.
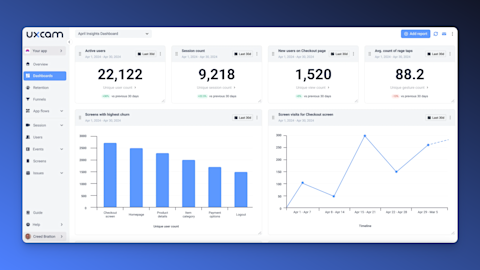
3. Build a product usage dashboard
The first thing you should do when you’ve integrated a tool is to build a product usage dashboard.
This is where you (and anyone else who needs access to usage data) will get at-a-glance insights into key usage metrics. So, take a minute to build a dashboard that covers the metrics and KPIs you outlined earlier.
With UXCam’s modular dashboards, this is simple.


Just search for a report (e.g., “number of users who added a payment method”) and add it to your dashboard. If we don’t have a pre-existing report in our library, you can easily create one from scratch.
Any dashboards you create can be shared, locked, and edited by anyone on your team. This allows for collaboration and ensures everyone can access the most up-to-date usage data.
4. Collect enough data
As users engage with your product, the analytics tool will continuously collect and store relevant data points based on the tracked user actions and events.
For example, UXCam’s tagless autocapture automatically captures and stores all user interactions, including clicks, swipes, and form inputs. Once you decide what to focus on, this data can be visualized and analyzed retrospectively.
So, there’s no rush—wait until you’ve collected enough data.
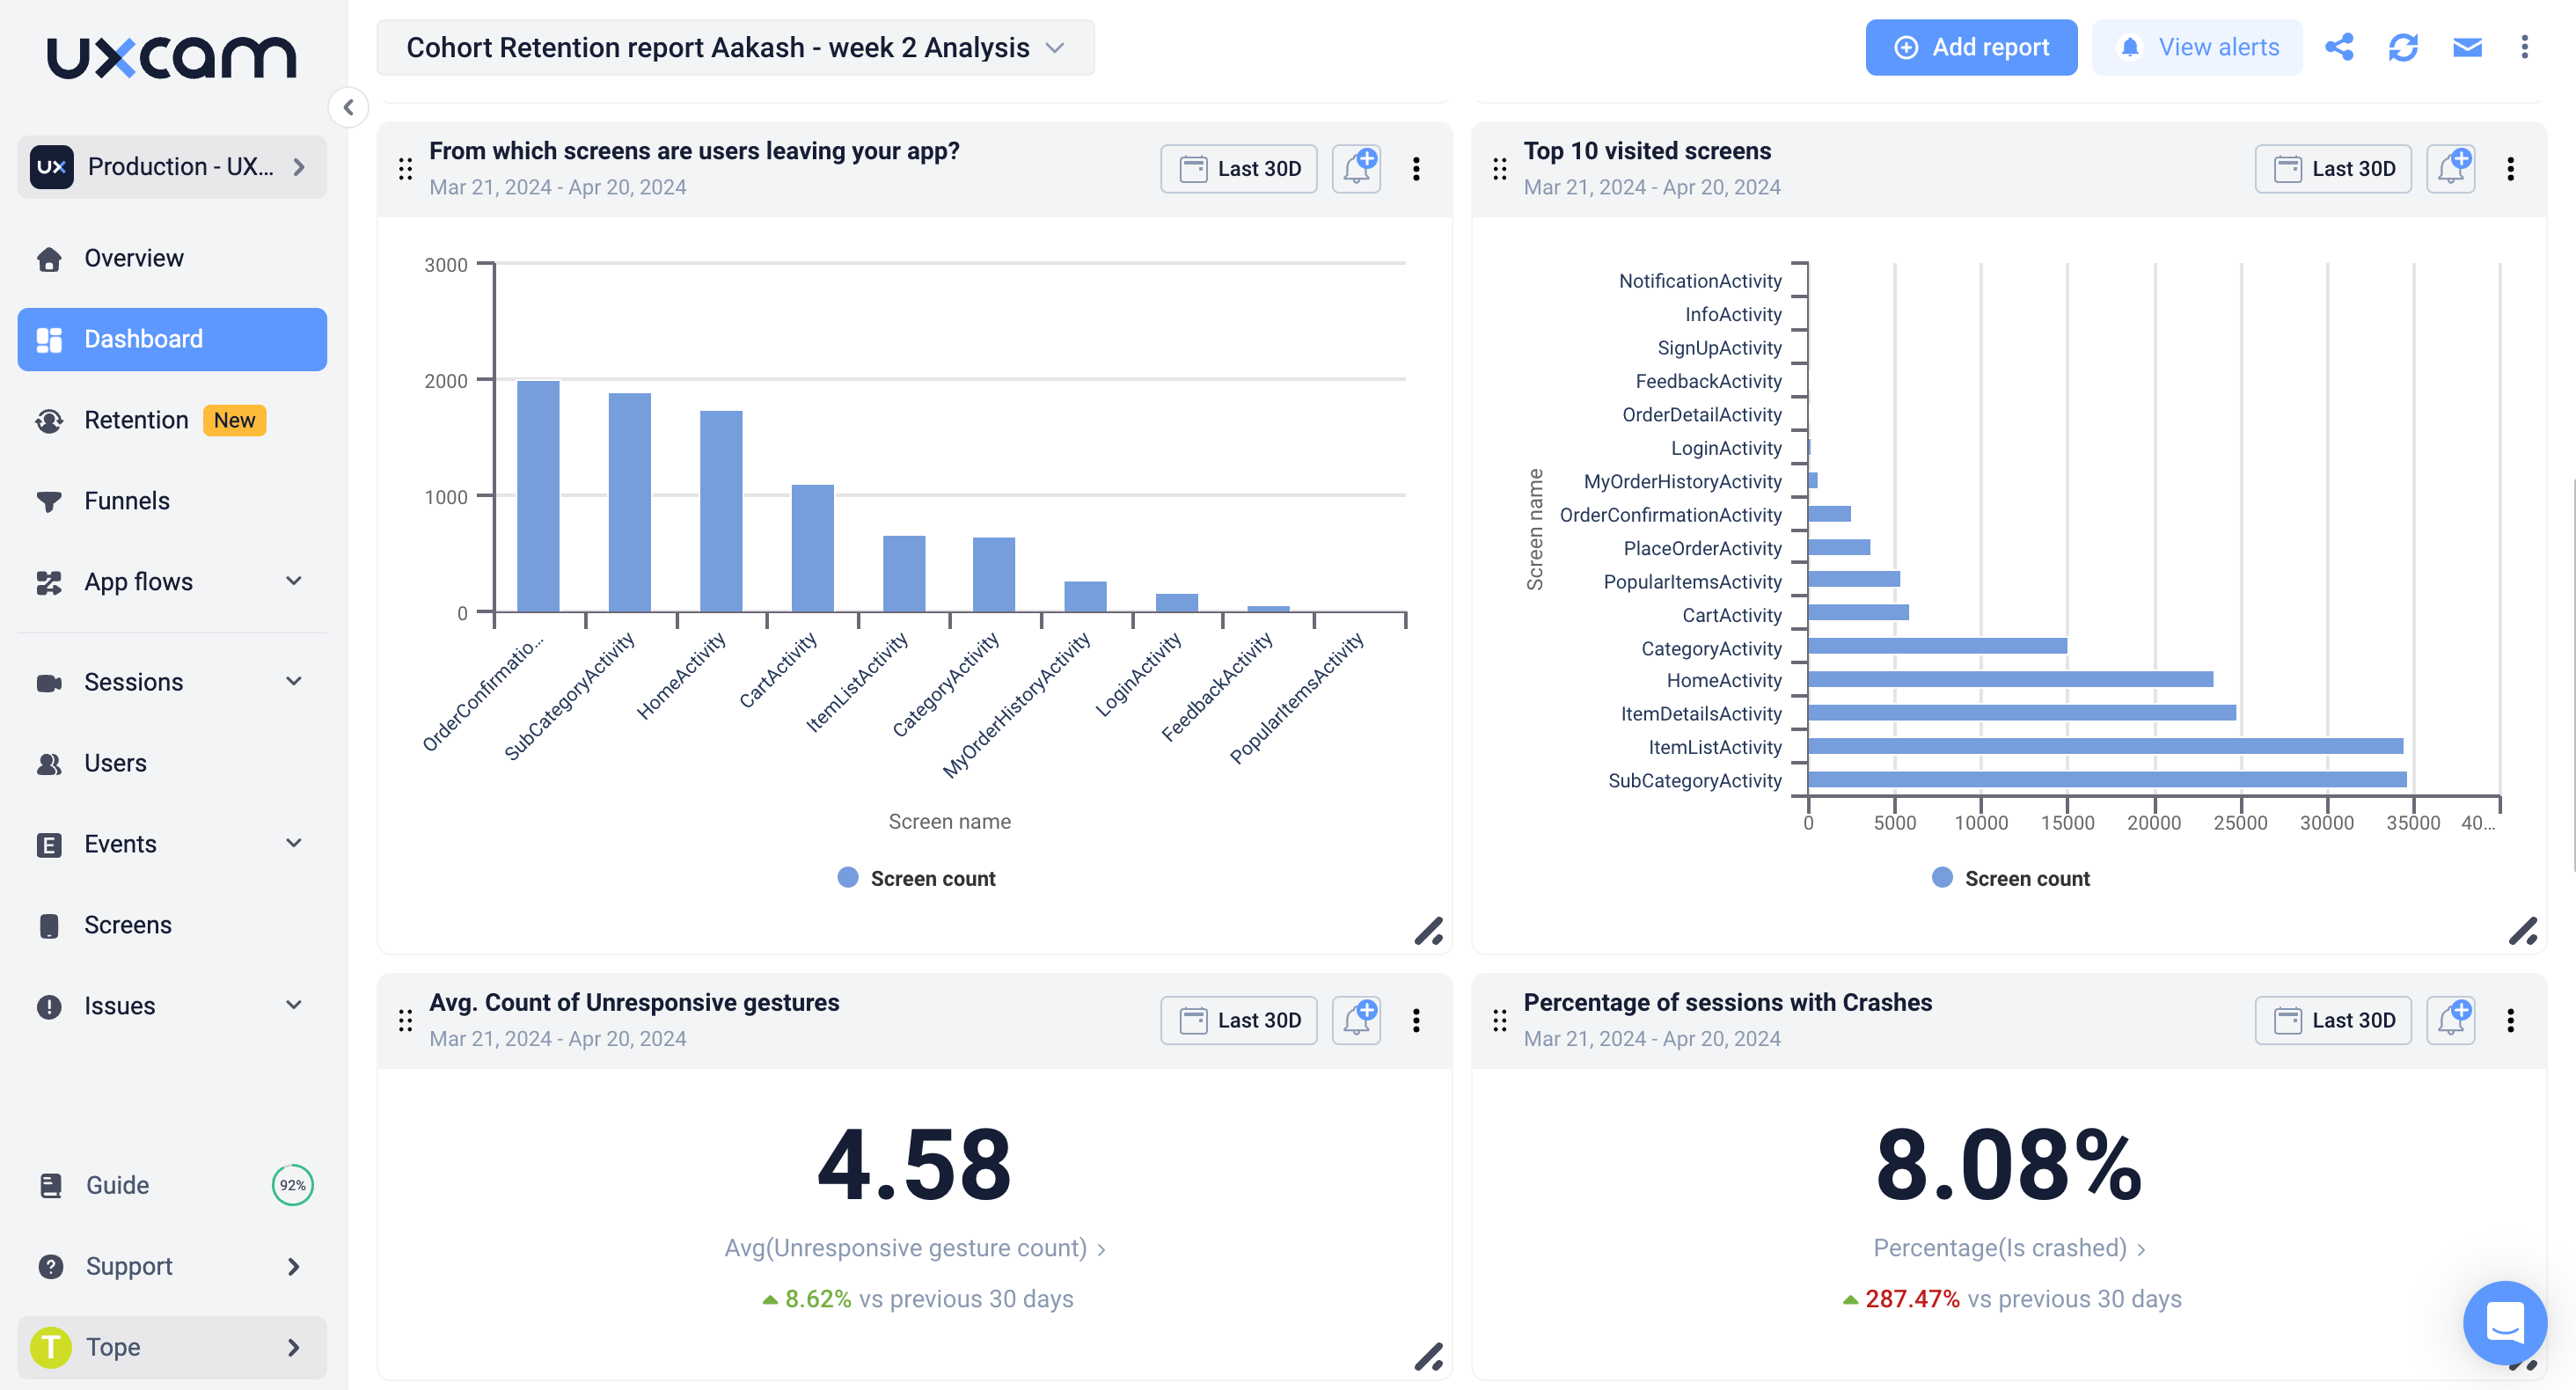
5. Identify usage patterns and insights
Alright, you’ve collected a substantial amount of data. Now, it’s time to analyze it.
Start by looking for patterns and trends in the data. Are there certain features or areas of your product that are used more frequently? Are there any specific actions that lead to higher engagement or conversions?


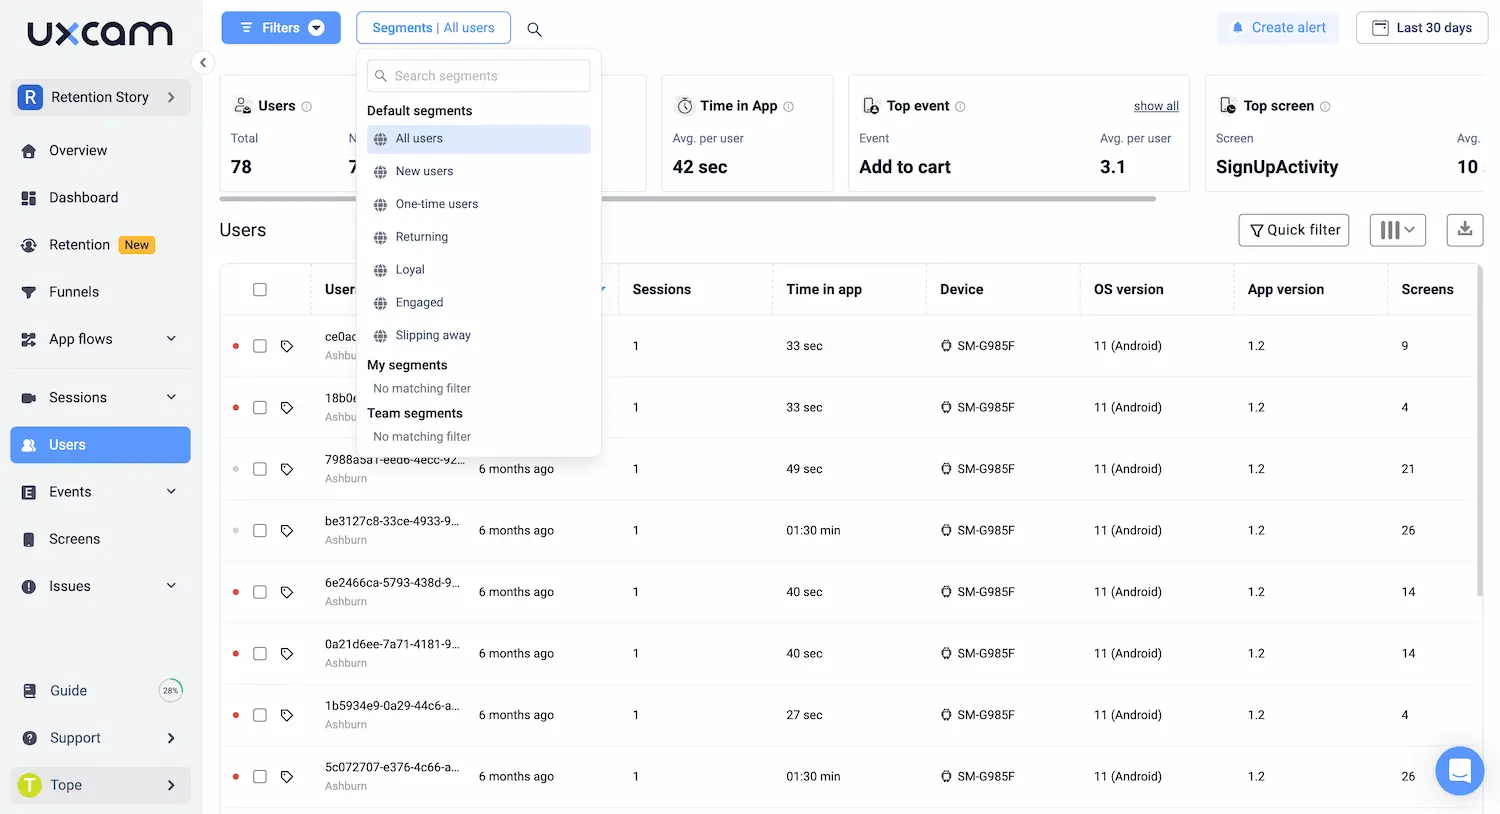
Segmentation is your friend here. For example, you can use UXCam’s segmentation tools to group users by positive or negative outcomes (e.g., “made a purchase in the first session”), or by demographics (e.g., “aged 18-24”).


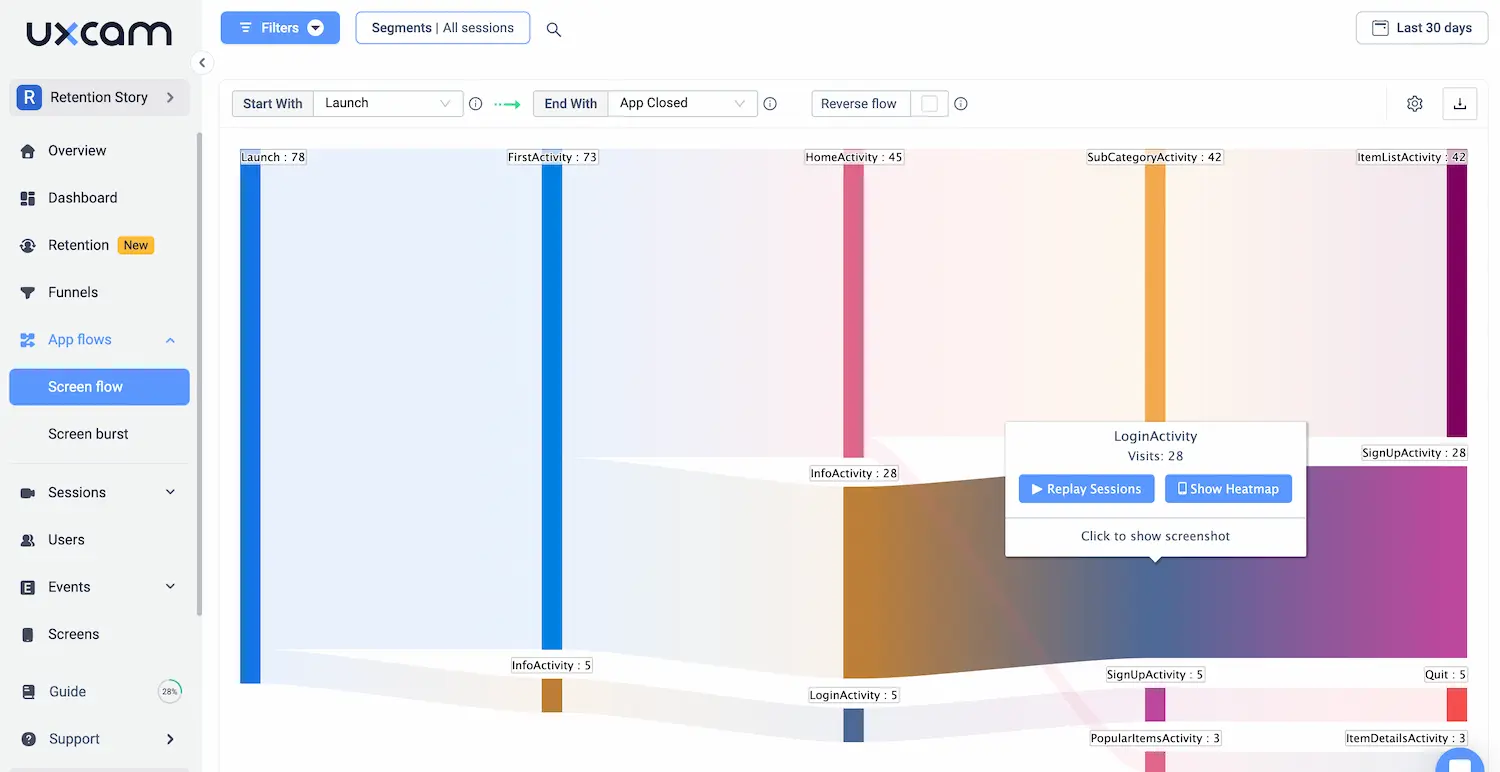
You can then apply these segments to any other analytics tool to figure out why. For example, you might use our screen flow feature to compare the paths of positive and negative outcome segments to see what actions they took or screens they visited that led to different outcomes.
6. Make data-driven decisions
The goal of product usage analytics is to guide development. In other words, it’s all about using data to inform your decision-making process.
How do you do this? Product experimentation.
This process starts with a hypothesis—“If we add XYZ feature, users will spend more time on our app.” This hypothesis is formed by looking at patterns you identified earlier. Then, you can design an experiment to test this hypothesis.
This could involve:
A/B testing: Testing two versions of a feature or design to see which performs better.
Multivariate testing: Testing multiple variations of a feature or design to see which combination works best.
Segmentation analysis: Analyzing data from different segments of users (based on behavior, demographics, etc.) to see how they respond differently to changes.
You can then make informed decisions about implementing the feature based on the results.
Conclusion
Understanding how users use your product is very important for success.
At UXCam, we know how important product usage analytics are for mobile app success. Our platform helps businesses track user actions, analyze behavior, and gain useful insights to improve the user experience.
By collecting and analyzing real-time data, companies can make smart decisions, focus on developing important features, and keep improving to meet user needs and business goals.
You might also be interested in these;
What is Product Analytics? Guide, Tools & Best Practices
Top 14 SaaS Product Usage Metrics and How to Improve Them
Value Metrics - How to Find, Measure and Apply Yours
5 Important Product Health Metrics and How to Track Them
5 Best Hotjar alternatives for product teams
5 Product Engagement Metrics & How To Track Them Effectively
Mouseflow vs Smartlook - Compare Features & Best Alternative
AUTHOR
Tope Longe
Product Analytics Expert
Ardent technophile exploring the world of mobile app product management at UXCam.


Related articles


Product best practices
Why creating a data-driven culture has less to do with data than you think
Kishan Gupta, CEO, shares 5 tips and techniques for fostering a data-driven culture based on his own experiences building and leading...


Kishan Gupta
Co-Founder of UXCam


Product Management
How to Increase Mobile App Retention: Ultimate Guide
Are you looking to improve your customer retention rate? Sticky apps have characteristics that create a sense of inclusiveness for your users, bringing them back more...


Anurag Vuthunuri


Product Management
12 Best Free Product Management Courses in 2026
The free PM course landscape in 2026 is dramatically better than it was three years ago. Top MBA programs offer audited versions on...


Silvanus Alt, PhD
Founder & CEO | UXCam