5 Product Engagement Metrics & How To Track Them Effectively


Looking for guidance on tracking product engagement metrics?
Evaluating how users engage with your product is crucial for success—and product engagement metrics help you do just that.
These metrics offer valuable insights into how users engage with your product, revealing its stickiness level, value, and usability. Product and behavioral analytics tools are pivotal in monitoring and identifying opportunities to boost retention and conversion rates, leading to app success.
In this article, we delves into essential product engagement metrics for mobile apps. We’ll also cover how leveraging our cutting-edge analytics features helps you efficiently track, analyze, and action these metrics to optimize your app performance.
Let’s dive in.
Helpful summary
Overview: This article discusses key product engagement metrics and explains how mobile product teams use UXCam to track and analyze them.
Why you can trust us: We have supported more than 37,000 product teams worldwide in gaining a comprehensive understanding of product engagement metrics through features like session replay, heatmaps, and journey analysis.
Why this is important: Knowing about product engagement metrics and how to collect the data to measure them will help you find, understand, and address usability issues to reduce churn through empathic UX.
Action points: Utilize our session replay and heatmaps for an empathic understanding of user behavior and identify friction points within the app that are detrimental to engagement.
Further research: Read our guides on product engagement and mobile app engagement benchmarks for more info.
Why listen to us?
UXCam is a powerful analytics tool for mobile app teams prioritizing UX and CX. We’ve transformed in-app user activity into visual data, making it easier for global brands like Costa Coffee, JobNimbus, PlaceMakers, and more to analyze product engagement and optimize their apps’ performance.
What are product engagement metrics?
Product engagement metrics are key indicators that help product teams understand how users interact with a digital product. They provide insights into user behavior, app performance, and overall user satisfaction.
5 key product engagement metrics
1. Product stickiness
The product stickiness metric tells you about the rate at which your users return to your app regularly. It points out how likely users are to return to your product because they find it engaging and valuable.
How to calculate:
Product stickiness = (Daily active users/monthly active users) x 100
2. Conversion rate
The conversion rate tells you how engaging your app is by showing the percentage of users who complete a specific action, like making a purchase or signing up, out of the total number of app visitors.
A higher conversion rate indicates that more users are taking the desired actions, reflecting engaging and effective UX.
How to calculate:
Conversion rate = (Number of conversions/Total number of visitors) X 100
3. User retention rate
This formula provides a straightforward way to determine the percentage of users who continue to use your app after a given period. This is essential for understanding user engagement and the app's ability to retain users.
How to calculate:
User retention rate = ((Customers end – Customers new)/Customers start)) x 100
In this formula:
Customers end: This is the number of users at the end of the period.
Customers new: This is the number of users who signed up for subscriptions during the period, and
Customers start: This represents the number of users at the beginning of the period.
4. User churn rate
User churn rate is the opposite of user retention and measures the rate at which users stop using the app over a specific period. It's essential for understanding user disengagement.
This formula calculates the percentage of customers who stop doing business with an organization over some time. It takes the number of customers at the beginning of the period, and the number of customers lost during that period.
How to calculate:
Churn rate = (Lost customers/Total customers at the start of period) x 100
5. Session depth rate
The session depth rate tells you how engaging your mobile app is by measuring the number of interactions per session, or how far a user progresses through the user journey before closing a session or the app.
A higher session depth rate typically indicates that users engage more deeply with the app, explore more content, and have a more immersive experience.
The formula measures the number of pages viewed during a single app session, providing insight into how far users progress through their journey before exiting the app.
How to calculate:
Session depth rate = (Total pages viewed/Total sessions)
How to use UXCam to track and analyze product engagement
1. Product stickiness
One way UXCam helps teams to understand what makes a user stay or leave is through our Funnels feature.


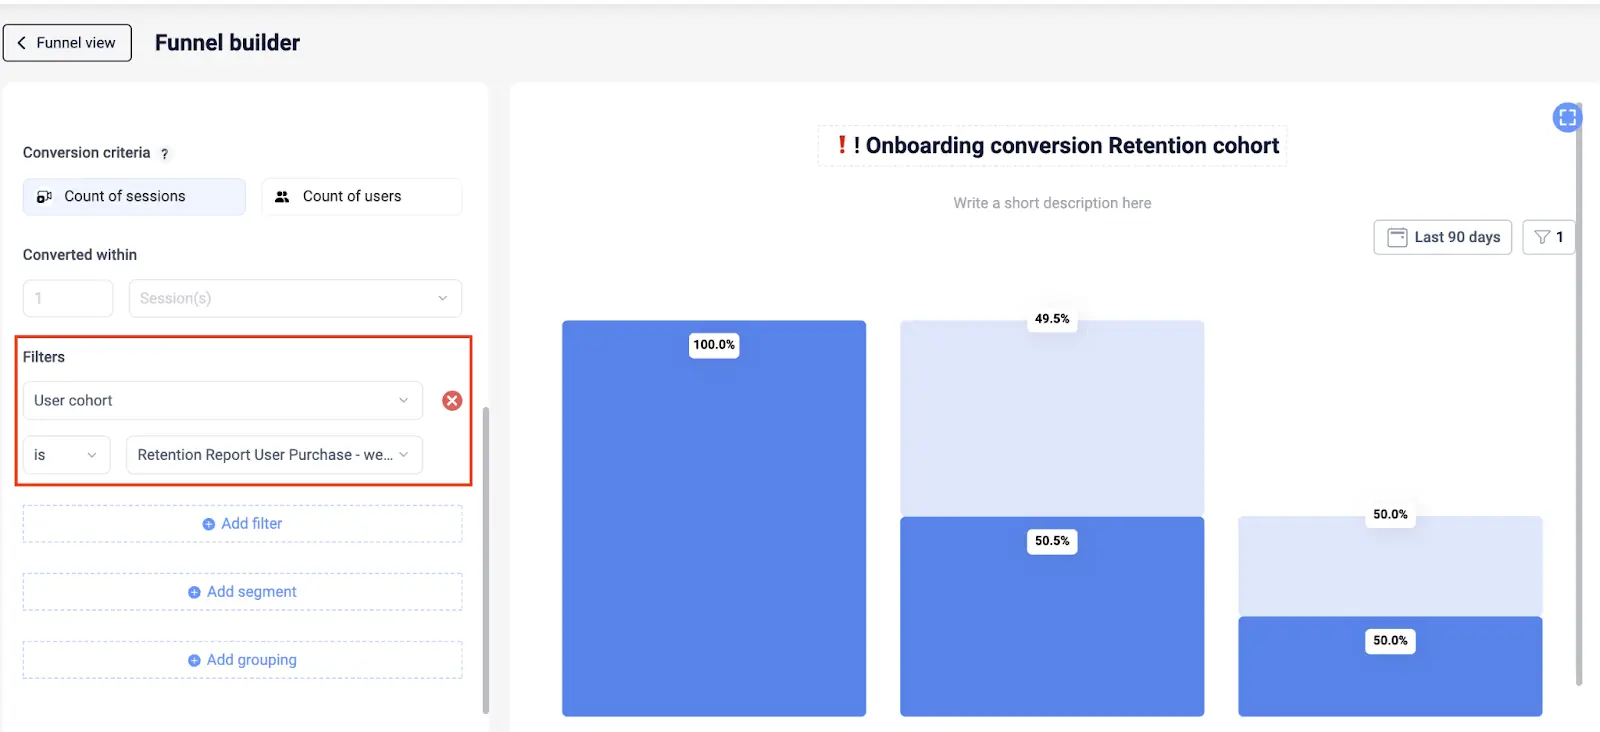
This feature lets you set up sequential chains of events or screens that represent a specific user flow in your mobile app. For example, an account creation funnel might look something like:
1. Add email → 2. Verify email → 3. Add password → 4. Create account
By measuring what percentage of users successfully complete each step, you can identify any potential problems or roadblocks in your user's journey. If only 20% of users that reach the “Verify email” stage move on to “Add password”, there’s likely an issue with your app’s email verification service.
For a different approach to product stickiness, you can also use UXCam to monitor feature adoption.
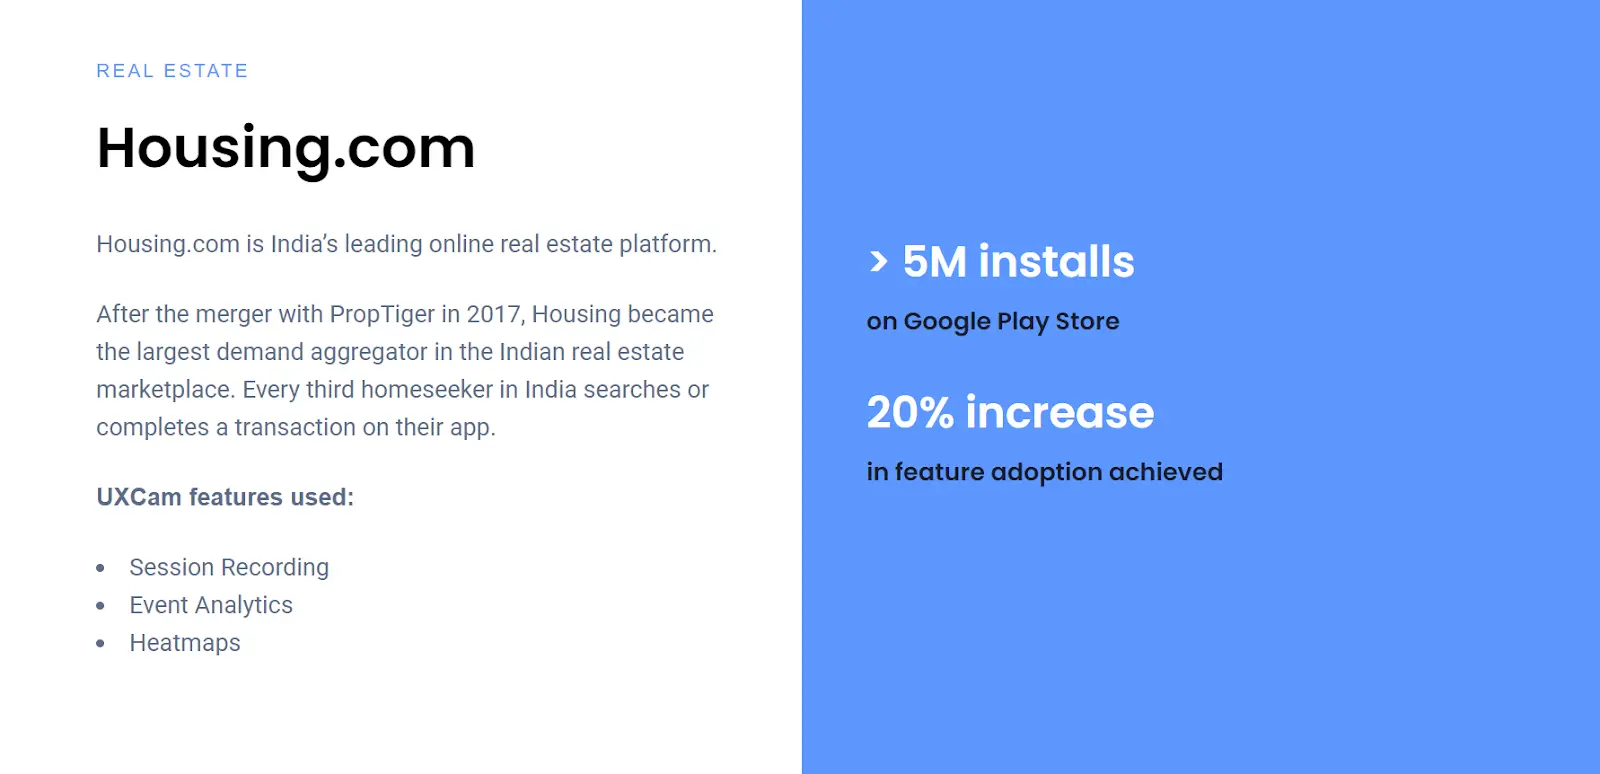
For example, Housing.com used UXCam’s event analytics to analyze adoption for their basic search feature. What they found was that many users were trying (unsuccessfully) to add multiple cities to property searches, leading to frustration.
Adding multicity search boosted feature adoption by 20%.


Conversion rates
Product teams use our journey analysis feature to track and analyze conversion rates, with functionality like filtering sessions based on a funnel phase and creating multistep funnels for a deeper understanding of usage and to find opportunities to increase engagement.


Understanding where users commonly disengage along common paths allows you to address critical points throughout their journey to re-engage them strategically, for example, through incentives or better usability for particular elements.
User retention rate
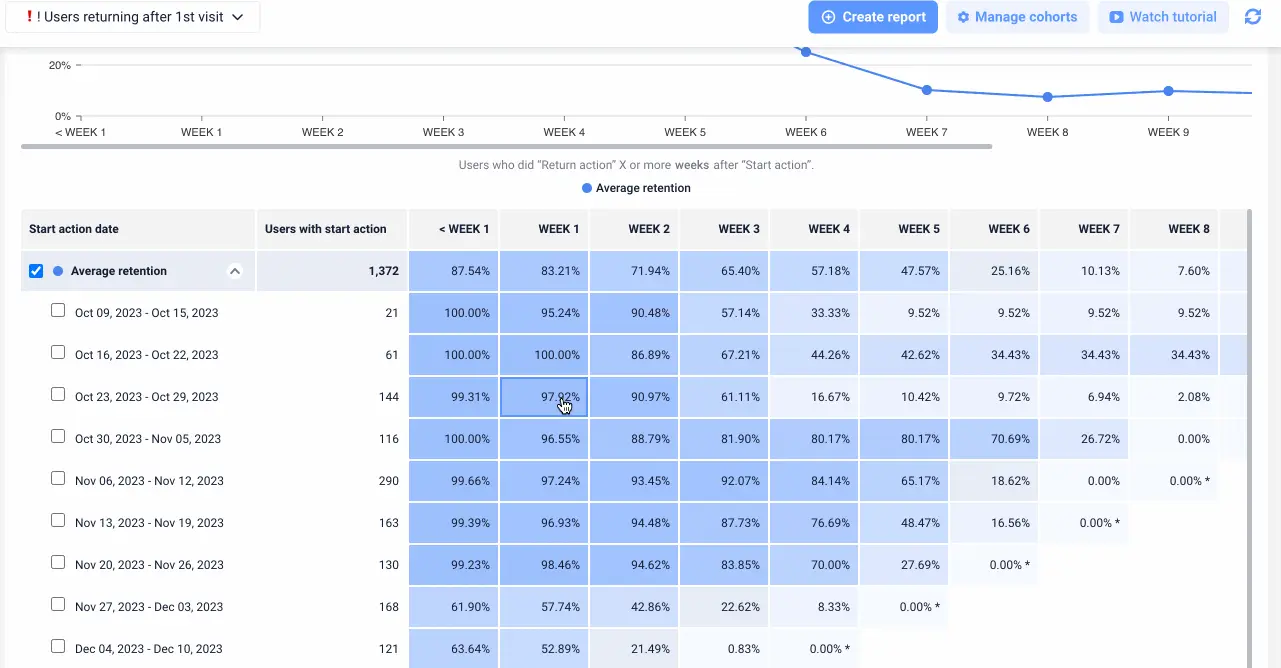
Our dedicated retention rate feature lets you create customizable retention reports for weekly retention insights. When setting up your retention reports, you can specify the start and return actions and return intervals, and add filters and cohorts for deeper insights.
You can implement cohort analysis to track groups of users who share a common characteristic or experience within a specific time frame. This allows you to focus on targeted engagement improvements by observing how user engagement evolves, the impact of changes or updates on user behavior, and identifying patterns among different user segments.


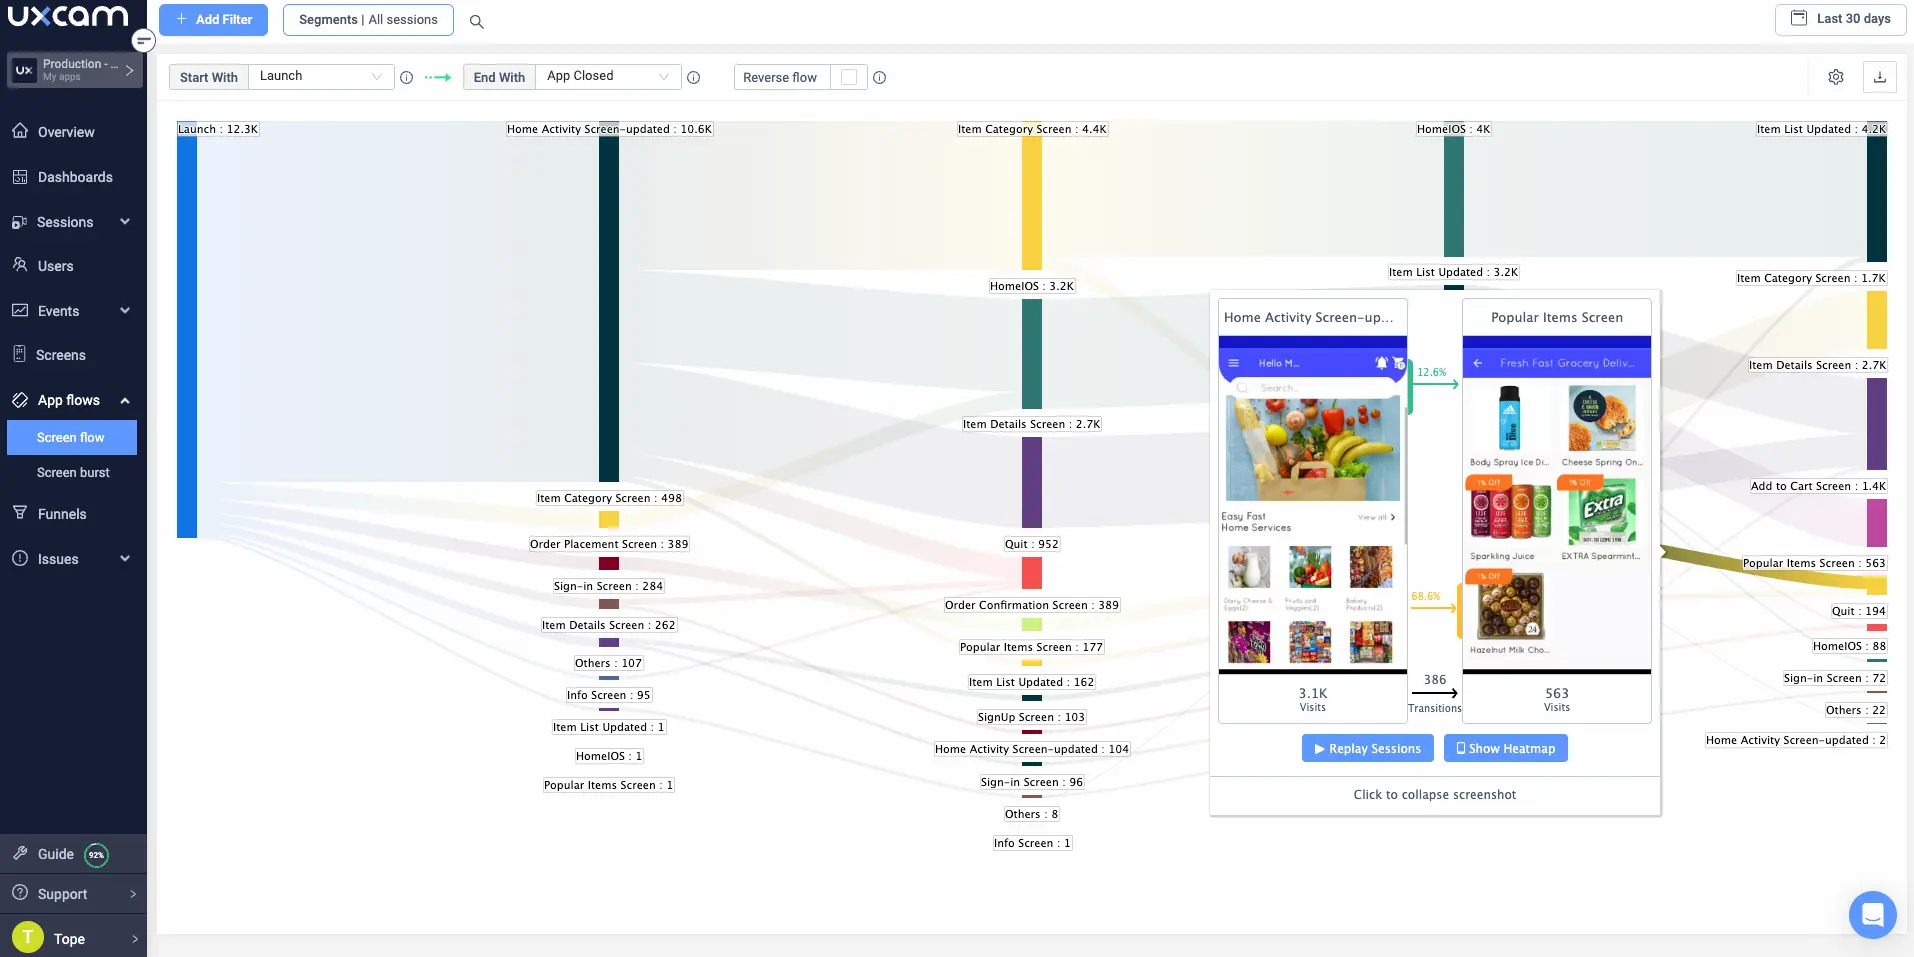
Additionally, UXCam's retention analysis allows businesses to view detailed user flows using screen flows and screen bursts, which are powerful tools for retention analysis as they allow users to see which paths through the app lead to the best user retention.
User churn rate
In addition to setting up conversion funnels and monitoring user journeys, teams use our session replay and heatmap data for a comprehensive understanding of user engagement.
Session replays help track and analyze product engagement by providing recordings of user sessions for a granular view of how users engage with the app and identify areas where they may struggle or get stuck—as well as uncover new or feature enhancement ideas.


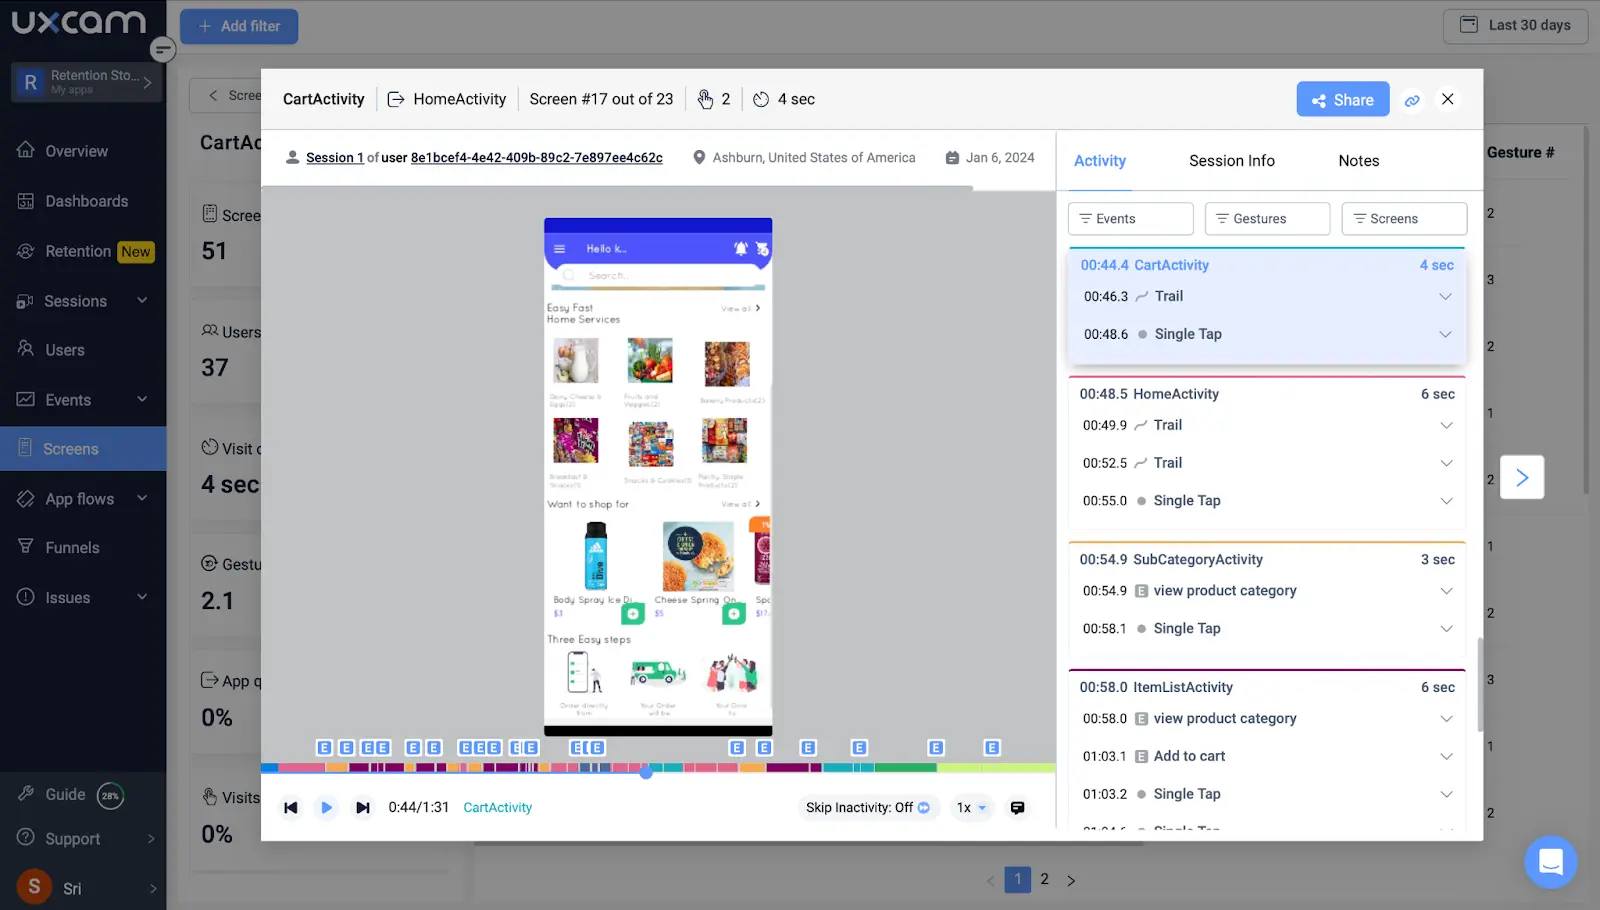
On the other hand, the heatmap functionality delivers statistics for revealing how users interact with key elements of a page, like calls to action, buttons, and links—allowing teams to identify areas of high and low engagement.


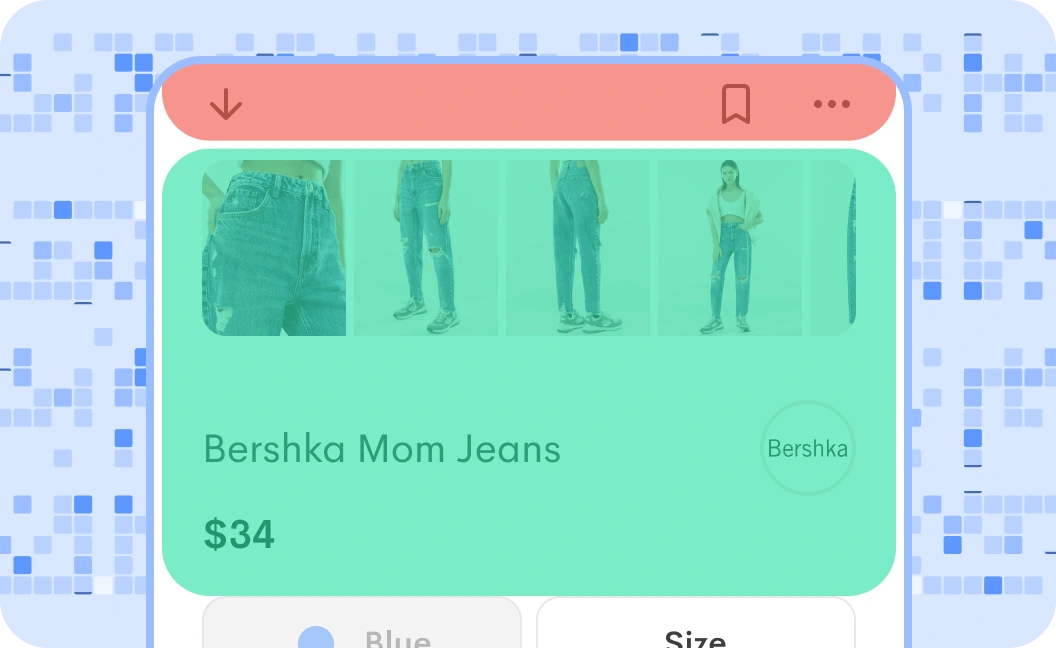
Then you can jump to session replays to investigate user behavior further.
Session depth rate
Once you install UXCam, we start tracking user data immediately to collect the necessary metrics and analytics for product engagement analysis.
Our journey analysis is also highly valuable for understanding your session depth rates, as you’ll see how far users progress through your app before ending the session. This data helps find the usage patterns and pain points that may affect session depth.
UXCam usage stats
And our customizable dashboards do a superb job of centralizing and visualizing the data. Build product engagement dashboards to track various metrics and analytics related to session depth rate. You can have the results for specific metrics you wish to focus on, or set to display a quick usage overview to summarize key metrics.
Use UXCam to build sticky mobile apps
Product engagement analytics are fundamental to understanding and enhancing UX, directly influencing the success and growth of your mobile app. Our comprehensive suite for tracking and analyzing user engagement provides teams with the insights necessary to make confident design decisions.
Integrating UXCam into your product analytics strategy will get you better user engagement and mobile products that users love and keep returning to. Join the thousands of mobile brands who experience this by signing up for a free account.
You might also be interested in these;
How to analyze session recordings
How to calculate churn rate for mobile apps product
How to build an effective product funnel
Product hypothesis - A guide to create meaningful hypotheses
AUTHOR


Related articles


Product best practices
12 Apps with Great User Onboarding (2026 Examples)
The 12 mobile app onboarding flows I'd study if I were designing one today, with specific callouts for what each does well, common mistakes, and the...


Silvanus Alt, PhD
Founder & CEO | UXCam


Product best practices
Why creating a data-driven culture has less to do with data than you think
Kishan Gupta, CEO, shares 5 tips and techniques for fostering a data-driven culture based on his own experiences building and leading...


Kishan Gupta
Co-Founder of UXCam


Product best practices
Finance apps have a customer support problem, here's how to fix it
Learn about the customer support problem in finance apps and practical solutions to fix it in our latest blog post, and improve user satisfaction and...


Jane Leung
Product Analytics Expert