Churn Rate vs Retention Rate - Understanding the Difference


Churn and retention rates are essential metrics for mobile app product management teams in the dynamic digital environment. They reveal how sticky your app is and allow you to measure the effectiveness of your development efforts.
In this UXCam guide, we will examine these two important metrics in detail, explaining their differences, their implications, and how they can be leveraged to improve your mobile app's performance.
Let’s dive in.
Churn rate vs. retention rate - an overview
The churn rate and retention rate are two sides of the same coin.
A churn rate measures the percentage of users that are leaving your app, while a retention rate measures the percentage of users that stick around. For a given period, your churn rate and retention rate will always sum to 100%.
Despite the similarities, these two metrics offer insights into different aspects of your app’s performance:
Churn rate: Churn rate is a powerful metric that can offer insights into when and why users stop using your app. It can help you identify areas of your app that are not working and need improvement.
Retention rate: Retention rate is a great metric to measure the success of your user engagement, user acquisition, and onboarding efforts. It can help you understand how successful your strategy is for bringing users back to the app and keeping them engaged.
The key to getting the most out of these metrics is diligently tracking them with a monitoring tool like UXCam and using this data to inform your UX decisions. By understanding both churn and retention rate, you can make improvements to your app that will keep users engaged and coming back for more.
What is a churn rate?
Churn rate is the percentage of users that have abandoned your app in a given period (usually week, month, or year).
How we calculate churn rate
The formula for churn rate is:
Lost Users over [Period] / Total Number of Users over [Period] x 100%


For example, if you had 800 users at the beginning of the month and 50 of them were lost by the end, your churn rate would be 6.25% (50/800 x 100%).
If your churn rate is higher than your growth rate, it means your app is losing users faster than it's gaining them. This means you need to focus on lowering your churn rate and actively retaining more customers.
How to track and manage churn rate
UXCam can help manage churn rate in several ways.
For starters, UXCam allows you to track churn rate through customizable reports. You can build dashboards and track churn rate alongside other product KPIs to get a high-level overview of product performance at a glance.
In addition, UXCam can help you uncover the “whys” behind customer churn through features like:
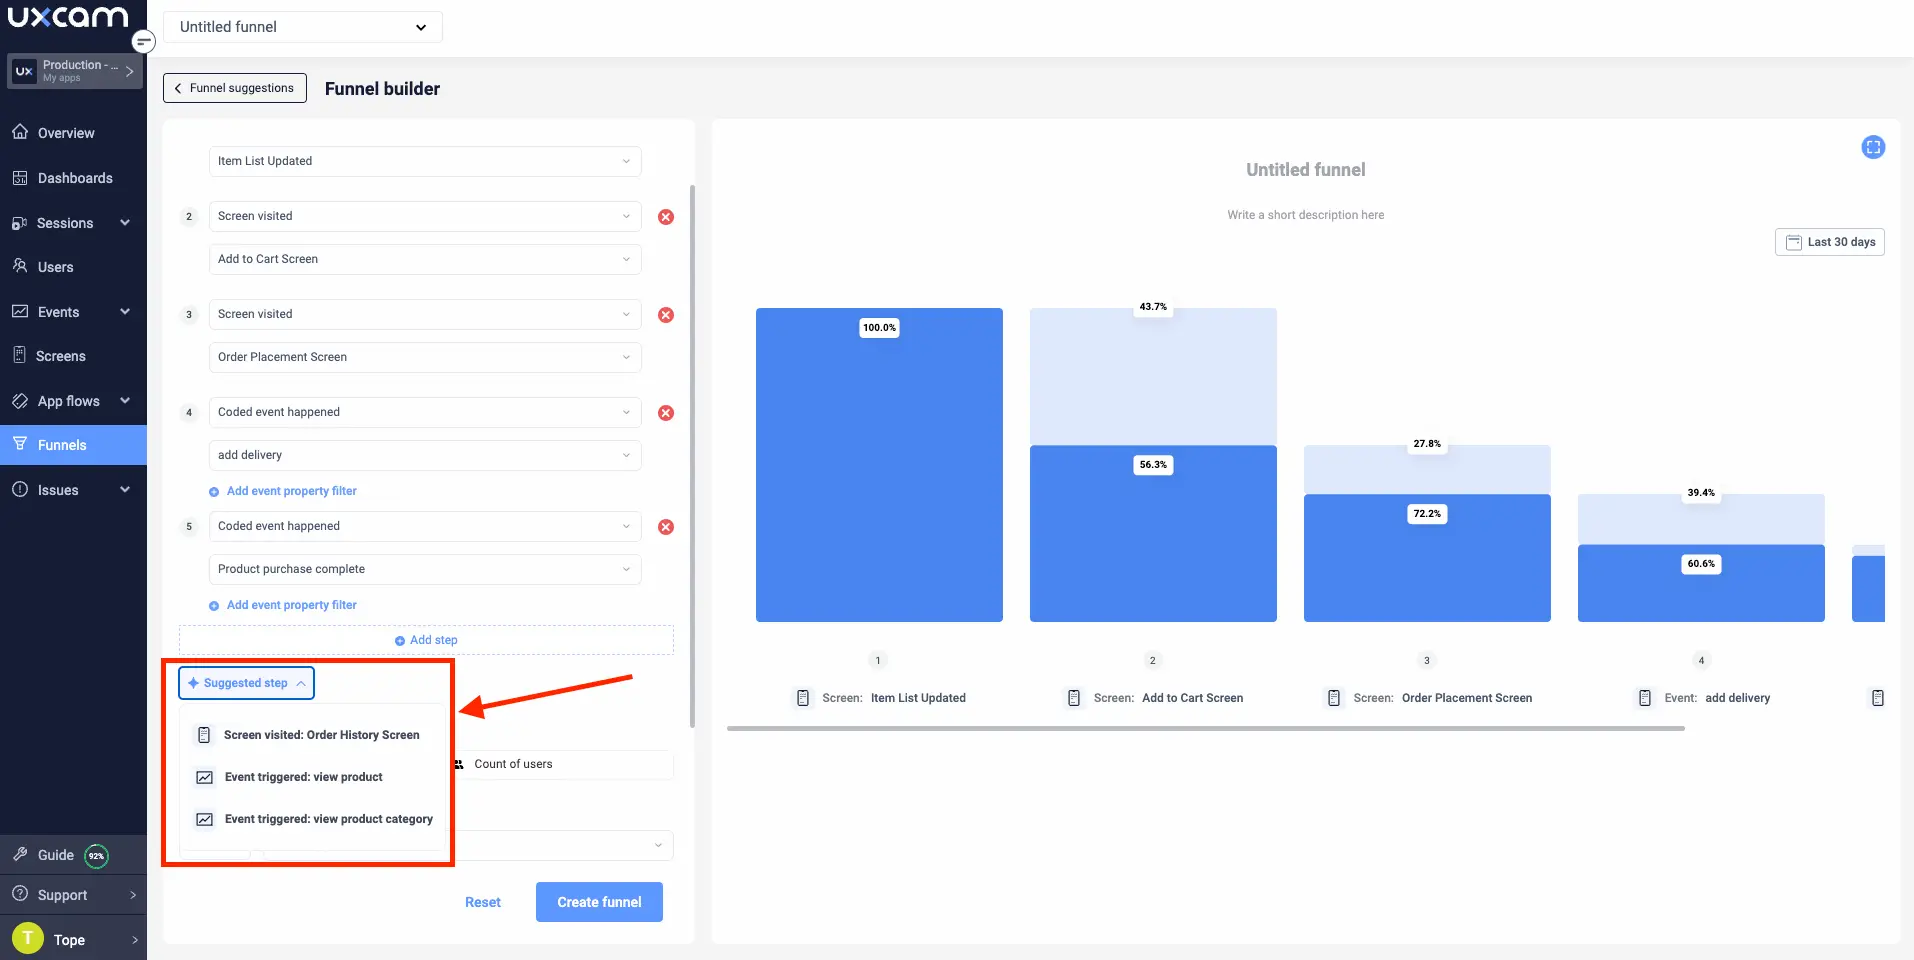
Funnels: Spot bottlenecks in user flows and identify where users are stopping short of completing a goal.


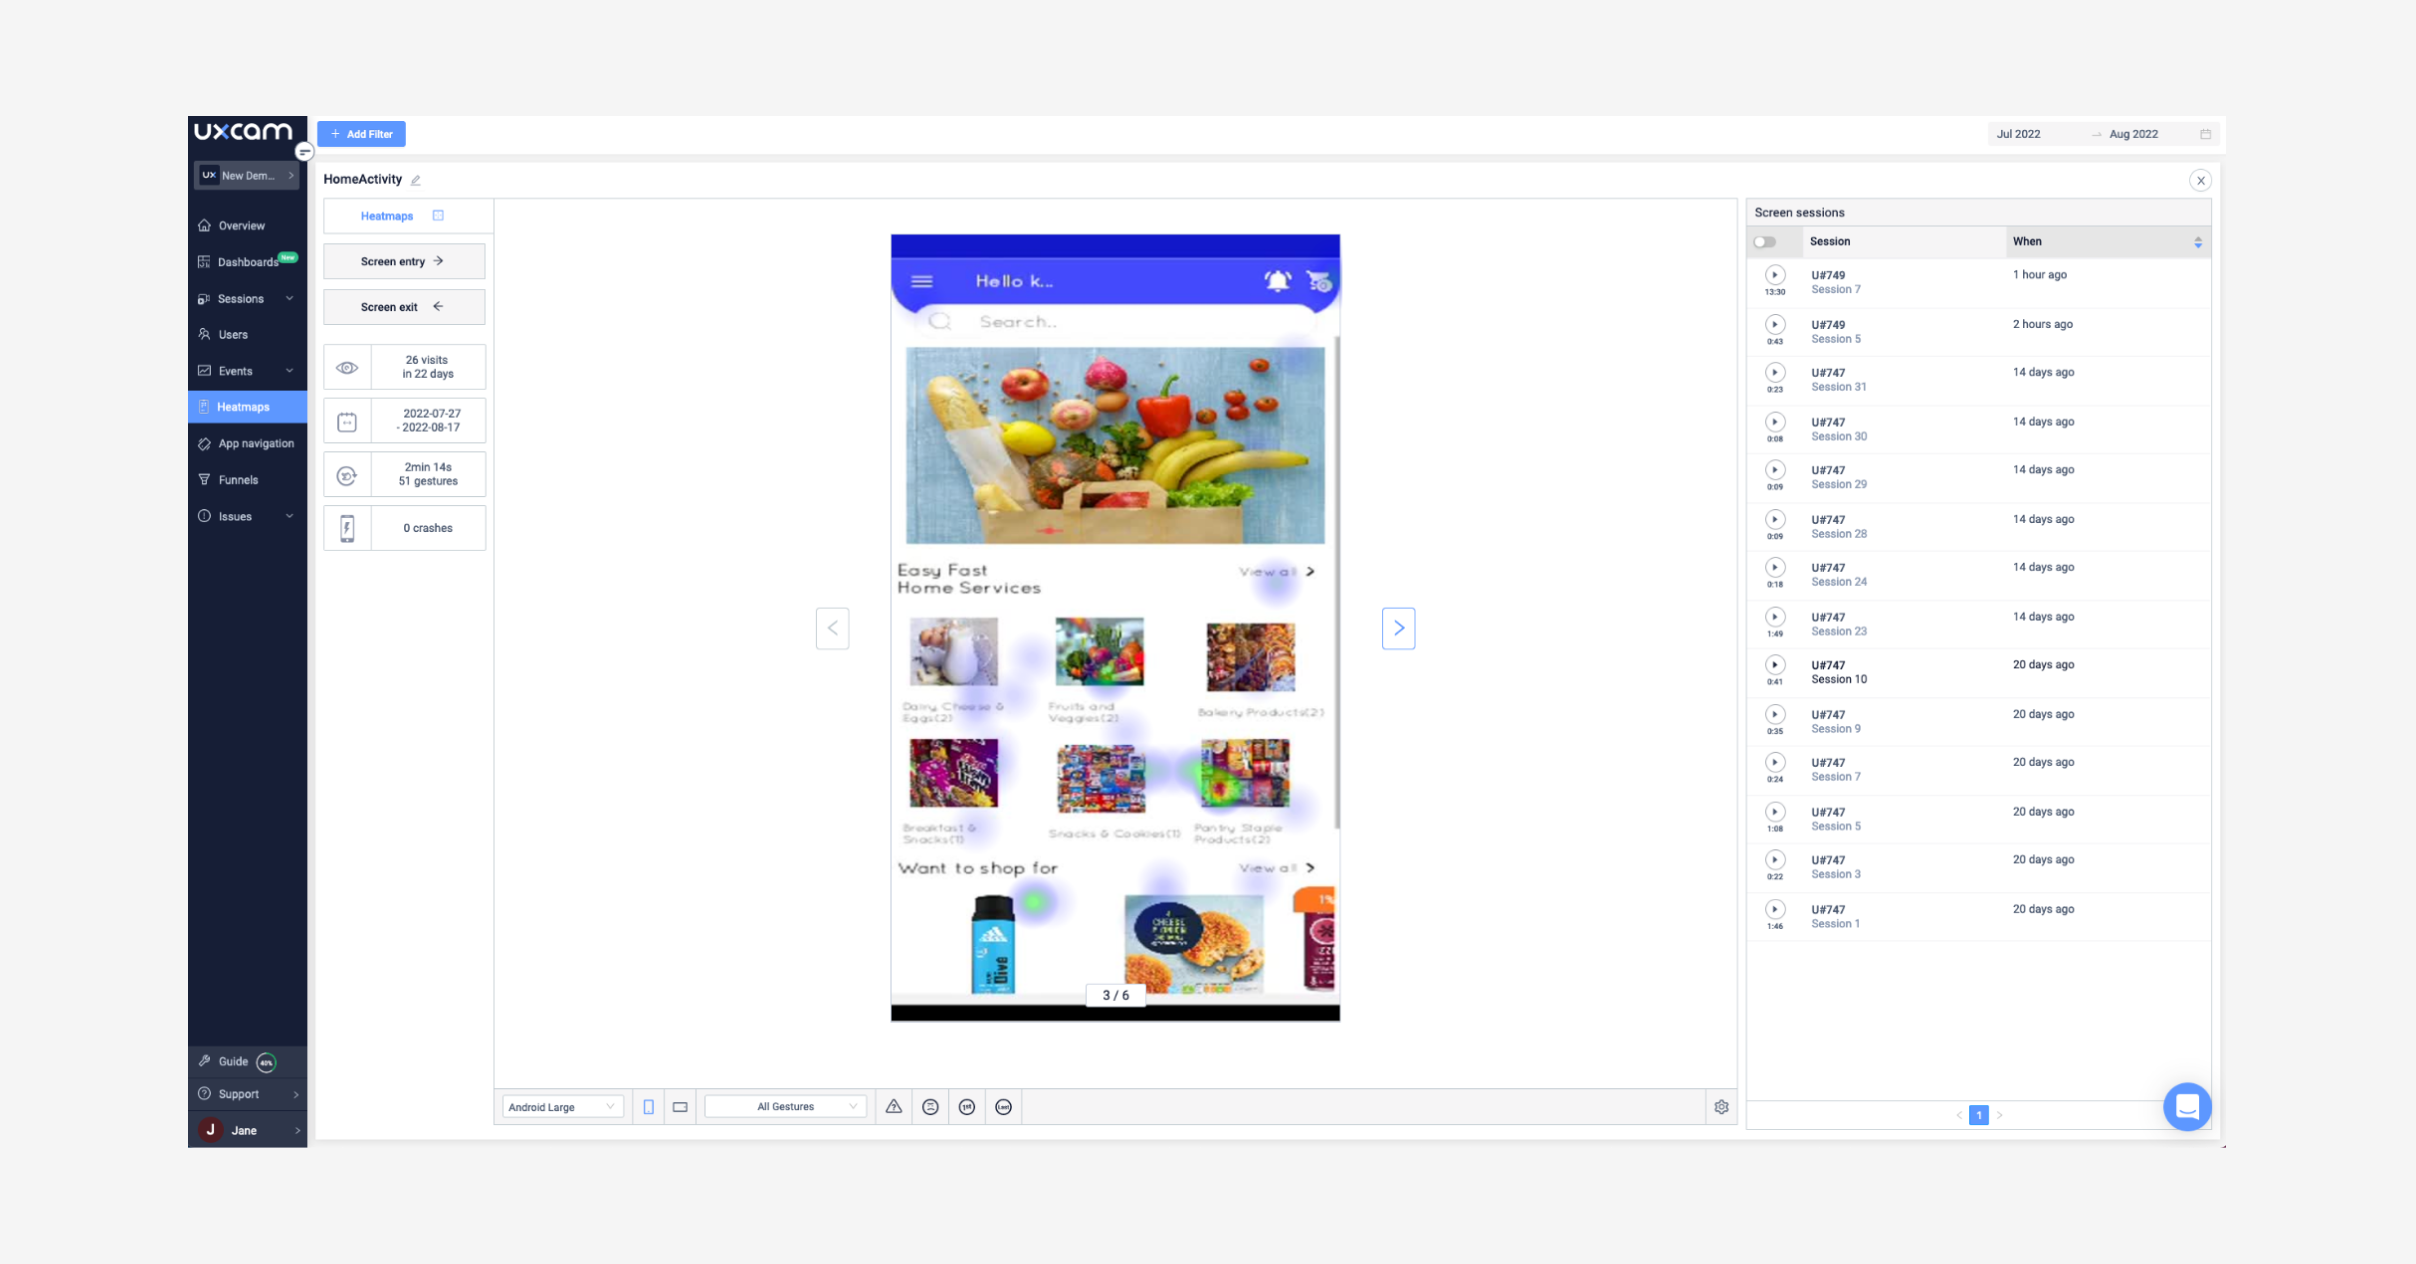
Heatmaps: Identify areas of low engagement and opportunities for improvement.


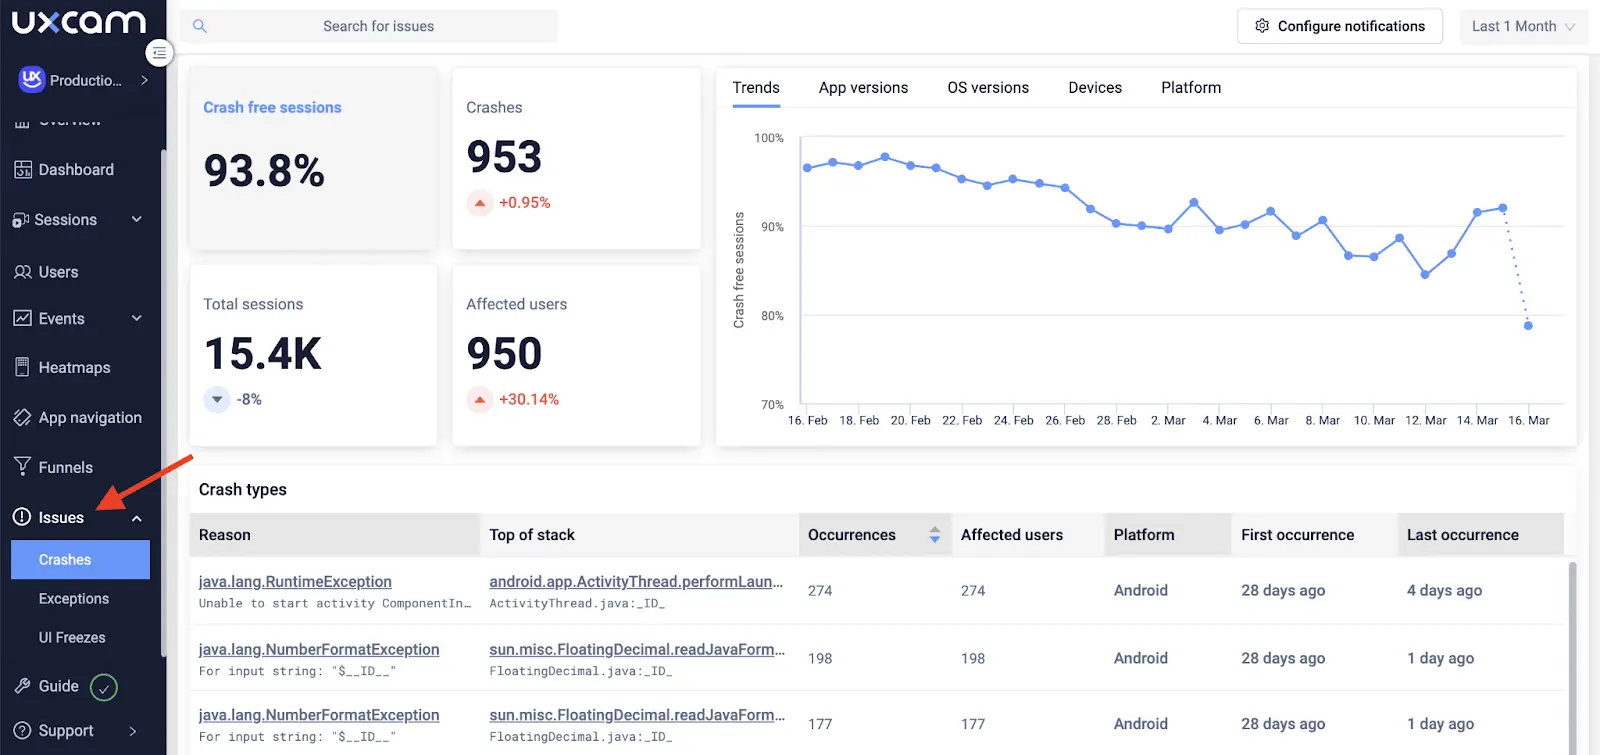
Issue Analytics: Track bugs, glitches, and user frustration to spot churn-inducing issues.


Session Recordings: Watch user interactions with your product to see which features are being used effectively, and which ones might need improvements.


Brainspace’s experience with UXCam highlights how many of these features interface with customer churn.
The team analyzed churn via their cancellation process and collected user properties and events. By filtering for canceled users with video replays, they identified the top reason for cancellation as "Too_Expensive."
They also discovered that many users canceled after experiencing issues with playing a guided meditation video, leading to rage taps. The team addressed these issues, resulting in a 10% reduction in rage taps and decreased churn.
What is a retention rate?
Retention rate is the percentage of customers or users that stick with a product over a certain period of time (usually week, month, or year).
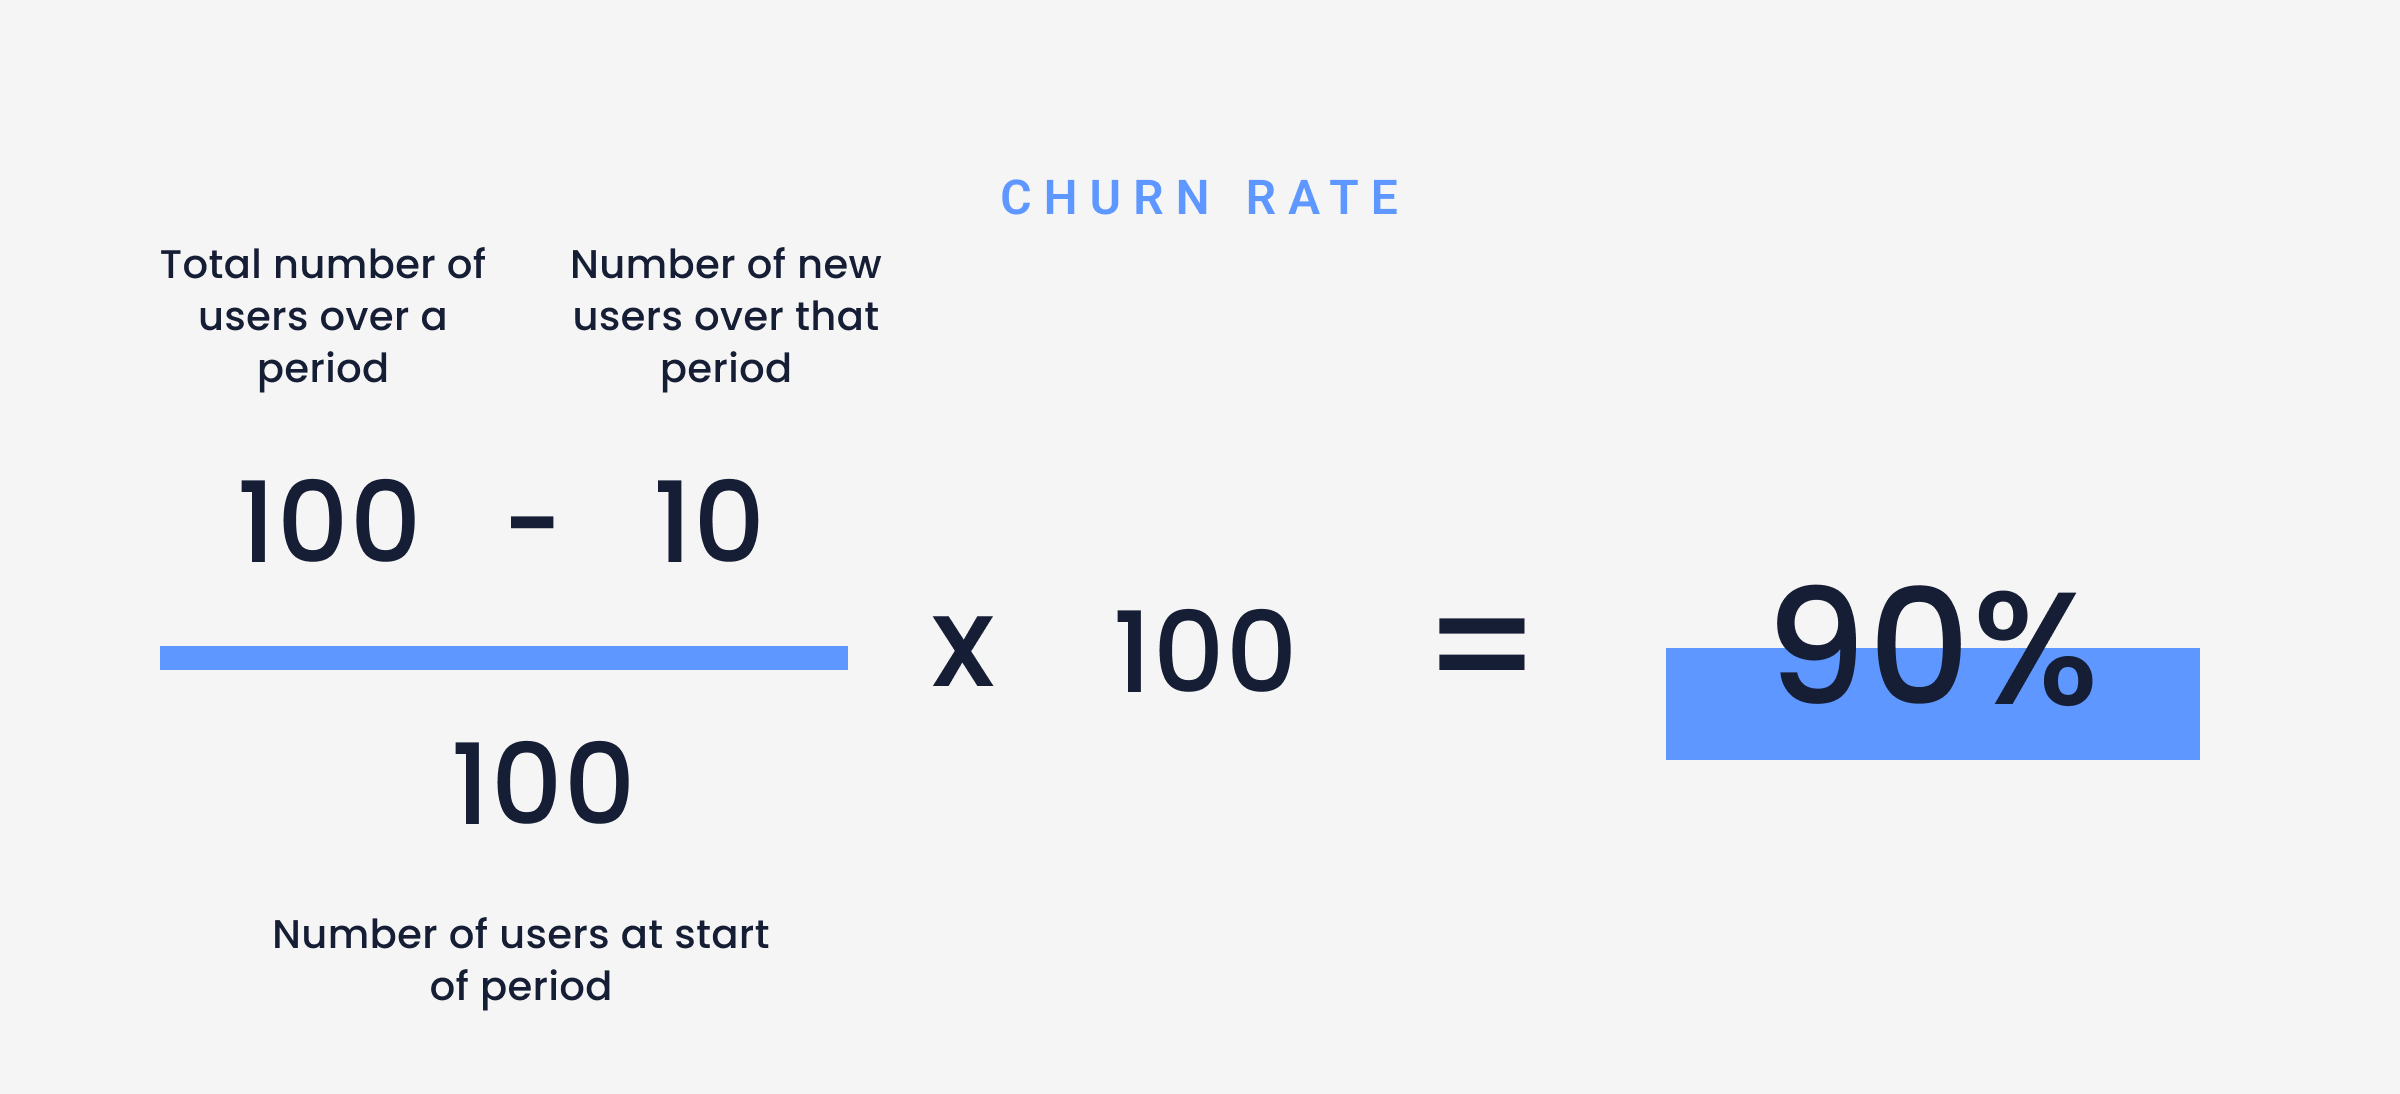
How to calculate retention rate
The formula for retention rate is:
Users at End of [Period] / Users at Start of [Period] x 100%


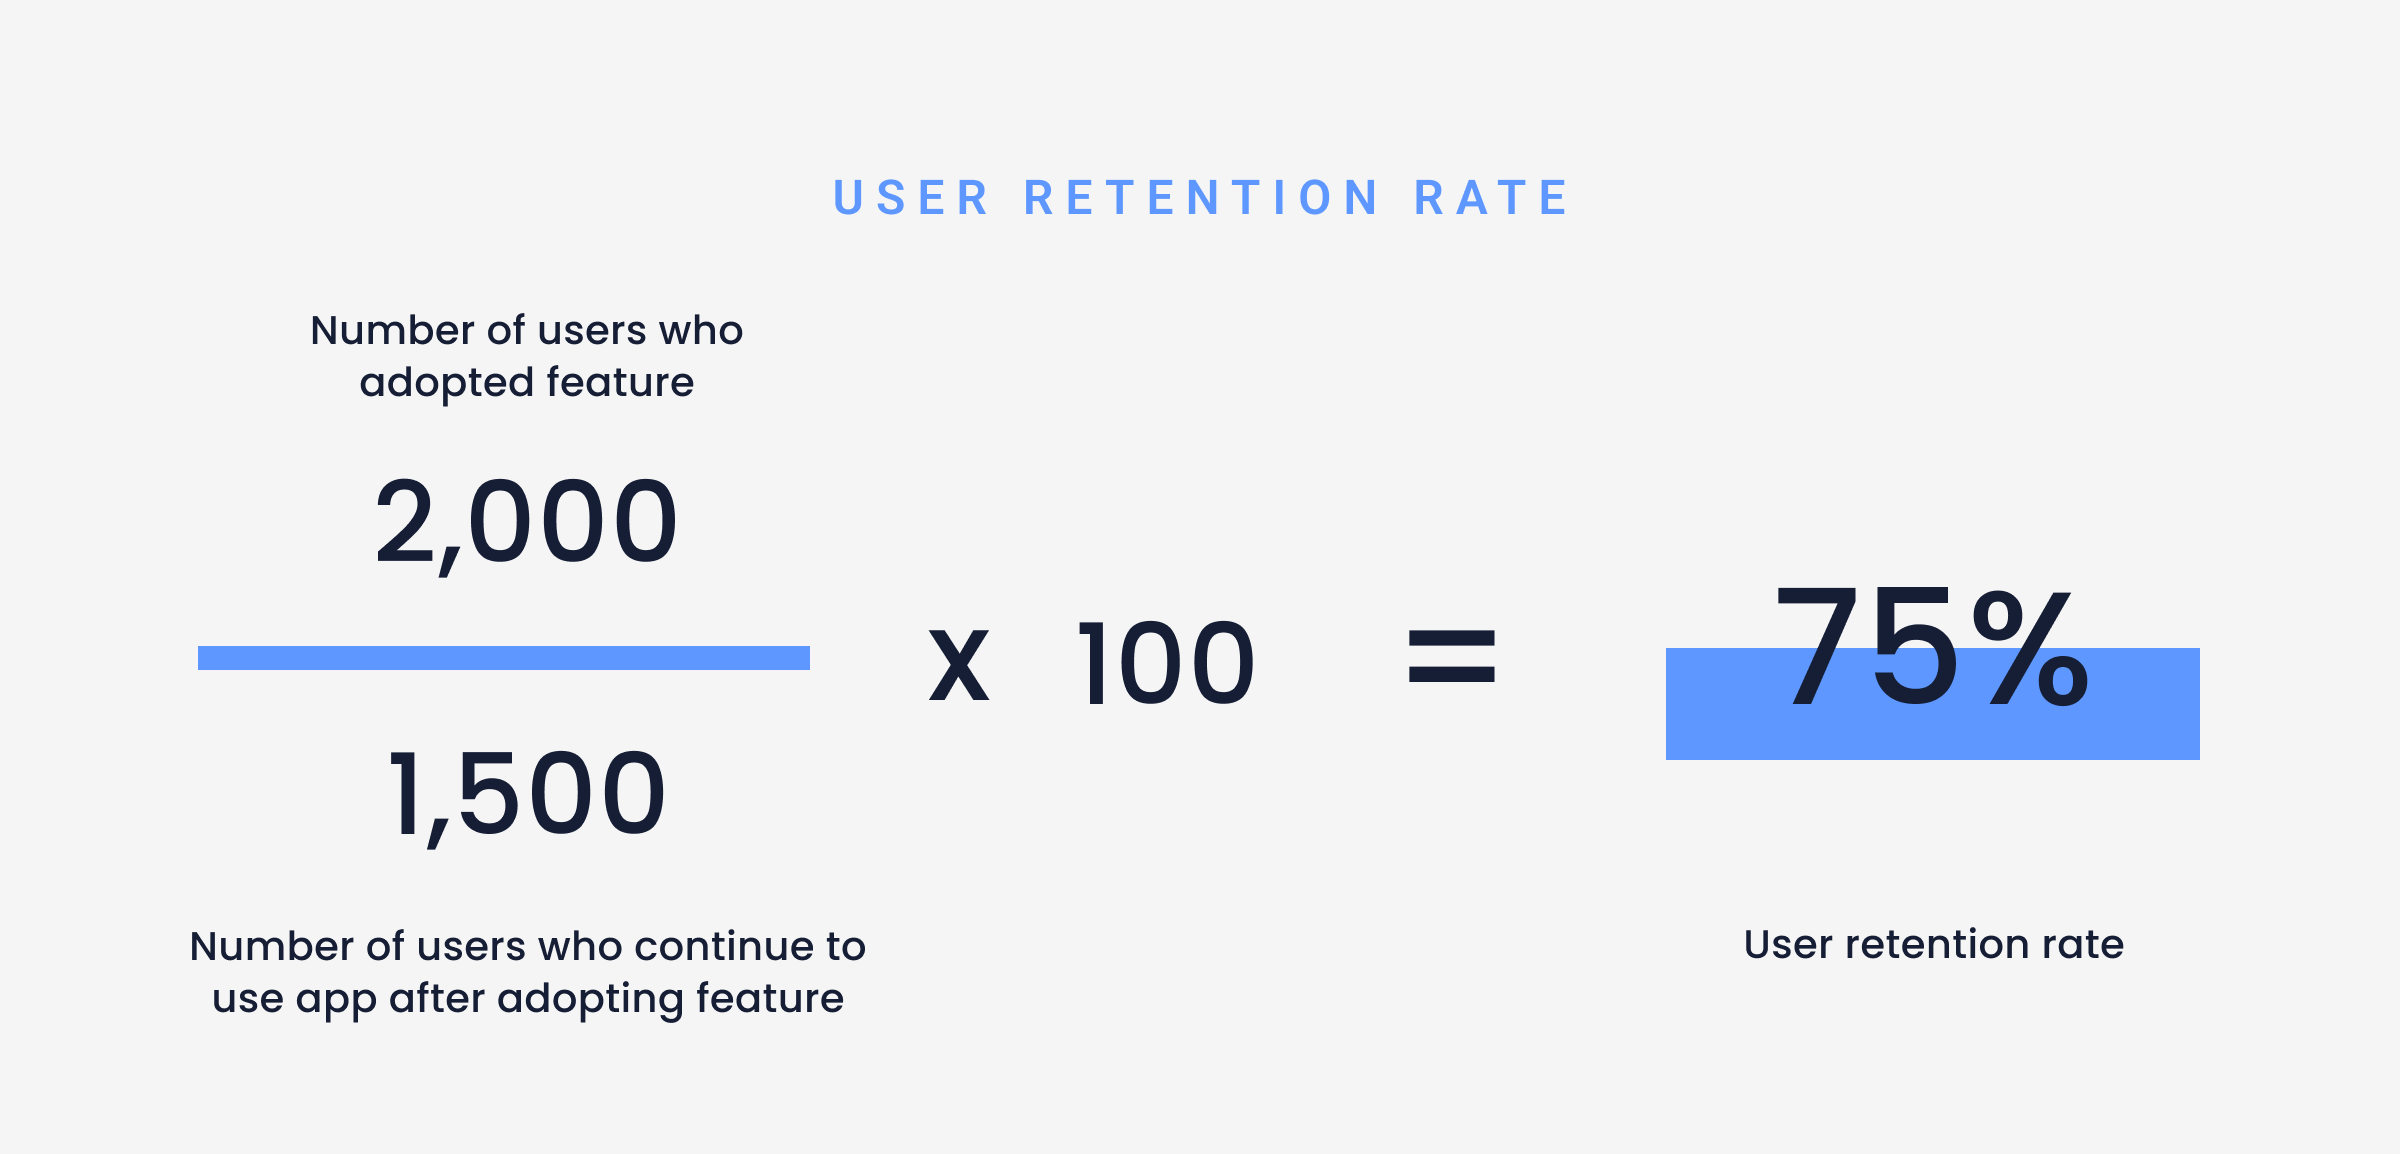
For example, if a product had 20 users at the start of December and 10 users at the end of December, the retention rate would be 50%.
Retention rates are important because they help identify how well customers love (and stick with) your products. High retention rates indicate that customers are happy with your product and find it valuable.
Low retention rates, on the other hand, mean customers aren't finding value in what you're offering—either due to lack of features or an overwhelming UI experience.
How we track retention rate
In the same way that UXCam captures user data to measure engagement, we use a combination of tools and techniques to track customer retention rate:
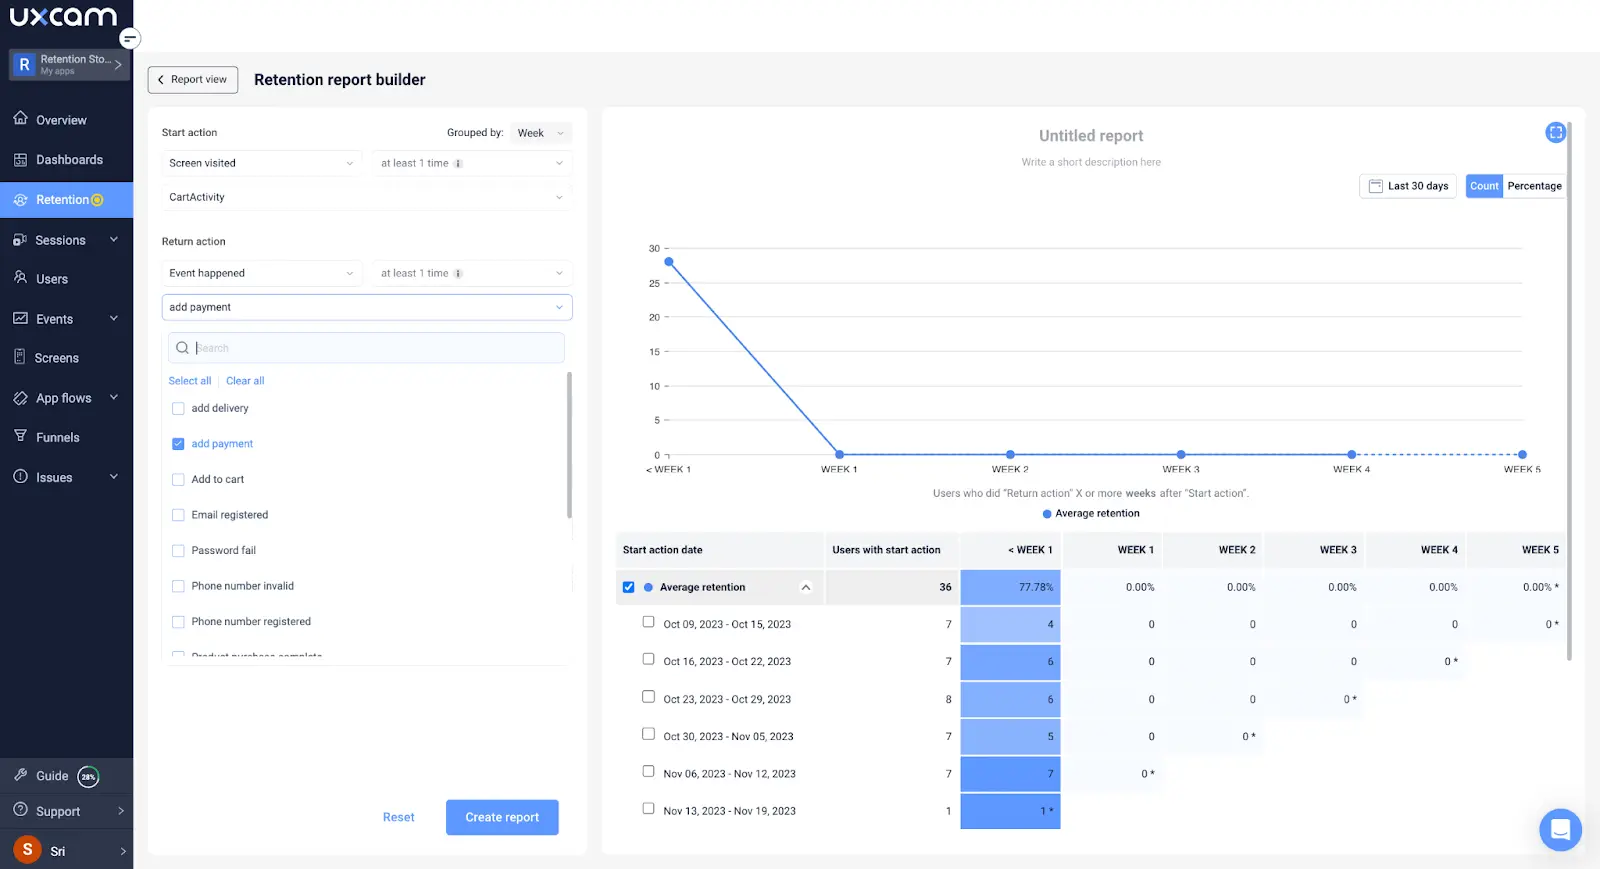
Retention Analytics: Track user engagement over time to pinpoint when and why users return or exit your app.


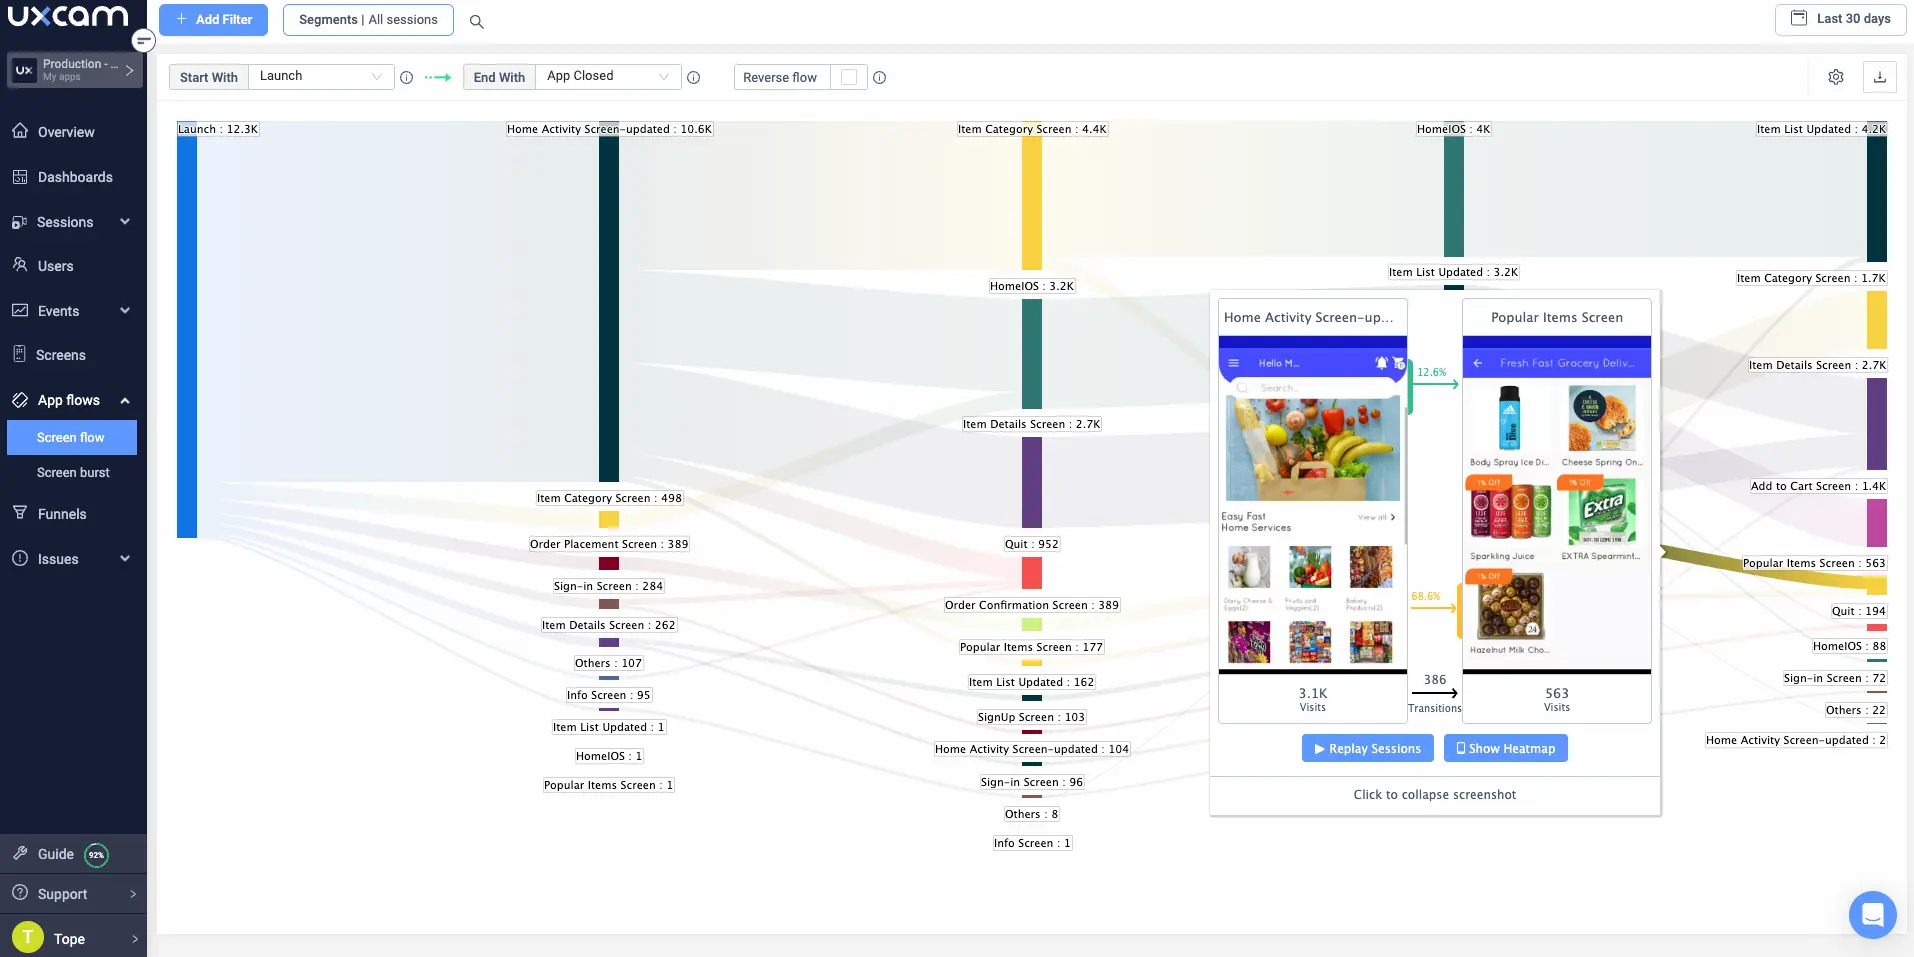
User Journey Mapping: Track the paths that lead to successful user retention and identify the actions or in-app behavior that's associated with long-term customer relationships.


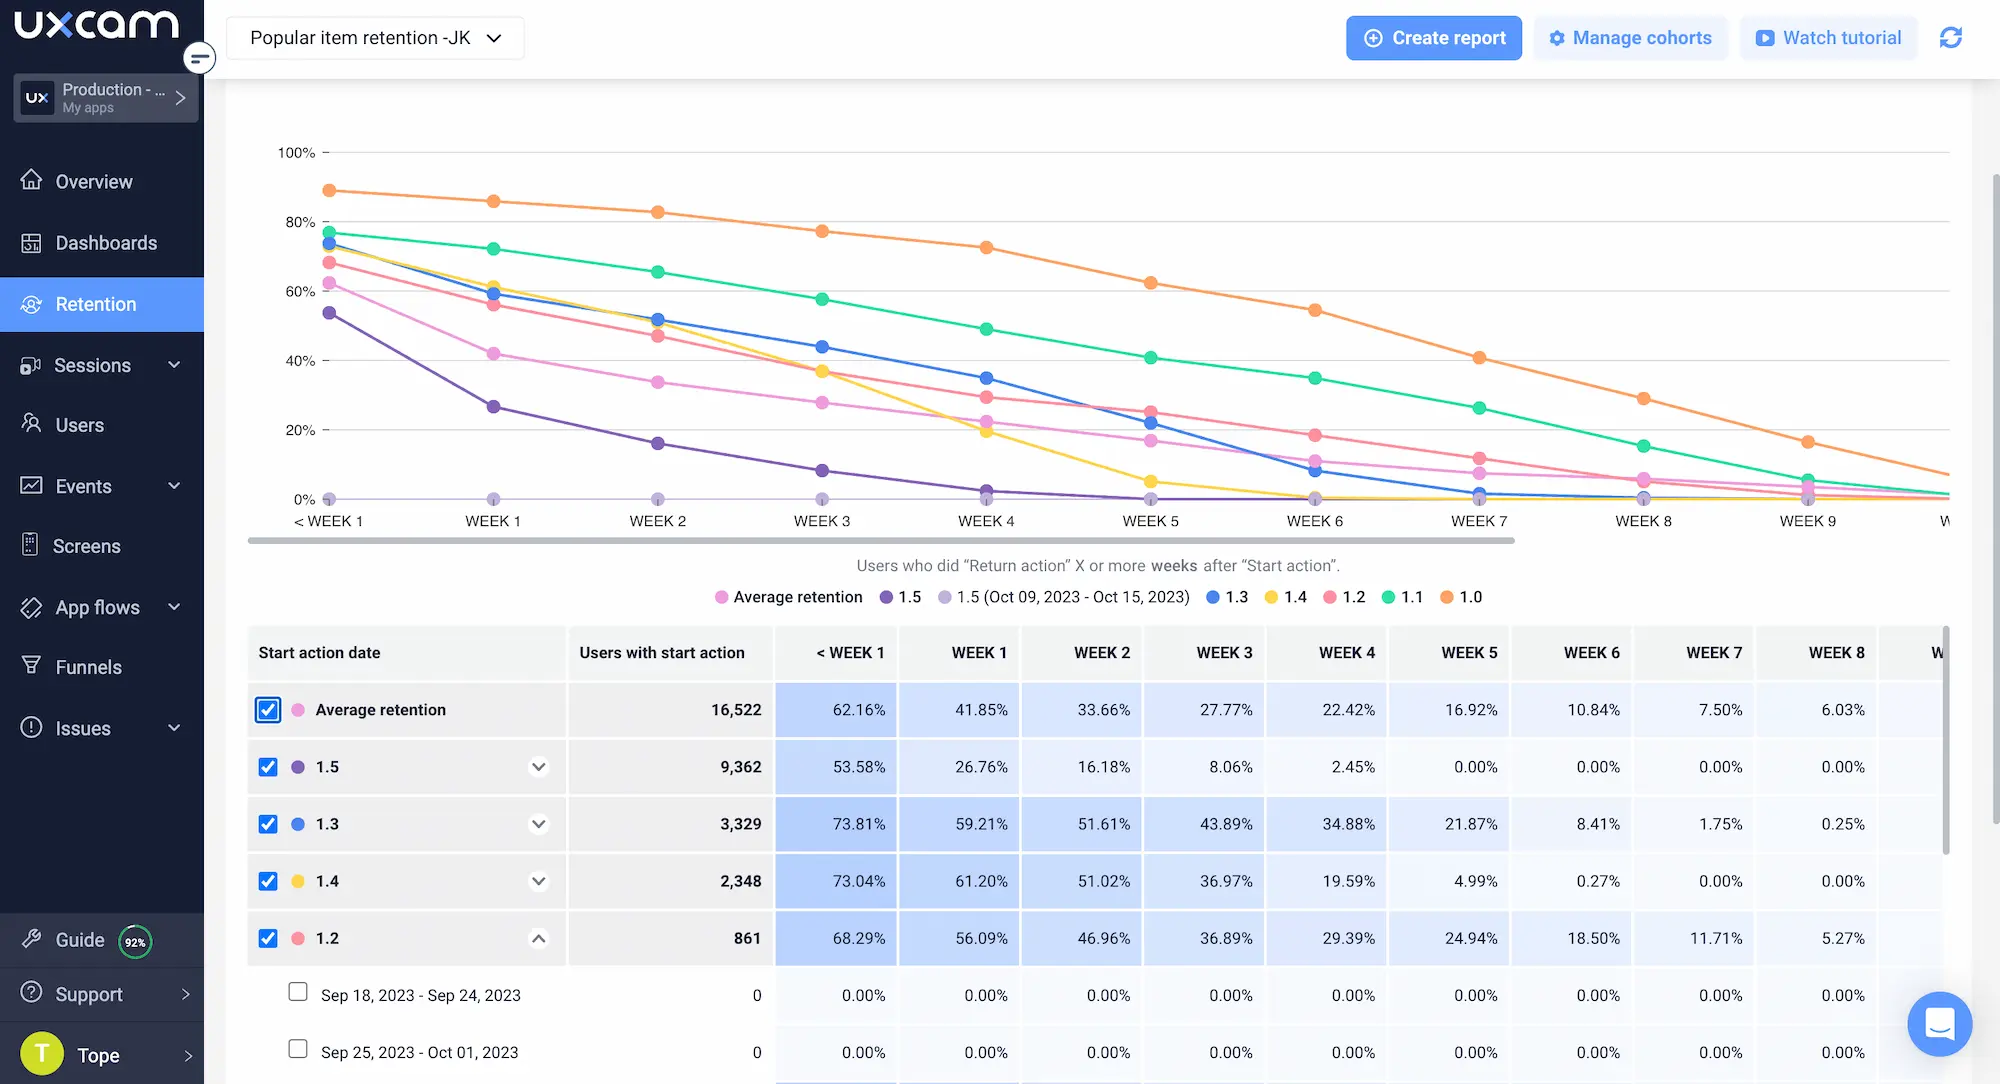
Cohort Analysis: Monitor the rate at which users return to your product over time by grouping them into “cohorts” based on their signup date, platform used, or any other criteria that makes sense for your business.


Conclusion
To run a successful business, it's important to grasp the connection between churn rate and retention rate. These metrics shed light on customer behavior, but from different angles. Churn rate tells you how many customers stop using your product, while retention rate focuses on those who stick around.
So, keep an eye on both to understand your customer base better!
Start leveraging these metrics today with UXCam, which provides in-depth analytics to help you understand your customers better. Don’t miss out on this opportunity to improve your business.
Sign up for free now!
You might also be interested in these;
Mobile app retention benchmarks by industries
How to increase mobile app retention: Ultimate guide
6 Best customer retention software and tools for growth
AUTHOR
Tope Longe
Product Analytics Expert
Ardent technophile exploring the world of mobile app product management at UXCam.


Related articles


App Analytics
The Hotjar for mobile apps: UXCam
Hotjar doesn't support mobile apps. Learn why mobile and web analytics are fundamentally different, what changed after the Contentsquare acquisition, and the best mobile-first...


Jonas Kurzweg
Product Analytics Expert

App Analytics
Mobile App Tracking: Practical Guide and the 8 Best Tools for 2026
A practitioner's guide to mobile app tracking in 2026, covering how SDKs work, what to measure, and the 8 tools product teams actually...


Silvanus Alt, PhD
Founder & CEO | UXCam


App Analytics
Why Do My Apps Keep Crashing? A Complete Guide
Why do your apps keep crashing? A product analyst's guide to diagnosing crash causes, fixing memory leaks, and using session replay to find root...
Silvanus Alt, PhD
Founder & CEO | UXCam