How to Calculate Churn Rate for Mobile Apps Product


Churn rate is a key metric for mobile app growth
Statista reports that in the second half of 2018, only 29% of mobile app users worldwide stayed with an app for three months—the rest churned. That means most mobile apps are leaving a lot of potential revenue on the table.
In this UXCam guide, we will explain more about churn rate, how we calculate it, and what you can do to reduce it. By the end of this article, you’ll have a better understanding of the importance of churn rate and how to improve it.
What is churn rate?
Churn rate (or rate of attrition) is the percentage of users that stop using your app over a given period.
This is an absolutely crucial metric in product development—if your churn rate is high, it means you aren’t keeping users engaged for the entire length of the period. And depending on the length of time you’re looking at, that can mean all kinds of things.
For example, a high churn rate in the first week of use may be an indication that users aren’t having a great onboarding experience. On the other hand, if your churn rate is high for a longer period of time (like six months or a year), it could mean that there are features missing or issues with usability.
So, how do you track churn rate? The easiest way is with a monitoring tool like UXCam.


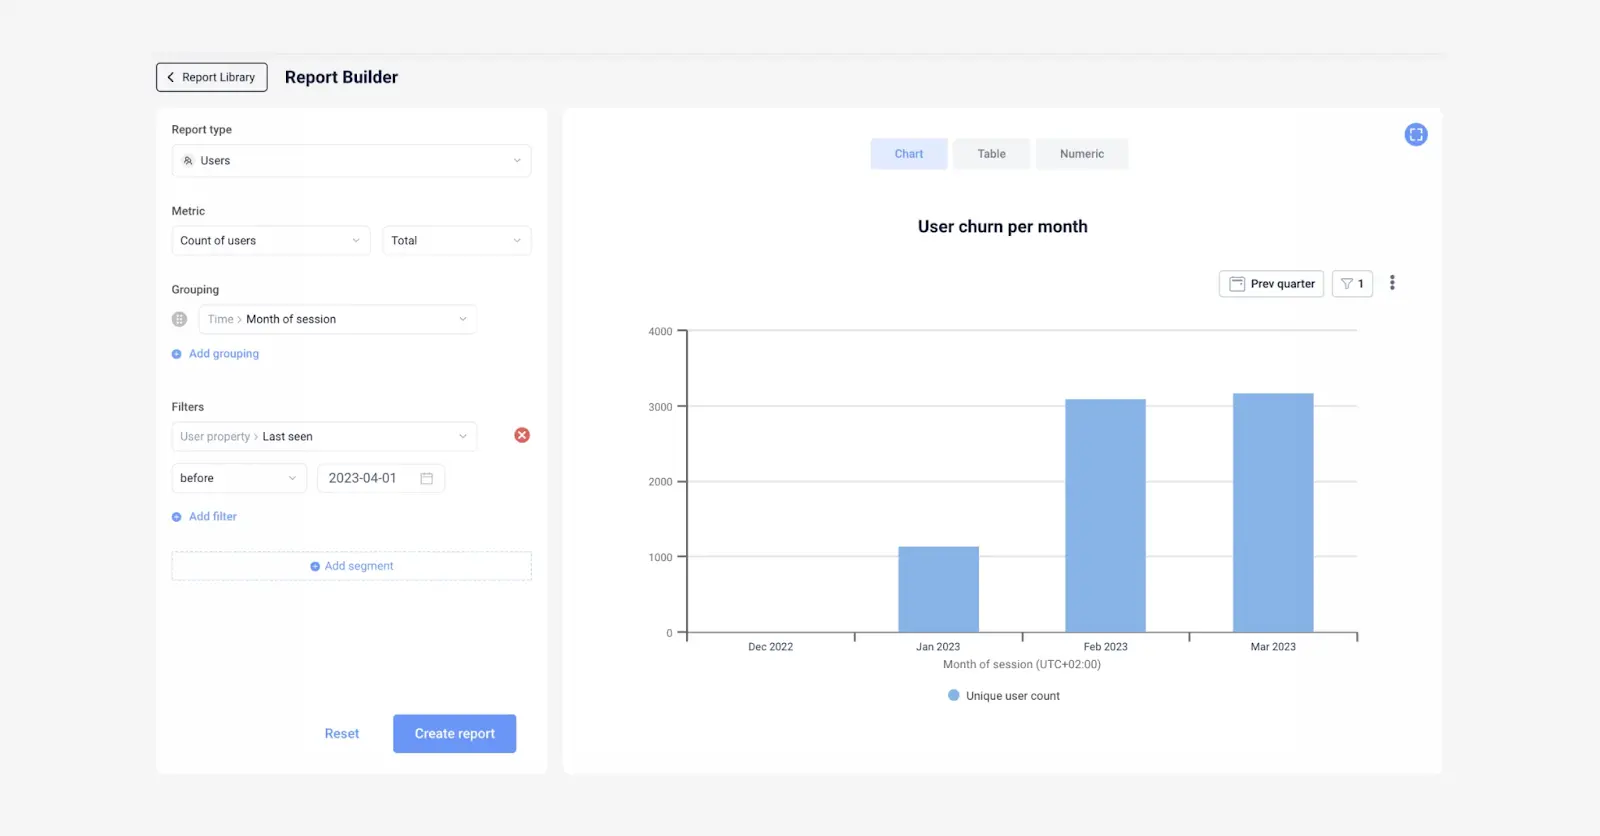
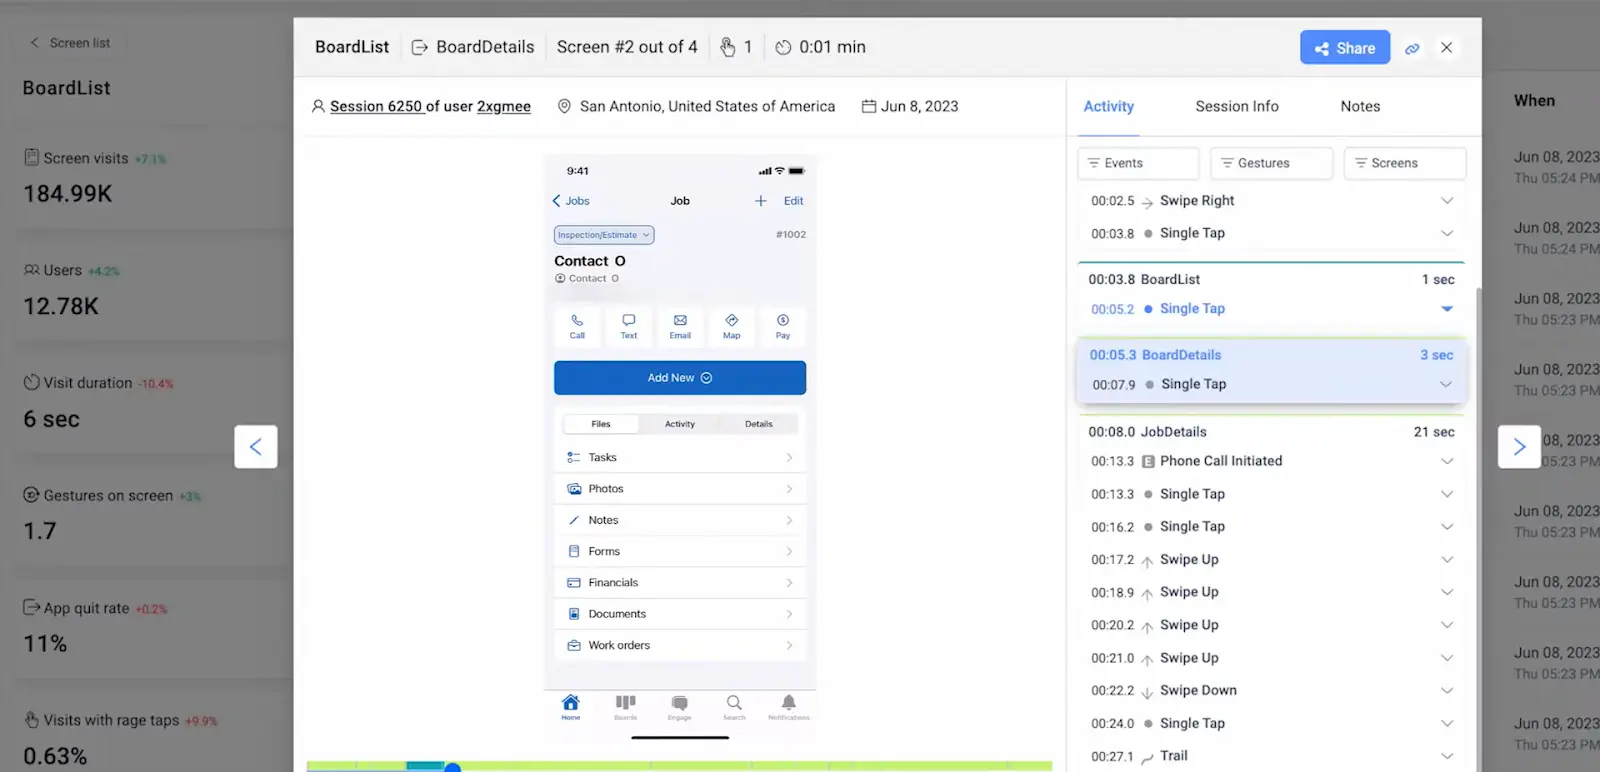
With UXCam, businesses can track user interactions within their mobile apps and identify pain points or areas where users may be experiencing difficulties. By analyzing user session recordings, heatmaps, and other metrics, businesses can gain a deeper understanding of user behavior and identify specific areas for improvement.
You can also build dashboards that track KPIs like churn rate in real-time.
How to calculate churn rate
You need three data points to calculate churn rate:
Total users at the start of the period.
Total users at the end of the period.
Total users gained over the period.
We start by subtracting users gained from the number of users at the end of the period. Then we subtract that amount from the number of users at the start of the period to get the number of lost users. We then divide lost users by the number of users at the start of the period and multiple by 100% to get churn rate.
Here’s the formula:
(Users at Start – (Users at End – New Users)) / Users at Start x 100% = Churn Rate


Now, let’s look at a couple of examples.
Churn rate example calculations
Say you have 1,000 users at the start of the month. At the end of the month, you have 1,100 users after adding 200.
(1000 – (1100 – 200)) / 1000 x 100% = 10%
Or say you had 500 customers at the start of the quarter. By the end of the quarter, you had 490 customers after adding 100.
(500 – (490 – 100)) / 500 x 100% = 20%
Remember, a lower churn rate is better, as it indicates that more customers are staying with your product or service. However, some level of churn is inevitable in any business, and what constitutes a “good” churn rate can vary widely depending on the industry and business model.
The average monthly churn rate for mobile apps is around 25%, based on industry benchmarks. However, this isn't a fixed number, and it can change a lot depending on different factors. For example, gaming apps may have a high churn rate of 50% or more, while financial apps may have a low churn rate of less than 10%.
Why is monitoring your app’s churn rate important?
Indication of app growth
Monitoring the churn rate of a mobile app is important for evaluating and sustaining its growth. A high churn rate indicates a risk to overall growth, as more users are leaving than joining, while a lower churn rate signifies a growing user base essential for long-term success.
Studies indicate that, on Day 1, the typical retention rate for 31 mobile app categories stands at 25.3%, decreasing to 5.7% by Day 30. The data underscore the challenge of retaining users over time, particularly in the initial days after installation.
Insights into user experience
An increasing churn rate serves as an alert to potential declines in user experience, prompting developers to investigate and resolve underlying issues. Monitoring the churn rate allows developers to proactively tackle problems that could result in user dissatisfaction and eventual app abandonment.
For example, the JobNimbus team grappled with a high churn rate and negative user reviews.


Recognizing that a significant portion of their user base preferred traditional methods to technology, the team thought of strategies to boost adoption and enhance the user-friendliness of their product.


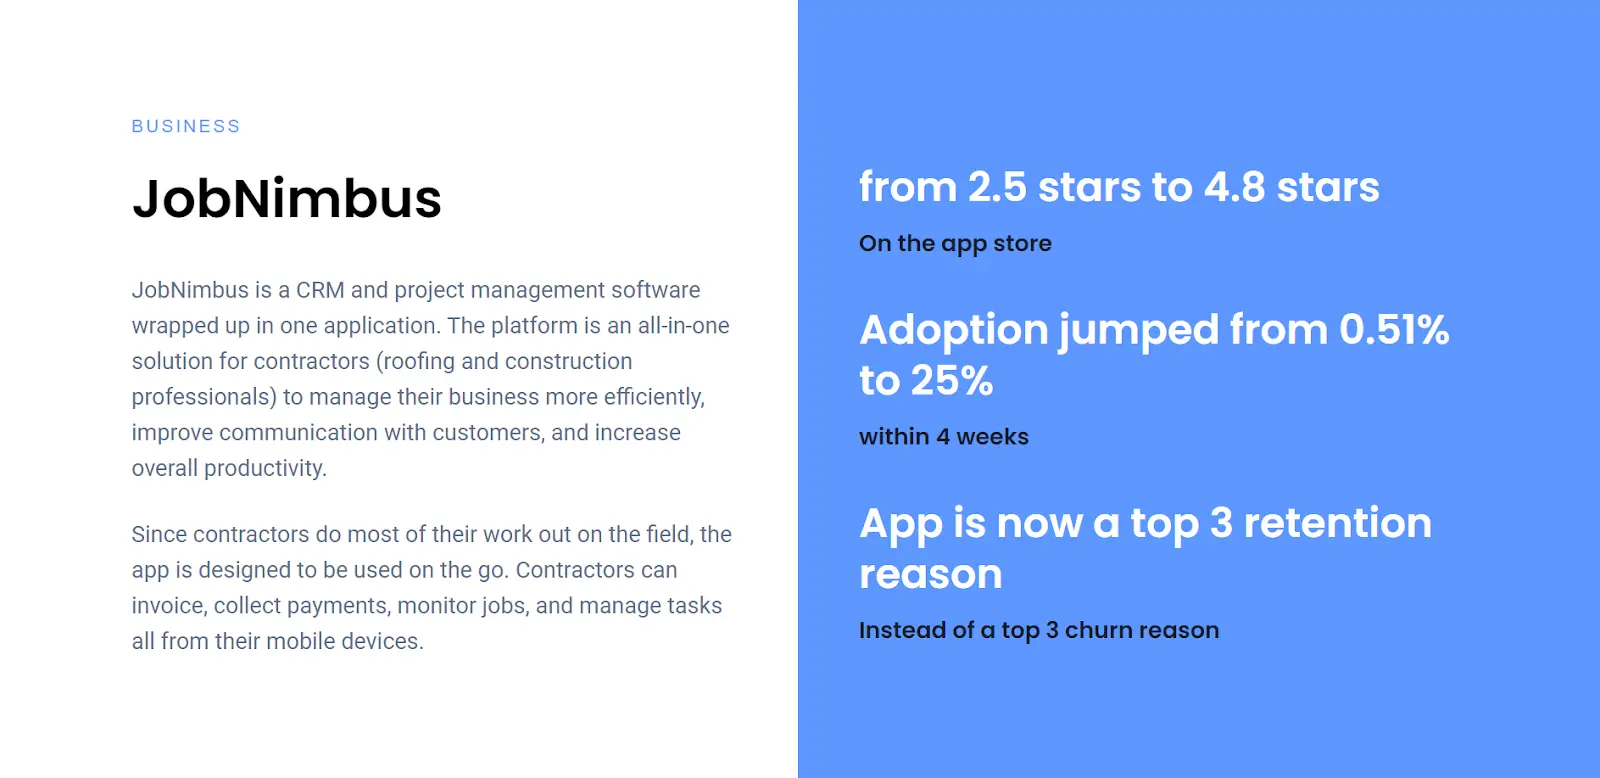
They used UXCam to gain valuable insights into the user experience and identify pain points in their app. By analyzing user behavior and interactions, they were able to understand why certain features were not being used effectively or causing frustration.
Accurate growth and revenue forecasting
Understanding the churn rate plays a pivotal role in making precise forecasts regarding app growth and potential revenue. This knowledge is essential for strategic planning and optimal resource allocation, enabling developers and stakeholders to make informed decisions based on the expected user retention and its impact on overall financial projections.
By knowing the expected user retention rate, for example, developers can allocate resources toward acquiring new users or focusing on customer retention strategies.
Conclusion
To run a successful business, it's important to grasp and calculate the churn rate. This metric gives valuable insights into customer retention and satisfaction, helping you identify areas for improvement.
By using a customer experience tool like UXCam, you can gain a more in-depth understanding of user interactions and behavior, which greatly helps in managing churn rates. UXCam allows businesses to understand their customers better, identify potential issues, and take proactive steps to improve the user experience, ultimately reducing churn rate.
Sign up for a free trial of UXCam today.
You might also be interested in these;
How to measure, analyze, and reduce app churn
How to increase mobile app retention: ultimate guide
Mobile app retention benchmarks by industries
AUTHOR
Tope Longe
Product Analytics Expert
Ardent technophile exploring the world of mobile app product management at UXCam.


Related articles

Mobile app analytics
12 Mobile App Analytics Metrics That Actually Matter in 2026
Mobile app analytics metrics are the quantitative signals product teams use to measure performance, engagement, and...


Silvanus Alt, PhD
Founder & CEO | UXCam


Mobile app analytics
Mobile App Retention Benchmarks by Industry (2026)
Mobile app retention benchmarks for 2026, broken down by industry. Day-1, day-7, day-30 retention rates for fintech, ecommerce, social, gaming, and more,...
Silvanus Alt, PhD
Founder & CEO | UXCam


Mobile app analytics
Sentry vs Datadog: Features, Pricing, and Which One Fits Your Production Stack
Sentry vs Datadog compared head-to-head on features, pricing, and the production stacks each one...
Silvanus Alt, PhD
Founder & CEO | UXCam