Android Crash Logs - A Complete Guide to Fixing App Crashes


As a mobile app product manager, UX designer, or engineer, you’ve likely faced the frustrating experience of a crashing app. It’s more than an inconvenience—it affects your users’ experience, damages your app’s reputation, and can even result in revenue loss.
But how do you fix app crashes? The answer lies in crash logs. These logs are essential for understanding what went wrong, why the crash happened, and how you can prevent it from occurring again. Without them, diagnosing the issue is like trying to fix a car without looking under the hood.
This is where UXCam steps in. UXCam not only helps you capture crash logs but also provides an all-in-one solution for tracking crashes, understanding user behavior, and analyzing app performance. By integrating crash logs with session replays, UXCam gives you a clearer view of the crash and the user journey that led to it.
In this guide, we’ll cover everything you need to know about Android crash logs. You’ll learn how to access and interpret these logs, how to diagnose and fix app crashes, and, most importantly, how UXCam enhances this entire process to make your life easier.
Ready to dive in? Let’s get started!
What is Android Crash Logs?
When your app crashes, it can feel like a mystery—one minute it’s working fine, and the next, it’s not. But every crash leaves behind a clue: a crash log. These logs act like a detailed report of what happened just before and during the crash.
Crash logs contain valuable information about the state of your app at the moment things went wrong. They capture error messages, stack traces, and system details, helping you pinpoint the exact cause of the crash. Think of them as a window into the app’s internal processes.
But why are these logs so critical? In Android development, crash logs are your key to fixing app issues quickly. They allow you to diagnose the problem, understand its root cause, and develop a solution before more users are impacted. Without them, you’re left guessing—and that’s never a good place to be when trying to ensure a smooth user experience.
In addition to helping you fix bugs, crash logs also play a crucial role in app performance and user experience. Every time your app crashes, users are frustrated. If the issue isn’t resolved promptly, you risk losing those users altogether. Crash logs give you the insight you need to prevent recurring issues and ensure your app runs smoothly.
Not all crashes are the same, though. In Android apps, crashes typically fall into several categories:
Unexpected exits: These happen when the app forcefully closes due to an unhandled error.
Exceptions: These occur when the app encounters an issue, like a missing file or bad input, that it can’t handle.
UI freezes: While not technically a crash, UI freezes happen when the app’s user interface becomes unresponsive, often due to too much processing on the main thread.
Understanding these different types of crashes is important because it shapes how you approach the fix. For instance, fixing an exception might involve better error handling, while resolving a UI freeze may require optimizing code that runs on the main thread.
By using crash logs, you’ll not only resolve these issues faster but also gain a deeper understanding of how your app behaves under stress—allowing you to build a more reliable, user-friendly product.
How to access and read android crash logs
So, you know crash logs are important, but how do you actually get your hands on them? The process might seem technical at first, but with tools like UXCam, accessing crash logs becomes much easier and more efficient.
Accessing crash logs for android devices
Using UXCam’s Issue Analytics, you can quickly access and analyze crash logs for your Android app. Once you’ve integrated UXCam into your app, all the necessary crash data gets captured automatically. You don’t need to manually dig through logs; UXCam gathers it all in one place.
To start, navigate to the Sessions tab in your UXCam dashboard. From there, you can filter by Crash Events or UI Freezes and locate the sessions that have experienced issues. UXCam also allows you to view session replays, so you can see exactly what the user was doing before the crash. This gives you context beyond just the raw data, helping you understand the sequence of events that led to the problem.
Diagnosing and fixing app crashes using crash logs
When your app crashes, the first step is to diagnose what went wrong. This might seem overwhelming, but by systematically analyzing crash logs, you can quickly identify the root cause and fix the issue before it impacts more users.
How to use crash logs to identify the cause of a crash
The key to diagnosing crashes lies in the crash log’s stack trace. This trace gives you a roadmap of what the app was doing just before it crashed. By reading the stack trace from bottom to top, you can see exactly where the error occurred in the code.
Start by identifying the exception type in the crash log. Is it a NullPointerException? This means the app tried to use an object that wasn’t properly initialized. Is it an out-of-memory error? This could indicate your app is using too many resources at once. Other common issues include network request failures or improper handling of user input.
Here’s a systematic approach to diagnosing crashes:
Identify the exception type: What kind of error is it?
Locate the file and line number: Where in the code did the error occur?
Examine recent changes: Did any recent updates or new features introduce this error?
By following these steps, you can pinpoint the specific part of your app that caused the crash.
How to interpret crash logs
Once you’ve accessed the crash logs, it’s time to make sense of the data. A typical Android crash log contains several key components:
Stack trace: This is the most important part of the crash log. It shows you the sequence of method calls that led to the crash, allowing you to trace the error back to the source code.
Exception type: The crash log will often display the type of exception that caused the crash, such as NullPointerException or ArrayIndexOutOfBoundsException. This gives you a quick indication of what went wrong.
Error codes and messages: These provide more detailed information about the nature of the crash. For example, an error code might indicate that a network request failed or that a certain file wasn’t found.
Example of a crash log and step-by-step analysis
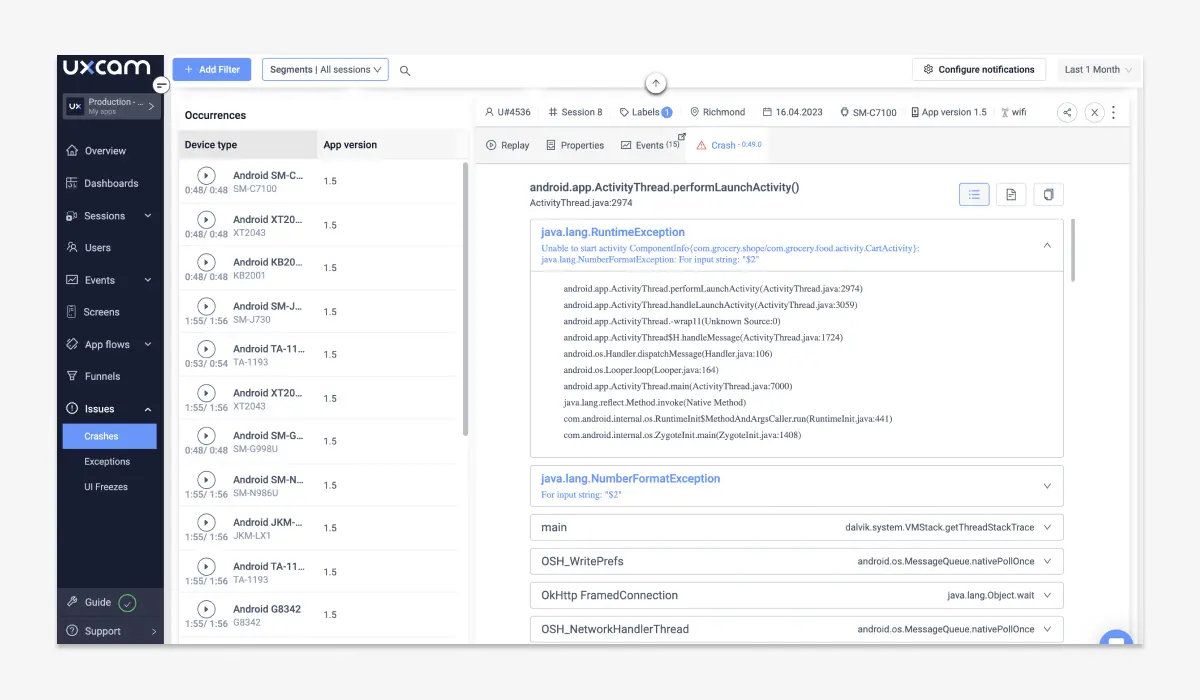
Here’s an example of a real crash log and how you can identify the root cause:


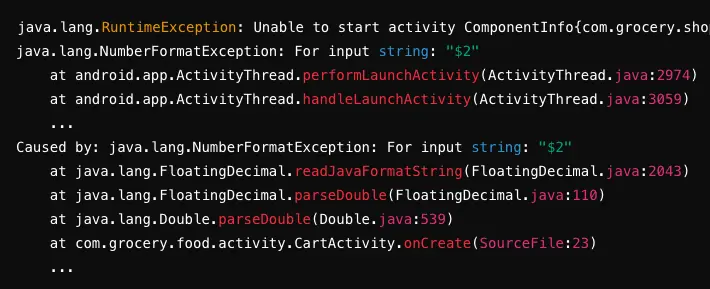
Let’s break this down step by step to identify the root cause:
Exception Type: The log clearly identifies a NumberFormatException caused by the input string "$2". This means the app is trying to convert the string "$2" to a number, but it fails because the $ symbol is not a valid character for numerical parsing.
Stack Trace: The stack trace shows that the error originates in the CartActivity class at line 23 during the onCreate ( ) method. This indicates that the crash happens when the activity is first created, likely when trying to process the price value "$2" as a number.
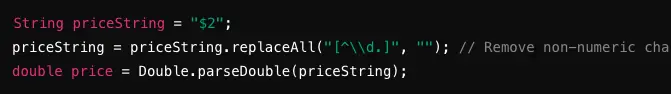
Root Cause: The exception occurs because the app is attempting to parse a string with a non-numeric character ($). The method "Double.parseDouble( )" is expecting a plain number, but the input string includes a dollar sign, which leads to the crash.
Solution: To fix this, you’ll need to modify the code in CartActivity.java at line 23. You should strip the non-numeric characters (like $) from the string before attempting to convert it to a number. For example:


Identifying the root cause with UXCam
With UXCam, the process of identifying the root cause becomes even easier. After locating the crash log in the session, you can watch the session replay to see how the user interacted with the app leading up to the crash. This added context helps you pinpoint the exact trigger.
For example, you might notice that the crash occurred when the user tapped a certain button, which led to the null pointer error. With this information, you can not only fix the bug but also improve the overall flow of your app to prevent similar issues from happening in the future.
By combining crash logs with UXCam’s session replays and filtering capabilities, you gain a clearer understanding of why crashes occur. This makes the process of diagnosing and resolving issues faster, allowing your team to deliver a smoother, more reliable user experience.
Fixing app crashes
Once you’ve identified the issue, the next step is to fix it. Let’s go over a few common crash types and how to resolve them.
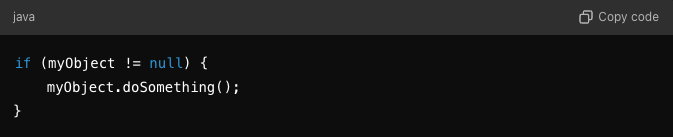
Null pointer exceptions: These occur when your app tries to use an object that hasn’t been initialized. To prevent this, always check for null values before accessing an object
![Null Pointer Exception Android Crash Log]()
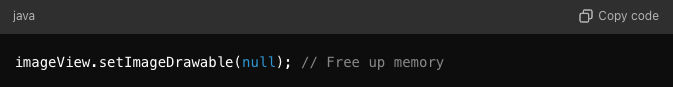
Out-of-memory errors: Apps can crash if they run out of memory, especially if you’re working with large files or images. One solution is to optimize memory usage by loading smaller images or clearing unused resources when they’re no longer needed:
![Out-of-Memory Errors Android Crash log]()
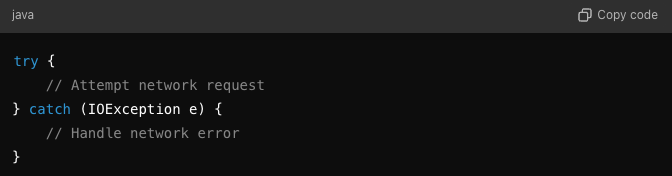
Feature network request: Network issues can cause crashes if the app doesn’t handle them gracefully. To fix this, make sure your app has proper error handling for network requests. For example:
![Failed Network Requests Android Crash Log]()


Preventing recurring crashes
After fixing the issue, test your app thoroughly to ensure the problem doesn’t recur. Update your code to handle similar scenarios more gracefully in the future. You can also set up automated testing to catch potential crashes before they reach users.
Enhancing Android crash logs analysis with UXCam
When it comes to understanding and fixing crashes, having all the information at your fingertips is crucial. UXCam simplifies this process by automatically capturing crash logs and session replays. This means you can track crashes and errors without manually pulling data from multiple sources.
With UXCam’s app log feature, you can view everything in one place. It captures crash events as they happen, along with detailed user session data. This allows your development and UX teams to see not only the error itself but also the user’s actions leading up to it.


How to improves error tracking and analysis
What sets UXCam apart is how it integrates crash logs with session replays. This means you’re not just looking at a technical error—you can actually watch how the user interacted with your app before the crash happened. It’s like watching a movie of the crash, offering context that a crash log alone can’t provide.
Let’s say your app crashes during checkout. UXCam allows you to filter by error types, device details, and even user behavior. You can then watch the exact moment the app crashed and analyze whether it was caused by a user action, device issue, or bug in the code.
This approach helps you prioritize fixes. Instead of wasting time on less impactful issues, you can focus on the crashes that affect the most users or cause the most disruption.
For more information, check out UXCam’s App Logs Documentation.
How to track UI freezes with UXCam
Crashes aren’t the only problem that can frustrate users. UI freezes happen when the app becomes unresponsive, often caused by long-running tasks on the main thread. While these freezes don’t force the app to close, they can be just as damaging to the user experience.


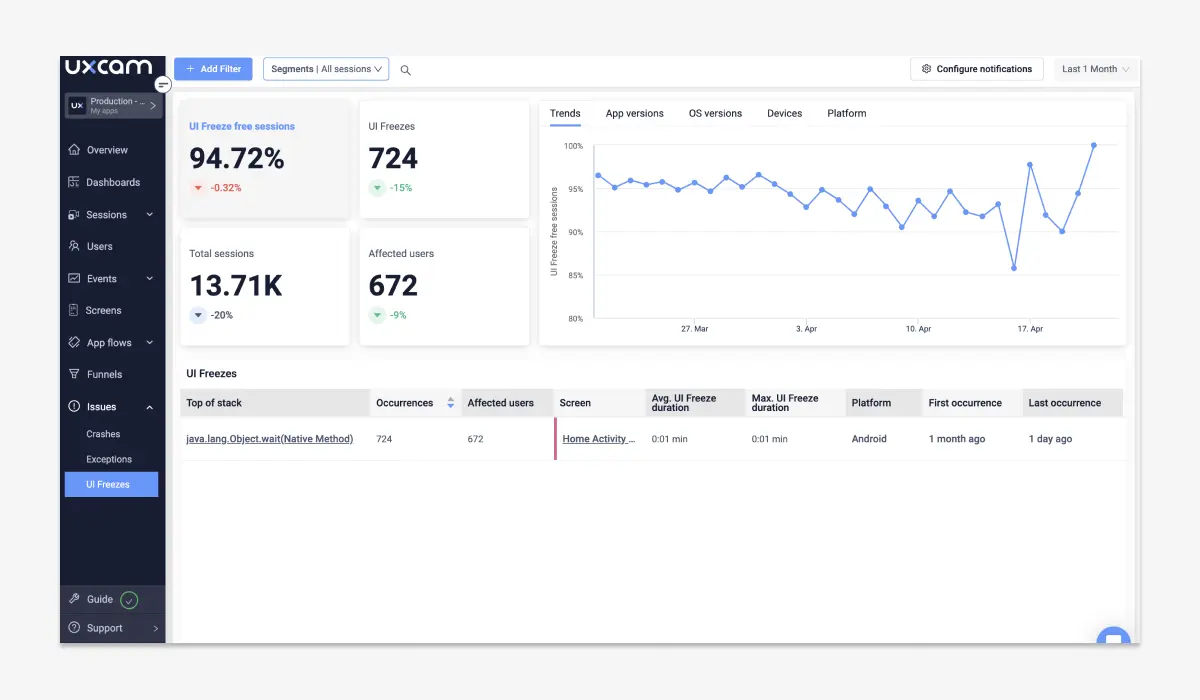
UXCam automatically detects UI freezes, logs them, and captures the session replay so you can see exactly when and where the app became unresponsive. This lets you pinpoint whether the freeze happened due to a slow network call, heavy processing, or another issue.
Tracking UI freezes is just as important as tracking crashes because they can affect user satisfaction and retention. UXCam makes this easy by categorizing and logging freeze events separately, so you can quickly identify and resolve them.
For more on this, check out UXCam’s UI Freeze Events Documentation.
Automating crash reporting with UXCam
Setting up automated crash logging and reporting with UXCam is straightforward. From your UXCam dashboard, navigate to your app settings and enable crash logging. UXCam will then start automatically capturing crash events, along with detailed session data.
But UXCam doesn’t stop at just capturing the data. You can also integrate UXCam with tools like Slack and Microsoft Teams to get real-time notifications whenever a crash occurs. This means your team can respond immediately, minimizing downtime and improving user experience.


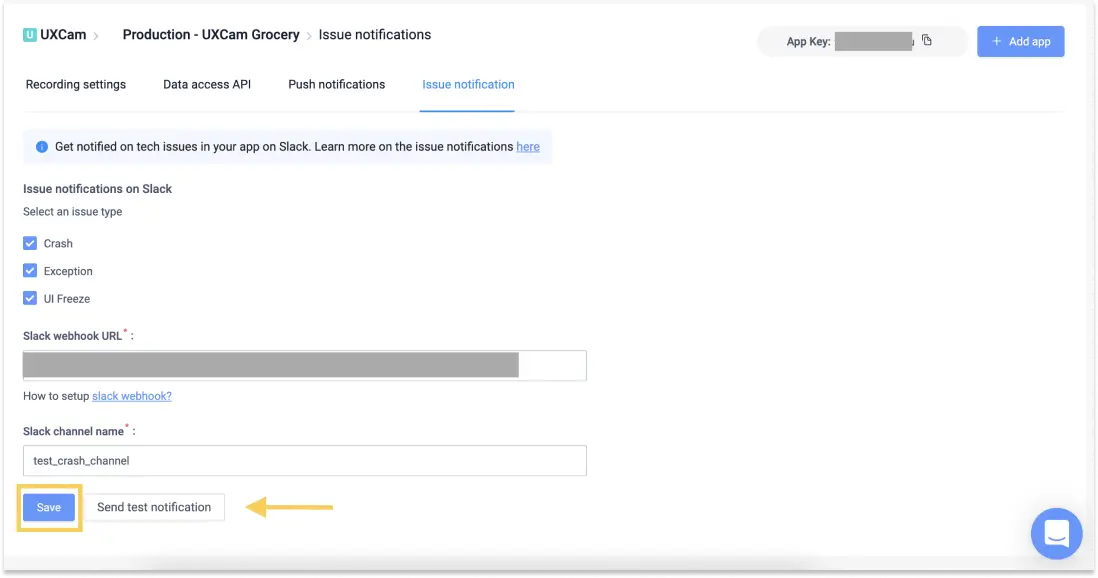
By automating crash reporting, you ensure that no issue goes unnoticed, and your team is always in the loop. To get started, explore UXCam’s guide on Notifications for Crash Issues.
Conclusion
App crashes are more than just technical glitches—they directly impact user satisfaction, retention, and the overall success of your mobile app. That’s why analyzing and resolving crashes quickly and effectively is so crucial for every mobile development team.
By thoroughly analyzing crash logs, you gain insights into what went wrong, allowing you to address the root causes and prevent future crashes. However, doing this manually can be time-consuming and inefficient. That’s where UXCam comes in.
UXCam offers a comprehensive solution that automatically captures crash logs, session replays, and UI freezes. It provides your team with all the data and context needed to track, diagnose, and fix issues efficiently. From filtering crashes by error type to viewing user interactions before a crash, UXCam simplifies and accelerates the troubleshooting process.
When you integrate UXCam into your workflow, you’re not just fixing bugs—you’re enhancing the entire user experience by ensuring smoother performance and quicker resolutions. If you want to deliver a more reliable app and stay ahead of potential issues, now is the time to integrate UXCam into your crash reporting and error analysis process.
Take the next step toward a more stable app by leveraging UXCam’s powerful crash analysis tools and real-time insights. Your users—and your team—will thank you!
You might also be interested in these;
How to Figure Out Why Your Apps Keep Crashing Android Crash Reporting: Best Tools
Crashlytics React Native Reviewed and Best Alternative
Flutter Crash Reporting - Best Tools and Techniques
AUTHOR
Tope Longe
Product Analytics Expert
Ardent technophile exploring the world of mobile app product management at UXCam.


Related articles


App Analytics
Top 19 Mobile App Analytics Tools in 2026
Choosing the best mobile app analytics tools and platforms for your app can be overwhelming. We did the research, so you don't have...


Jonas Kurzweg
Product Analytics Expert


App Analytics
Best Android App Analytics Tools in 2026
Discover the top 8 Android analytics including UXCam, Firebase, and Flurry Analytics. Compare features, pricing, and platforms...


Annemarie Bufe
Product Analytics Expert
Curated List
Top 19 Mobile App Analytics Tools in 2026
Discover the top mobile analytics tools in 2026. Compare features, pricing, and reviews to choose the right platform for app tracking, behavioral insights, and data-driven...
Jonas Kurzweg
Product Analytics Expert