How to Run an Effective Churn Cohort Analysis with UXCam


The cost of acquiring new users is on the rise.
As a result, customer retention has become a requirement for success in the mobile app space. Mobile app PMs are increasingly turning to advanced analytical techniques to understand what makes customers stay or go so that they can replicate successes and avoid repeat failures.
Mobile app churn cohort analysis is one of the more powerful and popular techniques.
In this guide, we will walk you through the basics of churn cohort analysis and how it can help you gain valuable insights into your app's user retention. We’ll also explain how UXCam helps make this process easier for you.
Let’s dive in.
Helpful summary
Overview: This article introduces churn cohort analysis and discusses how UXCam supports a comprehensive analysis strategy.
Why you can trust us: We have a proven track record of helping businesses reduce churn with features like cohort analytics, session replays, funnels, and event analytics.
Why this is important: Churn cohort analysis highlights and helps teams understand churn patterns and trends. The data supports hypotheses for iterative improvements in addressing churn-related issues.
Action points: We recommend leveraging behavioral cohorts to understand empathically why users churn. Segment users based on their actions or behaviors to develop specific hypotheses about the factors contributing to churn.
Further research: Check out our articles on calculating churn rates and churn rate benchmarks for more information.
Why listen to us?
At UXCam, we’re leaders in mobile app analytics. Our deep product and behavior insights have helped over 37,000 product teams understand and reduce churn.
Take JobNimbus, for example.


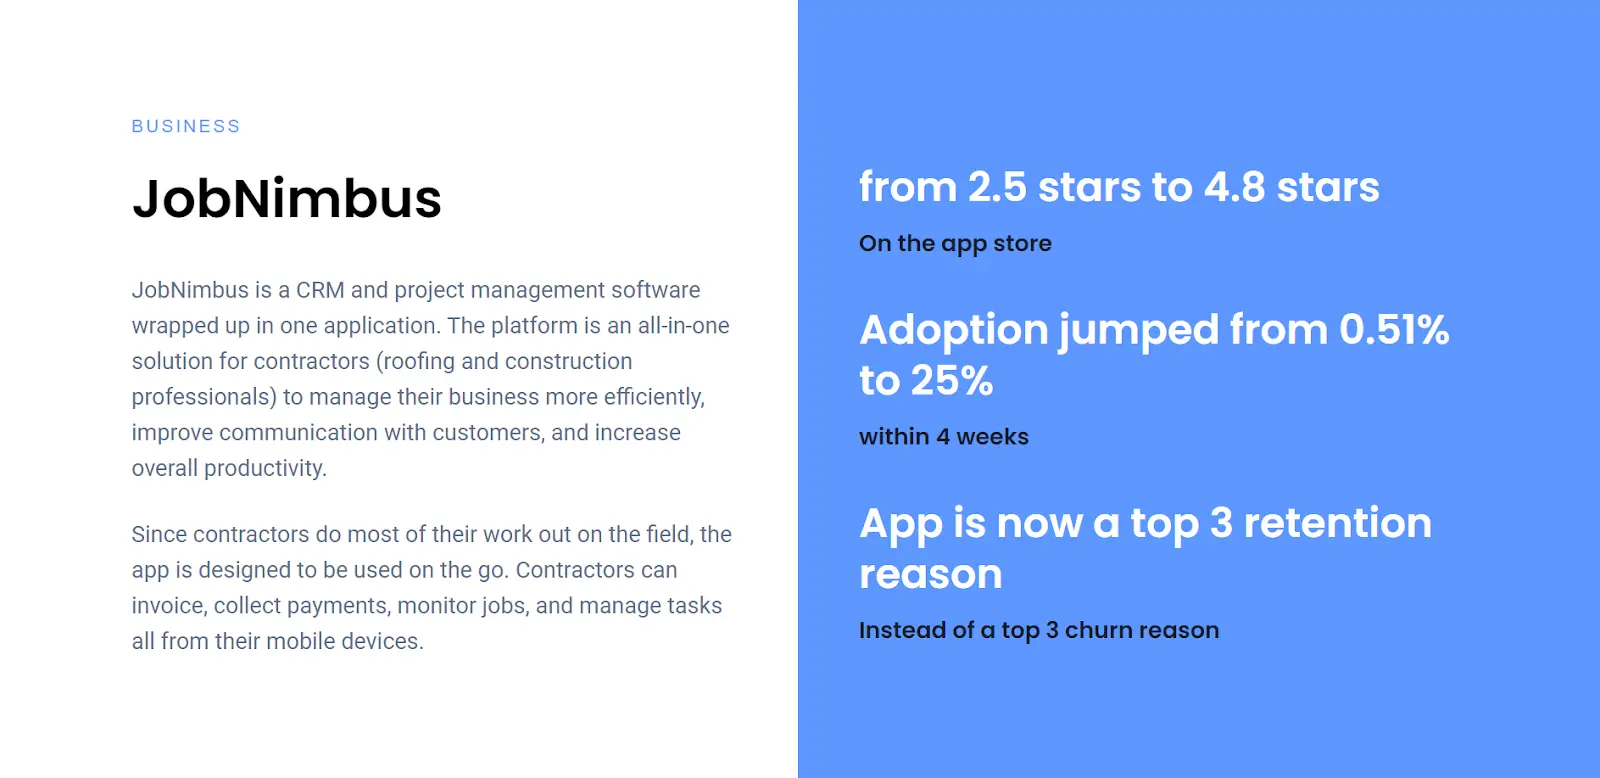
They had a 2.4-star app store rating and their app was a top three reason for churn rather than the asset it should have been. By leveraging our insights, they completely re-designed their app, which boosted their app rating to 4.8 stars.
What is churn cohort analysis?
Churn cohort analysis is an analytical process used to examine customer churn over time within defined groups (known as cohorts). What is a cohort, you ask? A cohort is a user segment with an added dimension of time.
A segment is a group that’s united by a similar demographic or behavior pattern—like “paid users”. To make a segment into a cohort, we use time as the common denominator, like “paid users who signed up in May”.
And—putting it all together—if we track and analyze how specific cohorts churn and retain over time, we’re doing churn cohort analysis. For example, we might compare “paid users who signed up in May” to “paid users who signed up in June” to see if there are any differences in churn rates between these two cohorts.
Why is churn cohort analysis important?
It is essential for mobile apps because it allows businesses to understand how different user groups engage with their products and use those insights to improve customer retention, ultimately reducing churn and increasing revenue.
Other benefits include:
Identifies churn moments: Through acquisition cohorts segmentation, mobile app teams can pinpoint typical app disengagement times for targeted actions to enhance retention.
Deep behavioral insights: Behavior cohorts allow teams to understand which specific app actions correlate with retention or churn. For example, users who perform specific actions like adding friends or making in-app purchases tend to become loyal customers.
Product and user flow optimization: Product teams can use cohort analysis as a reality check against their intended user flow and product usage. It can highlight friction points in the user experience, leading to drop-offs and providing a roadmap for product improvements.
Marketing and engagement strategy: Cohort analysis can inform marketing strategies by revealing which acquisition channels are most effective and which user behaviors are linked to higher lifetime value (LTV). This can help allocate marketing resources more efficiently and tailor engagement campaigns to user preferences.
Improving lifetime value (LTV): Examining cohorts of highly engaged users, product teams can derive strategies to encourage similar behaviors in new users, thereby increasing the LTV and supporting sustainable growth for the app.
How to perform churn cohort analysis for mobile apps
Step 1 - Set a clear goal and decide what to measure
Start by deciding what you want to achieve with the churn cohort analysis.
There are all kinds of interesting insights you can gain from this type of analysis, so it’s important to have a clear goal in mind. Do you want to understand why some users churn while others stay engaged? Or do you want to identify which acquisition channels are leading to the most valuable users?
Once you have a specific goal in mind, choose the metrics that will help you measure progress towards that goal. This could include retention rates, customer lifetime value (CLV), or churn rate.
Step 2 - Define your cohort
When defining cohorts, consider the following tips to make sure your analysis yields actionable insights:
Aligning cohorts with the business cycle: Define cohorts to align with your product’s business cycles and customer usage patterns. For example, for a fitness app, you could consider weekly cohorts to account for regular exercise routines.
Factor in user acquisition sources: Consider the different channels through which users are acquired. Users from various sources may have different expectations and behaviors, influencing churn rates.
Incorporate user behavior and characteristics: Define behavior cohorts based on user actions within the app, like feature usage, in-app purchases, or level of engagement. Additionally, demographic factors like age, location, or device type can be used to create cohorts exhibiting different churn patterns.
Step 3 - Use a tool to visualize and track cohort behavior
Choose a platform that allows you to visualize and track the behavior of different cohorts over time. Here’s what you should consider when choosing and why product teams prefer UXCam.
Compatibility and integrations
Make sure the tool integrates seamlessly with your existing applications and data sources. UXCam's powerful integrations can allow teams to pair with CRM tools to track customer acquisition information, for example.
Customization
Look for software that allows you to tailor cohorts. UXCam defines cohorts based on user actions so that you can create cohorts tailored to their needs. You can also manage cohorts through our dashboards—making it easier to investigate engagement, adoption, and other aspects.


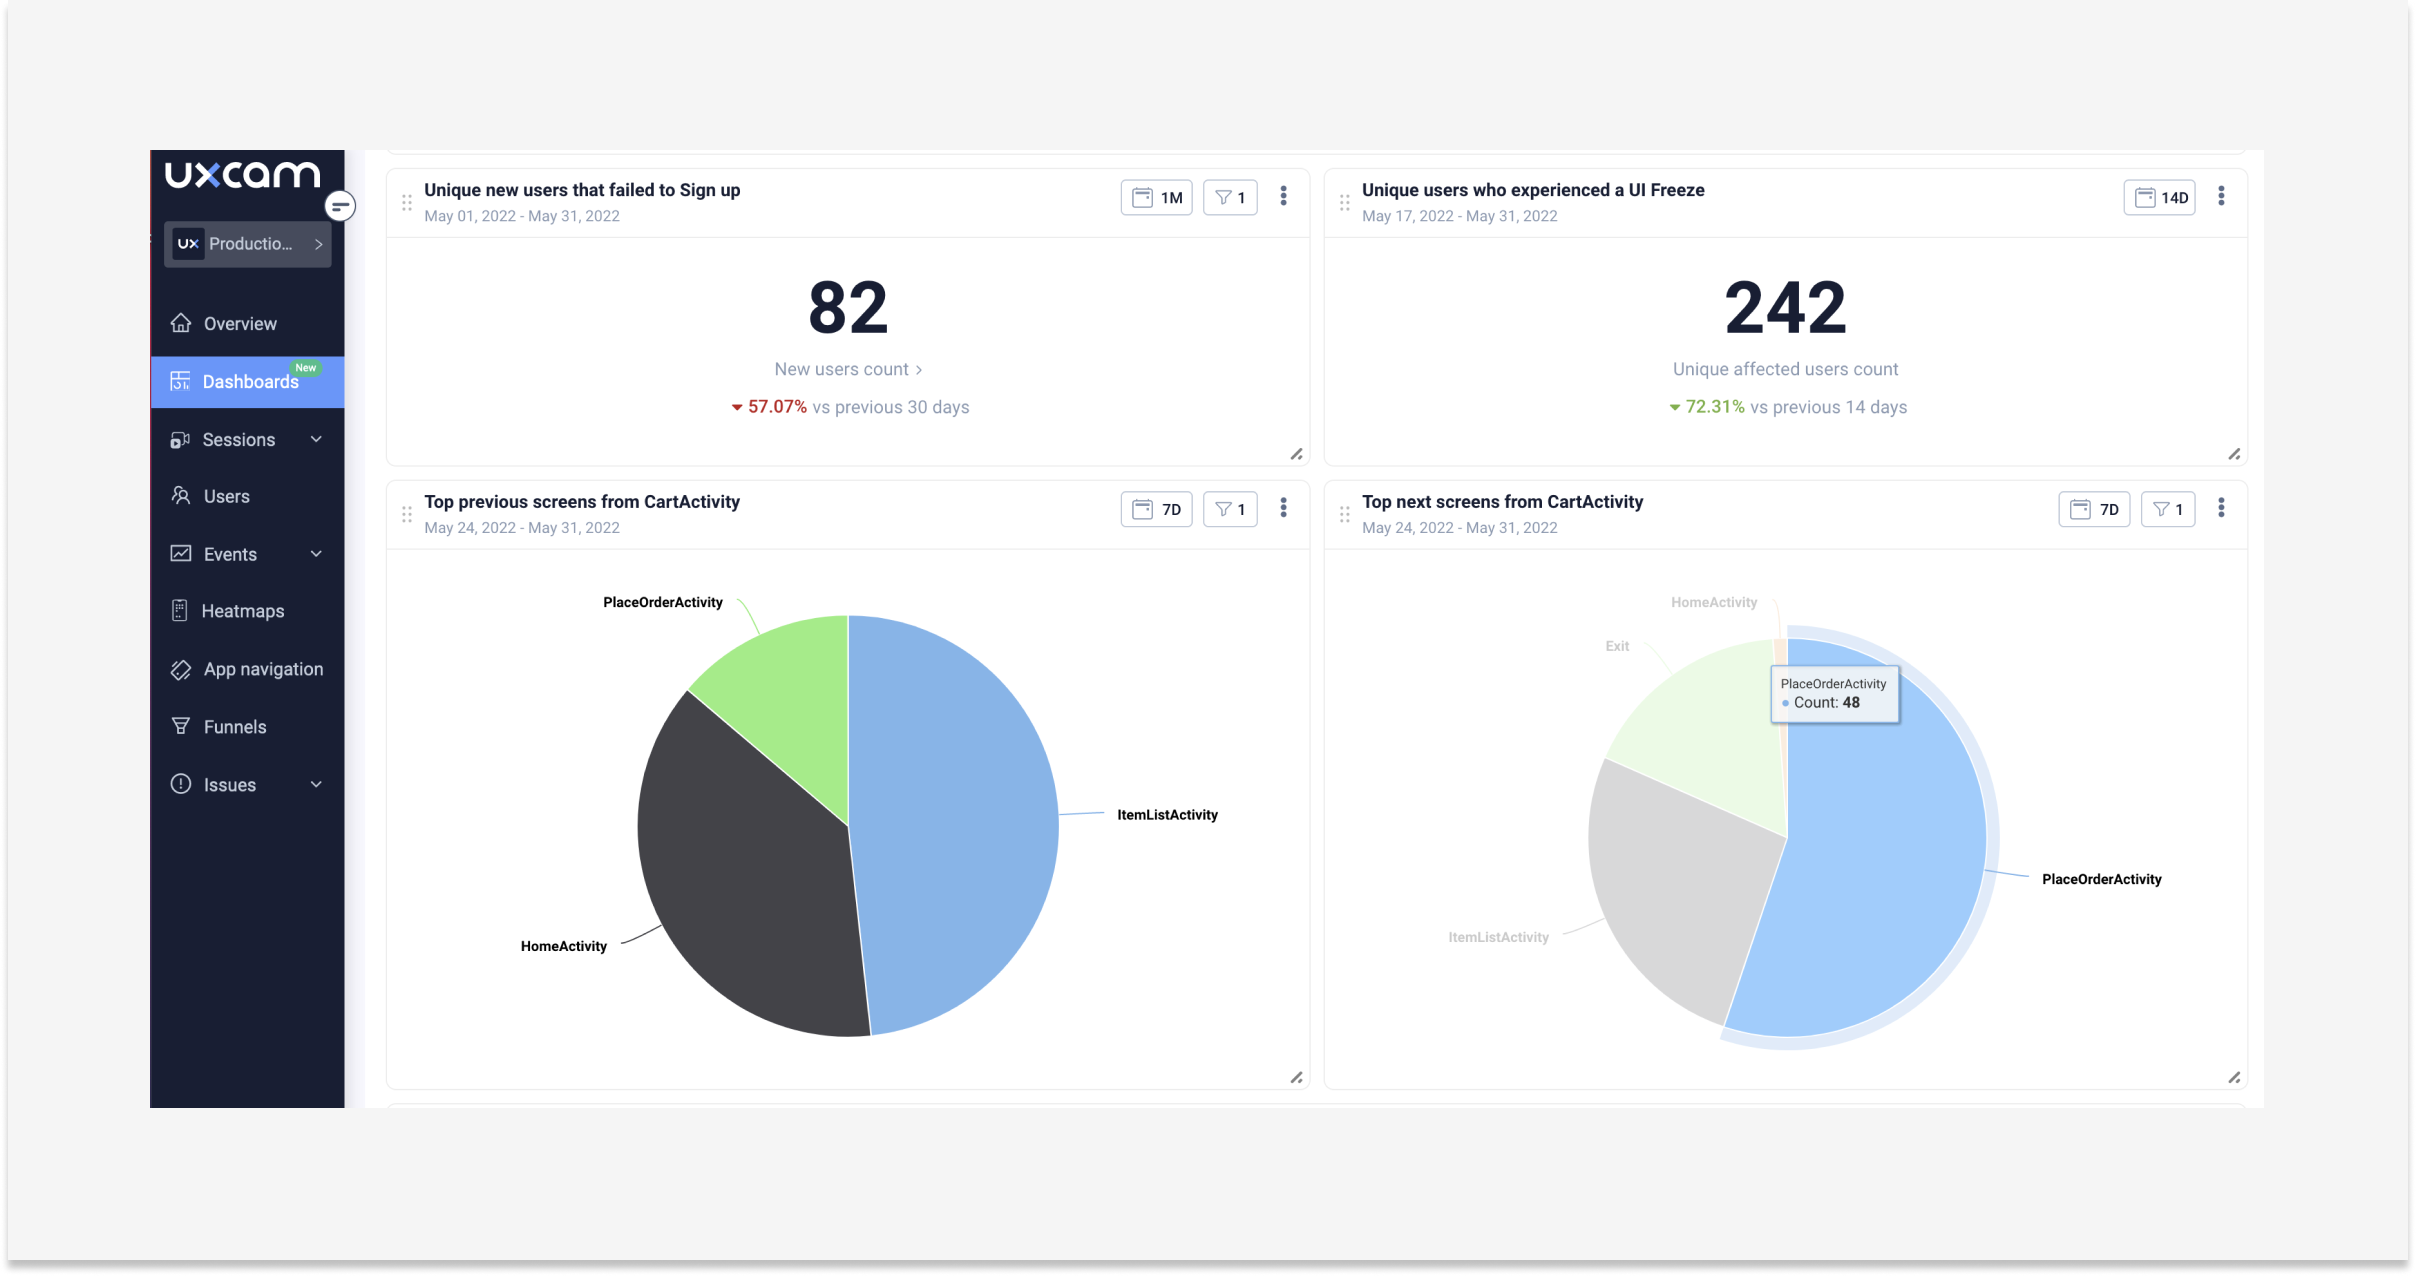
Clear information visualization
Choose a tool that provides clear information visualization. UXCam facilitates churn cohort analysis through color-coded cohort tables to quickly identify patterns and trends. Our segmentation feature enables cohort analysis and behavior comparisons with screen flow information.
Data accuracy and GDPR compliance
UXCam is known for the best data accuracy for several reasons:
Lightweight SDK: Our SDK captures accurate data while maintaining smooth performance.
Legally compliant architecture: The platform's architecture keeps data safe by automatically blocking sensitive fields and providing the right tools to prevent sensitive data from leaving the user's device.
Data and security compliance: UXCam has achieved SOC 2 certification, and our compliance includes GDPR and CCPA.
Step 4 - Identify churn points
Next, identify churn points throughout the customer lifecycle. Here are our features and functionality that help product teams to do this effectively:
Cohort analytics
UXCam's Cohort Analytics feature allows teams to define and analyze cohorts based on user actions, enabling them to gain insights into user behavior and retention trends.
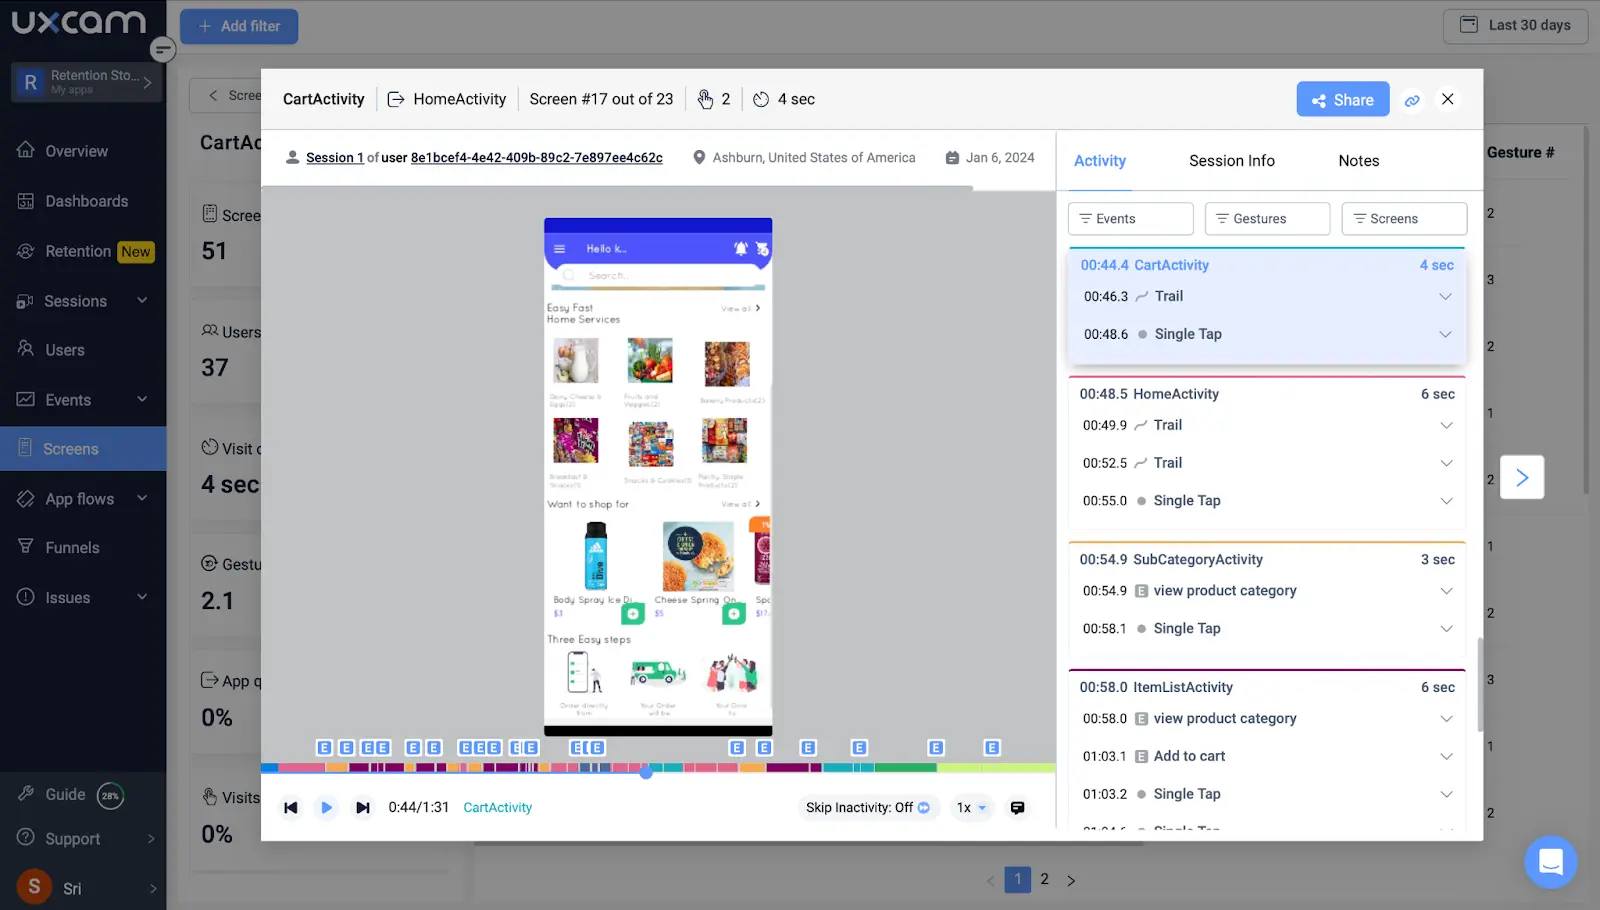
Session replay
By using our Session Replay feature, teams see user interactions and behaviors firsthand, which can help identify patterns and issues leading to churn.


Event analytics
Our Event Analytics feature enables teams to track custom events, add funnels, and conduct retention cohorts analysis to reveal specific user actions or events associated with churn points.
Retention analytics
UXCam provides a dedicated Retention Analytics feature that provides customizable retention reports, allowing teams to track usage patterns, identify popular features, and better understand user behavior beyond just retention, which can help pinpoint churn points.


User segmentation
Product teams can group users by demographics, behavior, and engagement levels. This helps identify segments with higher churn rates. Our pre-configured filters assist in targeting patterns of disengaged users for deeper insights into churn reasons.


Step 5 - Analyze, develop, and test hypothesis
This phase is crucial for understanding and addressing churn, so after:
Identifying churn points in the customer’s life cycle
Pinpointing specific user behaviors or activities that correlate with retention or churn and understanding why different user groups churn
…you’ll need to…
Formulate hypothesis
Formulate a hypothesis for why users are churning based on your analysis.
Ensure your hypothesis outlines the expected impact your redesign will have on user behavior, churn, engagement, or specific metrics.
It serves as a guiding theory for the redesign process and should be used to focus efforts on achieving specific outcomes. A design hypothesis influences the design and solution, provides much-needed context, and heavily influences the outcome.
Test
By testing the hypothesis, you can:
Validate assumptions: Make sure that the redesign addresses the identified churn points and leads to improved user behavior and retention.
Measure impact: Quantify the impact of the redesign on user behavior, engagement, and retention, providing tangible evidence of its effectiveness
Make iterative improvements: Enable iterative improvement using data-driven insights to refine the redesign and continuously enhance UX, to ultimately, reduce churn and improve retention.
Use UXCam for a data-driven approach to churn cohort analysis
A data-driven approach to decision-making based on cohort analysis empowers teams to craft experiences that resonate with users over the long term.
The insights drawn from churn cohorts are invaluable, leading to informed enhancements in your app that foster long-term user retention. Consider UXCam to transform your churn reduction strategies from reactive to proactive, mitigating churn before it becomes a significant issue.
Ready to take the next step in revolutionizing your app's user experience? Sign up for a free account or request a demo and pave the path towards a retention-focused app.
You might also be interested in these;
How to analyze session recordings
How to calculate churn rate for mobile apps product
Mobile app churn rate & key benchmarks 2024
Churn rate vs retention rate - Understanding the difference
AUTHOR
Tope Longe
Product Analytics Expert
Ardent technophile exploring the world of mobile app product management at UXCam.


Related articles


Mobile app analytics
12 Mobile App Analytics Metrics That Actually Matter in 2026
Mobile app analytics metrics are the quantitative signals product teams use to measure performance, engagement, and...


Silvanus Alt, PhD
Founder & CEO | UXCam


Mobile app analytics
Mobile App Retention Benchmarks by Industry (2026)
Mobile app retention benchmarks for 2026, broken down by industry. Day-1, day-7, day-30 retention rates for fintech, ecommerce, social, gaming, and more,...
Silvanus Alt, PhD
Founder & CEO | UXCam


Mobile app analytics
Sentry vs Datadog: Features, Pricing, and Which One Fits Your Production Stack
Sentry vs Datadog compared head-to-head on features, pricing, and the production stacks each one...
Silvanus Alt, PhD
Founder & CEO | UXCam