Back to blog
6 MIN READ
16 Top Customer Experience Metrics To Track 2025
PUBLISHED
16 November, 2024

Product Analytics Expert
The first step in user-centric development is collecting data on customer experience (CX). It allows you to make informed decisions about product features, customer service, and the overall user experience.
At UXCam, we’ve seen the power of tracking (and acting on) CX metrics firsthand. Our customers achieve unbelievable results by implementing customer experience monitoring data into their product decisions.
Read on for our top tips on tracking and monitoring customer experience metrics.
Summary - 16 Top Customer Experience Metrics
| Metric | Focus Area |
|---|---|
| Net Promoter Score (NPS) | Customer loyalty and likelihood of recommendations. |
| Customer Satisfaction (CSAT) | Satisfaction with a specific interaction or experience. |
| Customer Churn Rate | Percentage of customers discontinuing app use over time. |
| Customer Retention Rate | Percentage of customers continuing app use over time. |
| Customer Lifetime Value (CLV) | Total revenue expected from a customer during their relationship with the app. |
| Active Users | Number of users engaging with the app within a defined period. |
| Session Duration | Average time users spend in the app per session. |
| Screen Flow Analysis | User navigation paths to identify popular routes and drop-off points. |
| Bounce Rate | Percentage of users leaving the app after viewing only one screen. |
| System Usability Scale (SUS) | Perceived usability through a standardized questionnaire. |
| Task Success Rate | Percentage of successfully completed user tasks within the app. |
| Customer Effort Score (CES) | Ease with which users accomplish tasks or resolve issues within the app. |
| Time to Task Completion | Average time users take to complete specific tasks within the app. |
| Conversion Rate | Percentage of users performing a desired action, such as making a purchase. |
| Abandonment Rate | Percentage of users starting but not completing a specific process or task. |
| Revenue per User (RPU) | Average revenue generated per user over a defined period. |
What are customer experience metrics?
Customer experience metrics are quantitative and qualitative measurements that assess how customers perceive their interactions with a product, service, or brand.
These metrics offer valuable insights into:
Customer satisfaction
Product/service performance
Brand loyalty
Customer engagement
Customer feedback
This data helps you understand the user journey and identify areas for improvement. Tracking CX metrics also allows you to measure the effectiveness of changes made to improve user satisfaction.
How do you track them? With a combination of surveys, polls, and analytics tools (like UXCam).
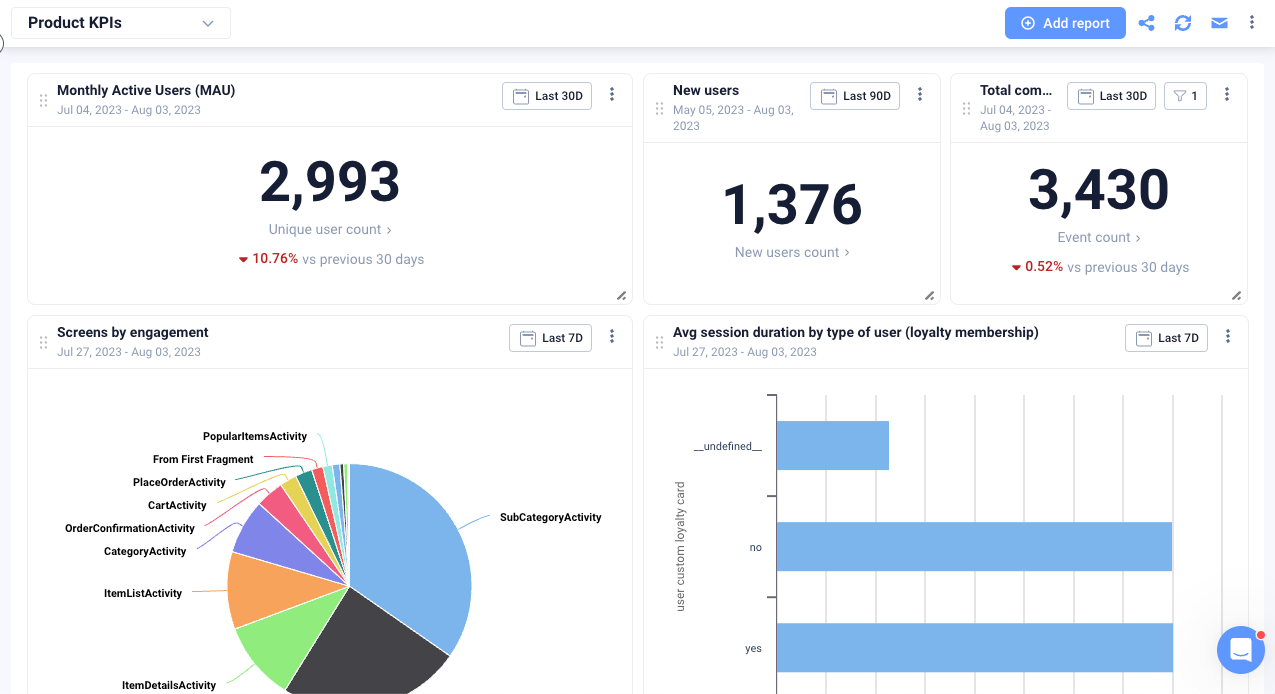

UXCam uses tagless autocapture to monitor every interaction a user has with your mobile application—taps, swipes, session lengths, feature usage, and more. This allows you can quantify different aspects of CX and identify areas for improvement.
Key customer experience metrics for mobile apps
User satisfaction metrics
Net Promoter Score (NPS): This score measures the likelihood of customers recommending your product to others.
Customer Satisfaction Score (CSAT): This measures customer satisfaction with a particular interaction or experience.
Customer Churn and Retention: This measures how many people stop using your app (Churn) and how many continue using it (retention).
Customer Lifetime Value (CLV): This metric represents the predicted total value a customer can bring to a business.
Engagement metrics
Active Users: This is the number of users actively interacting with your product.
Session Duration: This looks at the length of time users actively engage with your product within a single session.
Screen Flow Analysis: This is a visualization technique rather than a metric—but it’s still a powerful CX tool. It tracks and analyzes user flows and generates a map that highlights happy paths and areas with high dropoffs.
Bounce rate: This metric shows a lack of engagement by measuring the percentage of people leaving your product after viewing one screen or page.
Usability metrics
System Usability Scale (SUS): This popular questionnaire is a “quick and dirty” tool for evaluating how customers perceive the usability of your product.
Task Success Rate: This is the percentage of completed tasks.
Customer Effort Score (CES): This measures how easy or difficult it is to complete a task or resolve an issue.
Time to Task Completion: This metric is another way to measure your products’ effectiveness by measuring the time taken to complete a task.
Conversion metrics
Conversion Rate: This metric measures the number of users who take a desired action, like subscribing to a paid plan.
Abandonment Rate: This measures the number of people who desert a task before completion.
Revenue per User (RPU): This calculates the average revenue generated by a user for customer value insight.
Cost per Acquisition (CPA): This metric looks at the average money spent to acquire one customer or conversion.
Best practices for tracking and measuring the customer experience
1. Set clear goals and objectives
Determine the critical business objectives and outcomes you hope to achieve through measuring CX. Make sure goals are specific, measurable, and attainable—for example, “to increase NPS by 10 points within six months”.
Overarching goals can be broken down into smaller (but still measurable) objectives for better tracking. For our example goal, one objective could be “to reduce the time to first response by 10% within two months”.
This is a smaller goal that (we hypothesize) will help us make progress toward the overall objective of increasing NPS.
2. Choose the right metrics for your product
Identify the metrics that correspond with the aspects of the customer experience you want to measure.
Matching CX metrics and KPIs with goals and objectives is usually a matter of common sense. If you’re trying to improve customer retention, then churn rate is a key metric you should track. If you’re looking to increase conversion rates, then tracking the percentage of visitors who purchase from your site will be important.
3. Leverage customer experience tools
User behavior analytics tools like UXCam can give you a major advantage in understanding CX.
These tools track user interactions, allowing you to identify potential pain points and areas of improvement. They can also provide valuable insights into how customers interact with your website or app, so you can optimize the design for better engagement.
For example, take UXCam’s User Journey Analysis features.
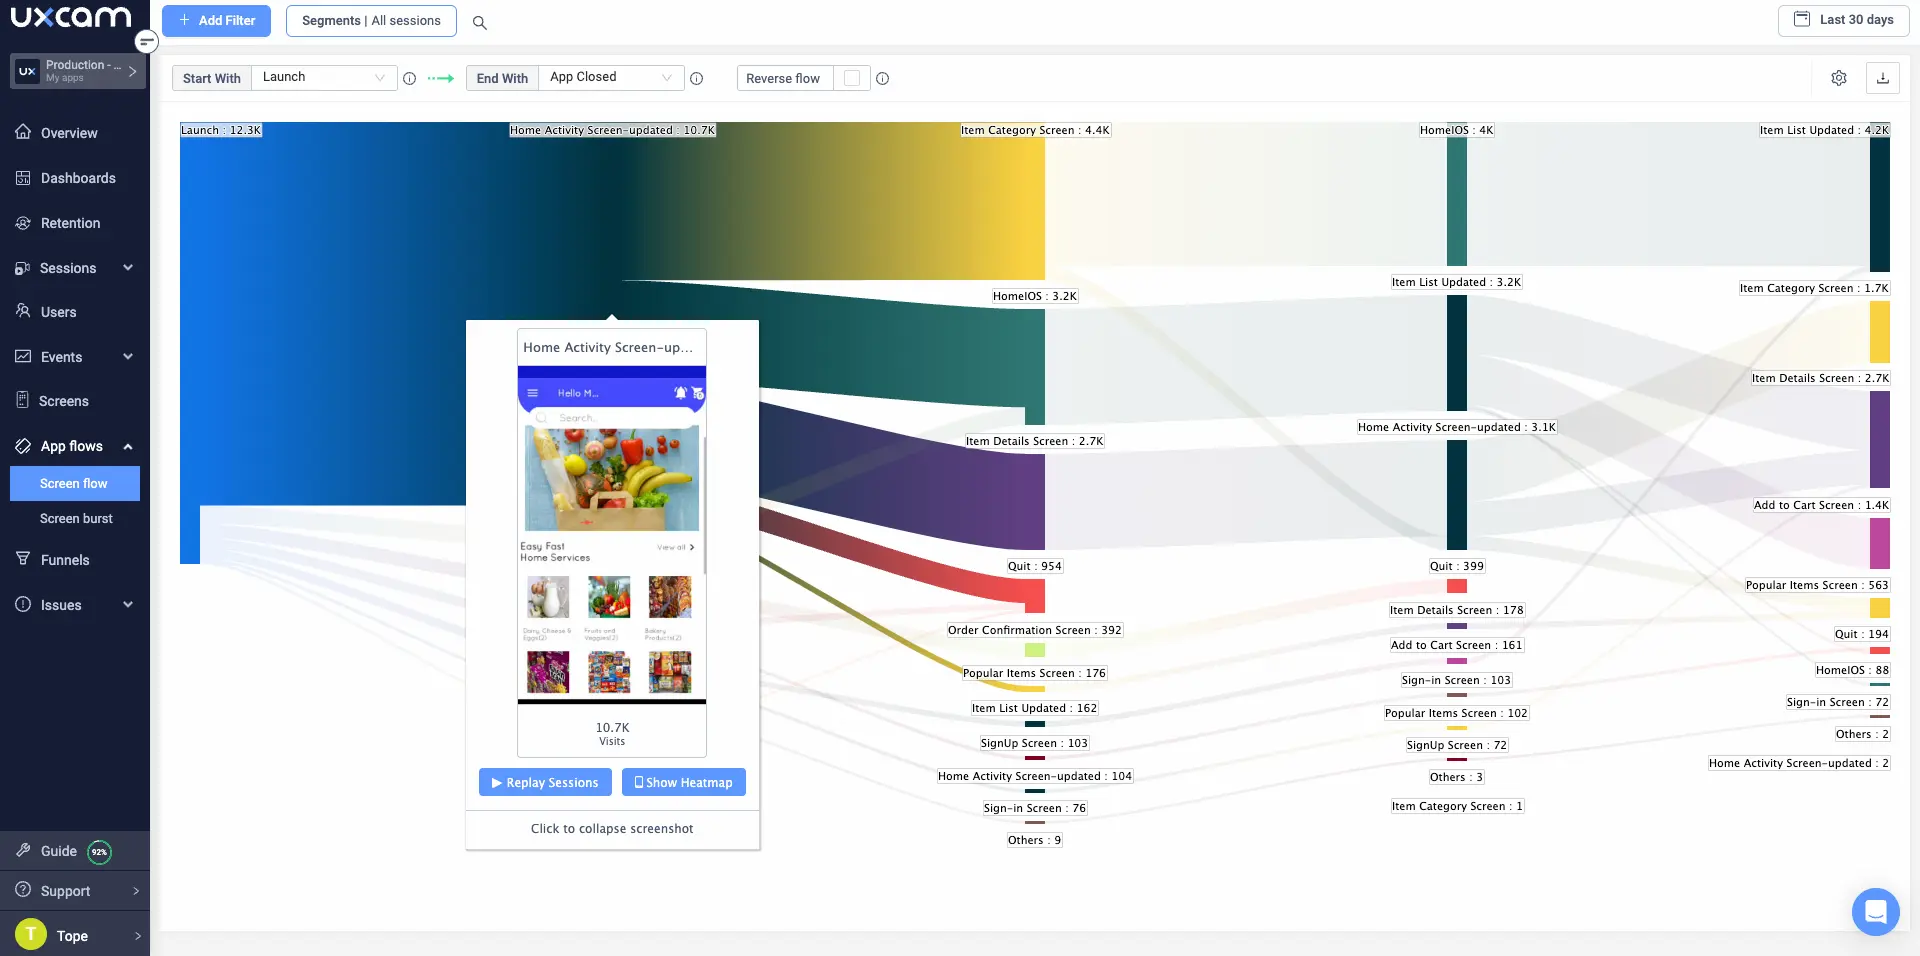
You can use the Screen Flow visualization to see how specific customer groups move through your app’s various flows—specifically, which paths are most (and least) effective.
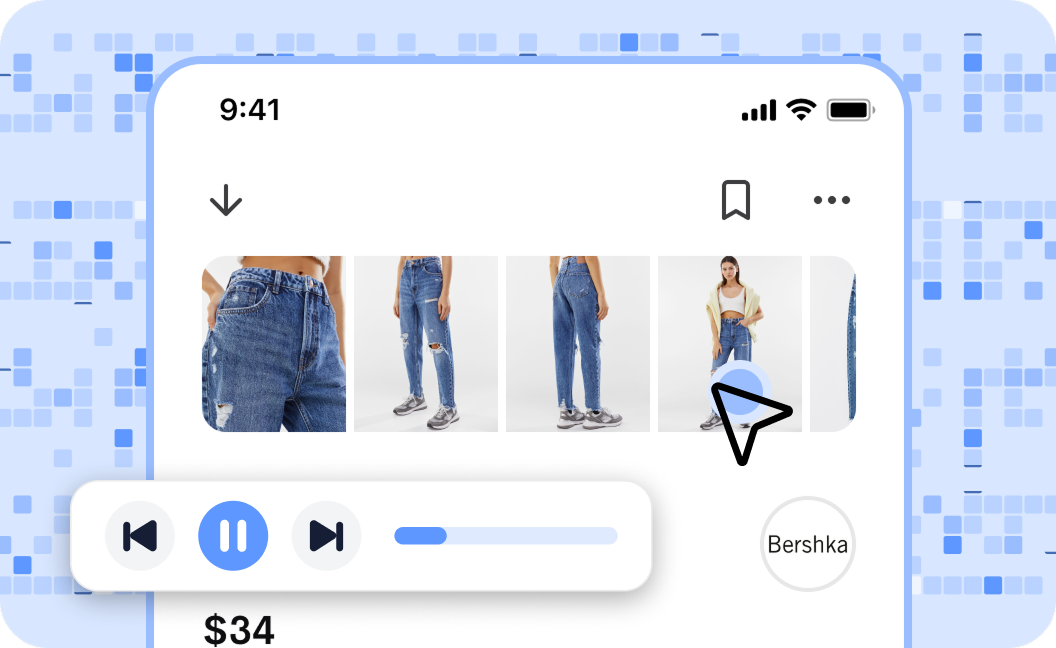

To figure out why, you can take advantage of UXCam’s Session Replay and Heatmap features to view the exact behavior of customers within a user journey.
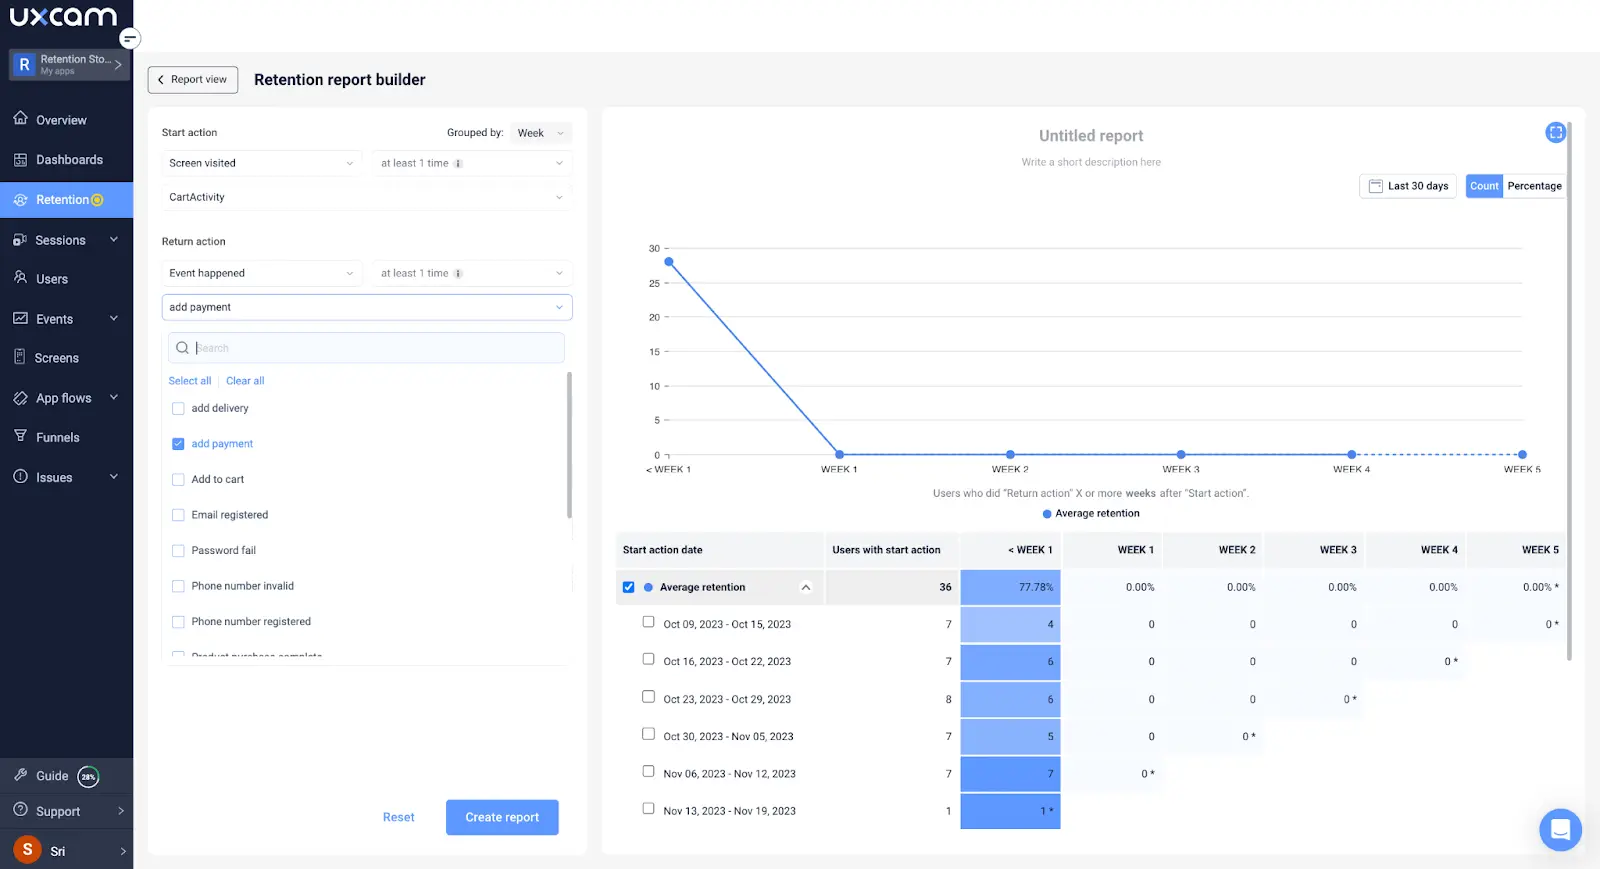
You can then build custom reports and dashboards that track CX metrics so that you can see which actions lead to positive results (and which ones don’t). This way, you can measure your success in improving CX over time.
4. Collect feedback
Regularly use customer surveys, interviews, and focus groups to find out their perceptions, pain points, expectations, needs, and preferences.
Monitor customer sentiment, feedback, and mentions related to your brand through social media platforms. This information is invaluable in addressing customer concerns that aren’t easy to track with monitoring tools—for example, “I hate the new menu layout” or “I couldn’t find the product I was looking for.”
5. Analyze customer data
Evaluate and analyze customer data and highlight patterns and trends to improve data-backed CX.
Start by segmenting users into meaningful groups based on:
Demographics
Behavior patterns
Feature usage
Feedback scores
Then look for app areas where a specific group is having a negative experience. For example, Housing.com used UXCam to find that a certain segment of their users were frustrated by the fact that they couldn’t find a multi-city search feature.
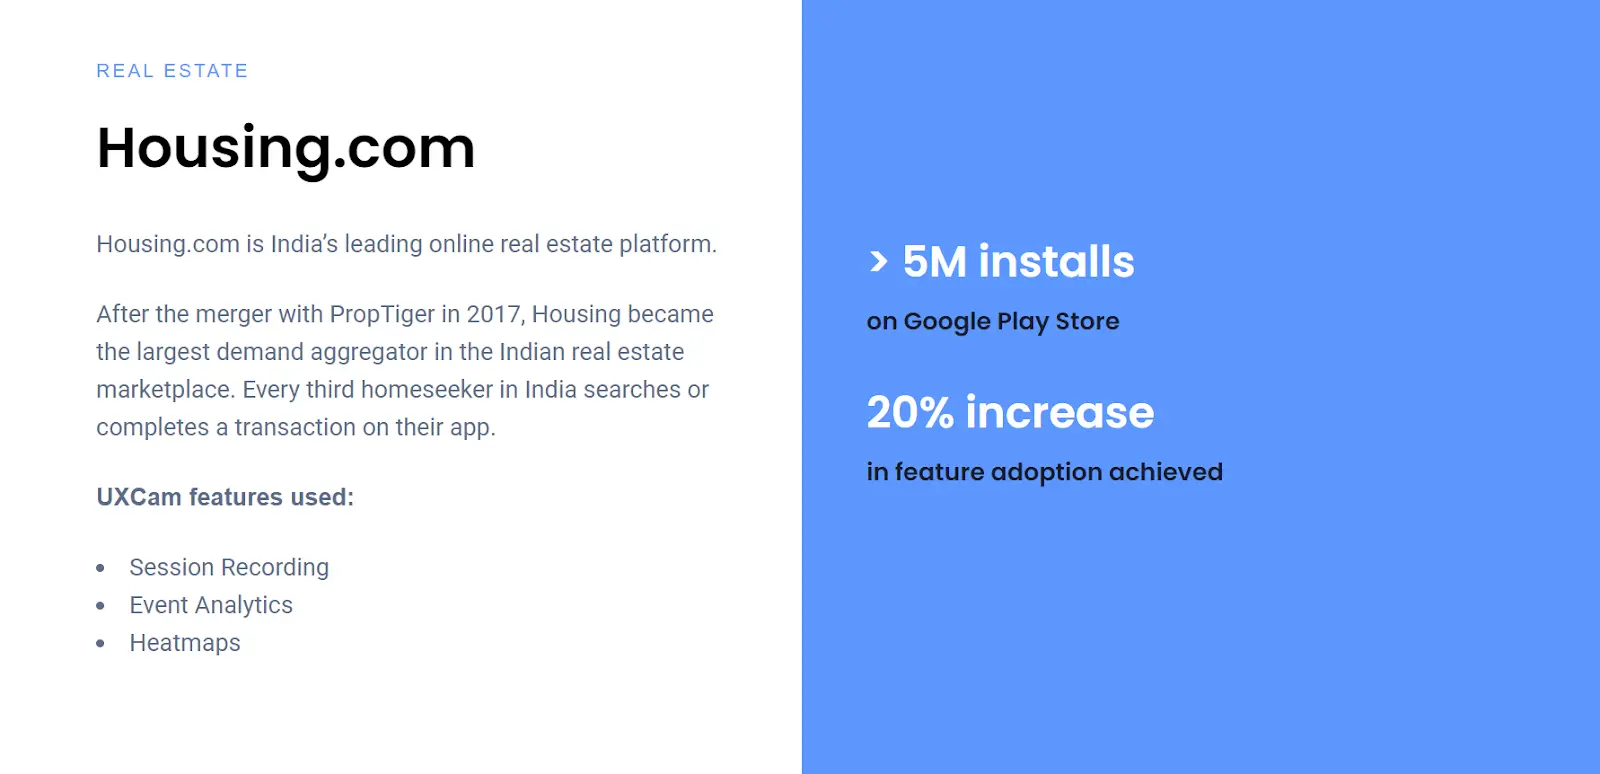
Adding this feature increased feature adoption by 20%.
6. Benchmark yourself
At the start of this process, you will have collected initial data on the CX metrics you’re measuring. Use this to set a baseline and benchmark yourself against it as your CX initiative progresses. This will give you an idea of the improvement (or lack thereof) resulting from each change or new feature.
UXCam’s Dashboard feature is helpful here—create modular dashboards that track key metrics and compare them over time. This allows you to quickly see any patterns of success or failure—and then take the appropriate action based on that data.
7. Share insights, iterate, and improve
Share your CX insights with teams and stakeholders to promote a customer-centric culture. Continuously iterate and measure the impact of your changes. Iterate to improve your tracking and measuring strategy using feedback and industry best practices.
Use the data and insights gathered to enhance your products, procedures, and strategies. Through continuous iteration, you can refine your approach to deliver high-quality customer experiences.
Use UXCam to revolutionize your CX
Leveraging customer experience metrics helps product teams design products that resonate with their target audience and revolutionize how you engage with customers.
But remember—CX metrics are not set in stone. As customer preferences change, you’ll need to adapt your metrics accordingly. Regular reviews and refinements make sure your metrics stay relevant and aligned with business goals.
This article only scratches the surface of how UXCam powers CX success. Learn more by requesting a demo or start using it today for free.
You might also be interested in these;
Customer journey optimization: 6 practical steps
12 Best customer analytics tools and software
Customer experience analytics - The product team’s guide
Digitizing customer experience - An in-depth guide
7 Ways to improve end-to-end customer experience
AUTHOR

Tope Longe
Product Analytics Expert
Ardent technophile exploring the world of mobile app product management at UXCam.
What’s UXCam?
Related articles
Tara AI
How teams use Tara as their AI product analyst
A practical guide on how product teams use Tara as their AI product analyst; from diagnosing drop-offs to prioritizing what to fix next and making better decisions,...

Begüm Aykut
Growth Marketing Manager
App Analytics
Top Analytics SDKs 2026
Pick the right analytics SDKs to improve your app's...

Jonas Kurzweg
Product Analytics Expert
Product best practices
8 Best UX Analytics Tools and Software We’ve Tested 2025
A good UX design is key when it comes to user satisfaction. Learn about five of the best UX analytics tools you can use to get valuable insights about user...

Jonas Kurzweg
Product Analytics Expert

