End-to-End Customer Experience: A Practitioner's Guide to Measuring and Improving It


TABLE OF CONTENTS
- Key takeaways
- What is end-to-end customer experience?
- Why end-to-end CX is worth the work
- Seven ways to improve end-to-end customer experience
- 14 specific patterns and pitfalls I see across end-to-end CX audits
- Industry-specific considerations
- CX tools by category
- Common mistakes to avoid
- A CX maturity model and how to get started
- Quantify your end-to-end customer experience with UXCam
- How AI session analysis reads cross-surface customer experience
Customer experience used to be the marketing team's slide deck. The companies that compound results in 2026 have made it the operating discipline of the whole company, with shared metrics across product, support, success, and engineering, and a feedback loop that closes within a single sprint. The teams that still treat CX as a quarterly review usually share another property: their CX metrics improve slowly, and the slow improvements get attributed to luck.
Here's the working approach:
The clear definition, the seven stages worth tracking, and the metrics for each
13 patterns and pitfalls worth knowing across the journey
Industry-specific playbooks for ecommerce, SaaS, fintech, telecom, healthcare
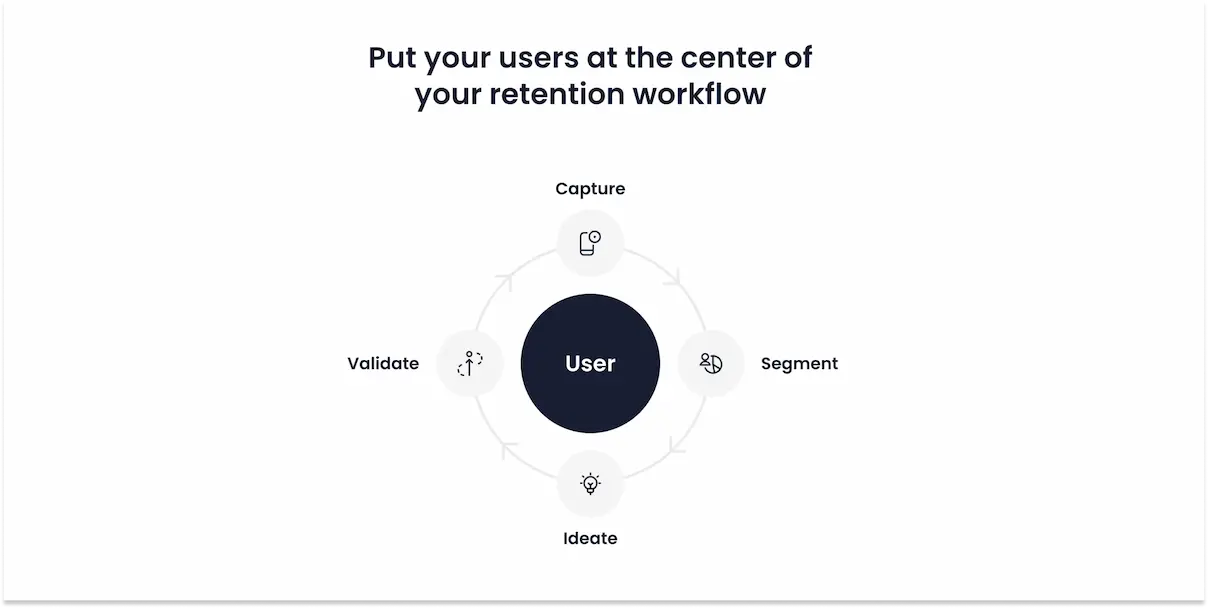
End-to-end customer experience is the full sequence of every interaction a customer has with your brand, from first awareness through purchase, support, and renewal, treated as a single connected journey. Most teams measure pieces; the leverage is in measuring the seams — the moments where customers hand off between channels — because the seams are where the experience actually breaks for most users.
Key takeaways
End-to-end CX covers every direct and indirect touchpoint, not just the in-product flow.
Start with a journey map, then layer quantitative data (funnels, retention) and qualitative data (session replay, rage taps) on top.
The teams that win pick 3-5 KPIs per journey stage and instrument them before they ship.
Personalization drives repeat purchase behavior in 60%+ of customers, per McKinsey's Next in Personalization report.
UXCam's session replay, heatmaps, and issue analytics surface friction you can't see in GA. Tara AI, our AI analyst, turns thousands of sessions into prioritized recommendations.
Customers like Recora cut support tickets by 142% and Inspire Fitness grew time-in-app by 460% by fixing one or two touchpoints they previously couldn't see.
What is end-to-end customer experience?
End-to-end customer experience is the complete set of interactions a person has with your company across the full lifecycle: awareness, consideration, purchase, onboarding, ongoing use, support, and renewal or churn. Each interaction is a touchpoint. The total experience is how those touchpoints feel, strung together, from the customer's side of the glass.
In practice this means that every touchpoint should be measured, benchmarked, improved, and, most importantly, viewed as part of the larger experience. Fixing checkout while ignoring a broken password-reset email is a rounding error on total CX. I've seen teams spend three months A/B testing a hero image while 38% of new signups were stuck in an email verification loop that nobody on product owned.
Direct vs. indirect touchpoints
Direct touchpoints are moments where the customer interacts with your product or team: the mobile app, the website, the support chat, the in-store visit, the onboarding email sequence.
Indirect touchpoints are moments where the customer is exposed to your brand without your direct involvement: a G2 review, a Reddit thread, a friend's recommendation, an App Store rating, a press mention.
You can only instrument the direct ones, but the indirect ones shape expectations before the customer ever lands on your product. Both count. Most CX programs underweight indirect touchpoints because they're hard to measure, but they're exactly where trust gets built or broken before you get a chance to reply.


Why end-to-end CX is worth the work
It compounds retention
Retention is the single strongest predictor of long-term revenue in SaaS and consumer apps. Bain & Company's classic research still holds up: a 5% increase in customer retention can lift profits by 25% to 95%. Great end-to-end experiences keep people past the point where most churn happens, which is usually in the first seven days post-install for mobile apps. Appsflyer's retention benchmarks show day-30 retention averaging under 5% across categories, which is why every friction point in the first week compounds hard.
It reduces support cost
Every confusing screen is a support ticket waiting to happen. Recora, a cardiac rehab app, spotted press-and-hold confusion on a core interaction using UXCam's session replay and reduced support tickets by 142% after the fix. That's a measurable, end-to-end improvement: the in-app friction was driving email and phone support costs upstream. At a typical support cost of $15-25 per ticket according to Zendesk CX Trends, the math on fixing confusion earlier in the journey is obvious.
It builds credibility that word-of-mouth amplifies
Customers who finish a journey smoothly tell others. Nielsen's trust research continues to show personal recommendations as the most trusted form of advertising globally. The indirect touchpoints (reviews, referrals, social posts) are almost entirely downstream of whether the direct ones worked. App Store ratings are the clearest example I've watched move after in-product fixes: teams that resolve a top-three rage tap hotspot routinely see their star rating climb a half point inside two months.
Seven ways to improve end-to-end customer experience
1. Map customer journeys before you optimize anything
You cannot improve what you haven't drawn. Start by mapping the 2-3 highest-value journeys in your business. For a fintech app, that's usually: install → KYC → first transaction. For e-commerce: ad click → browse → cart → checkout → re-engagement.
For each stage, list the touchpoints. Where does the customer show up? Push notification? Email? Chatbot? Help center article? Physical card in the mail? Map them all.


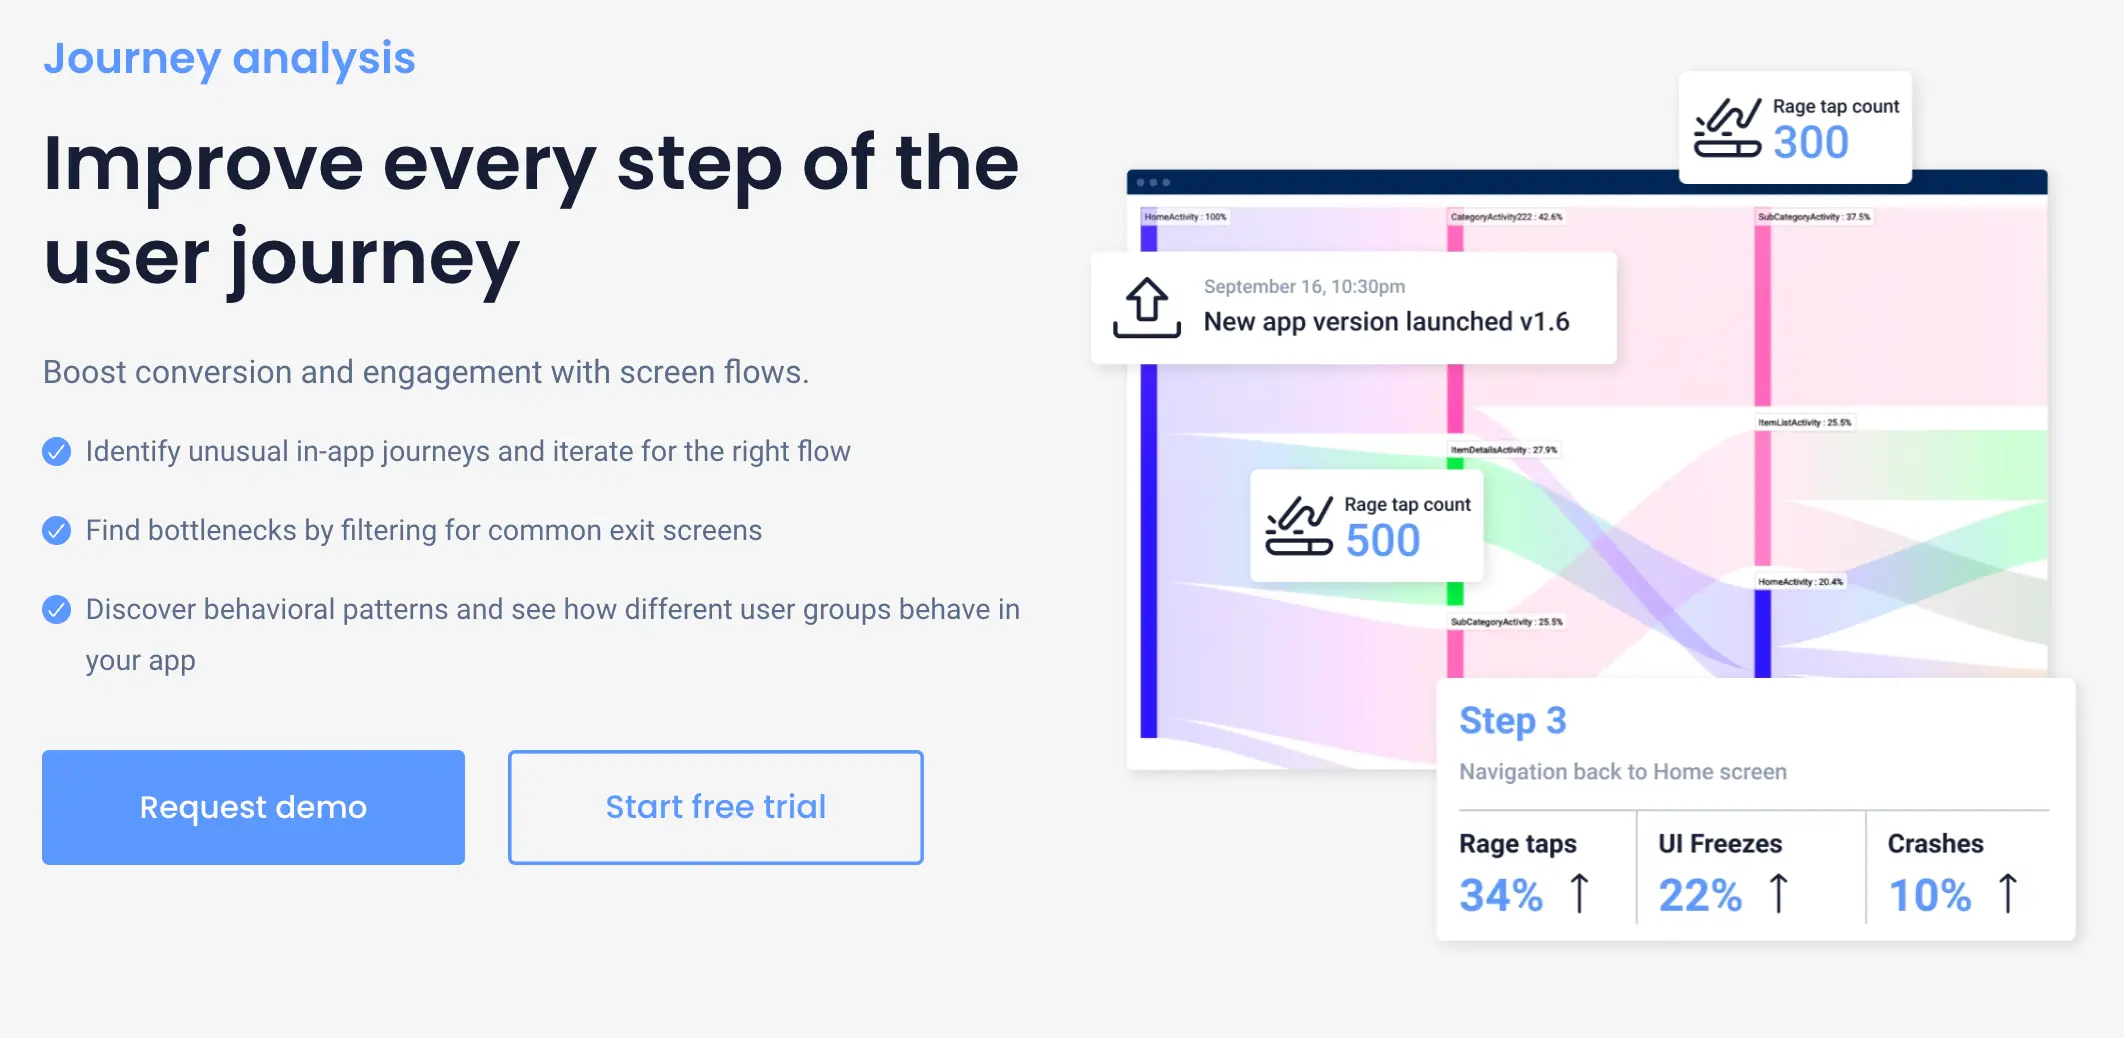
Inside UXCam, User Journeys autocaptures the flows users actually take (not the ones you think they take) so the map reflects reality. I've seen teams redesign an onboarding flow only to discover in UXCam that 40% of users were entering through a deep link that skipped the tutorial entirely. For broader journey mapping tooling, see our user journey mapping tools roundup.
2. Identify bottlenecks with funnel analysis
Once the map is drawn, find where people fall off. Funnel analysis is the cheapest, fastest diagnostic in the CX toolkit.


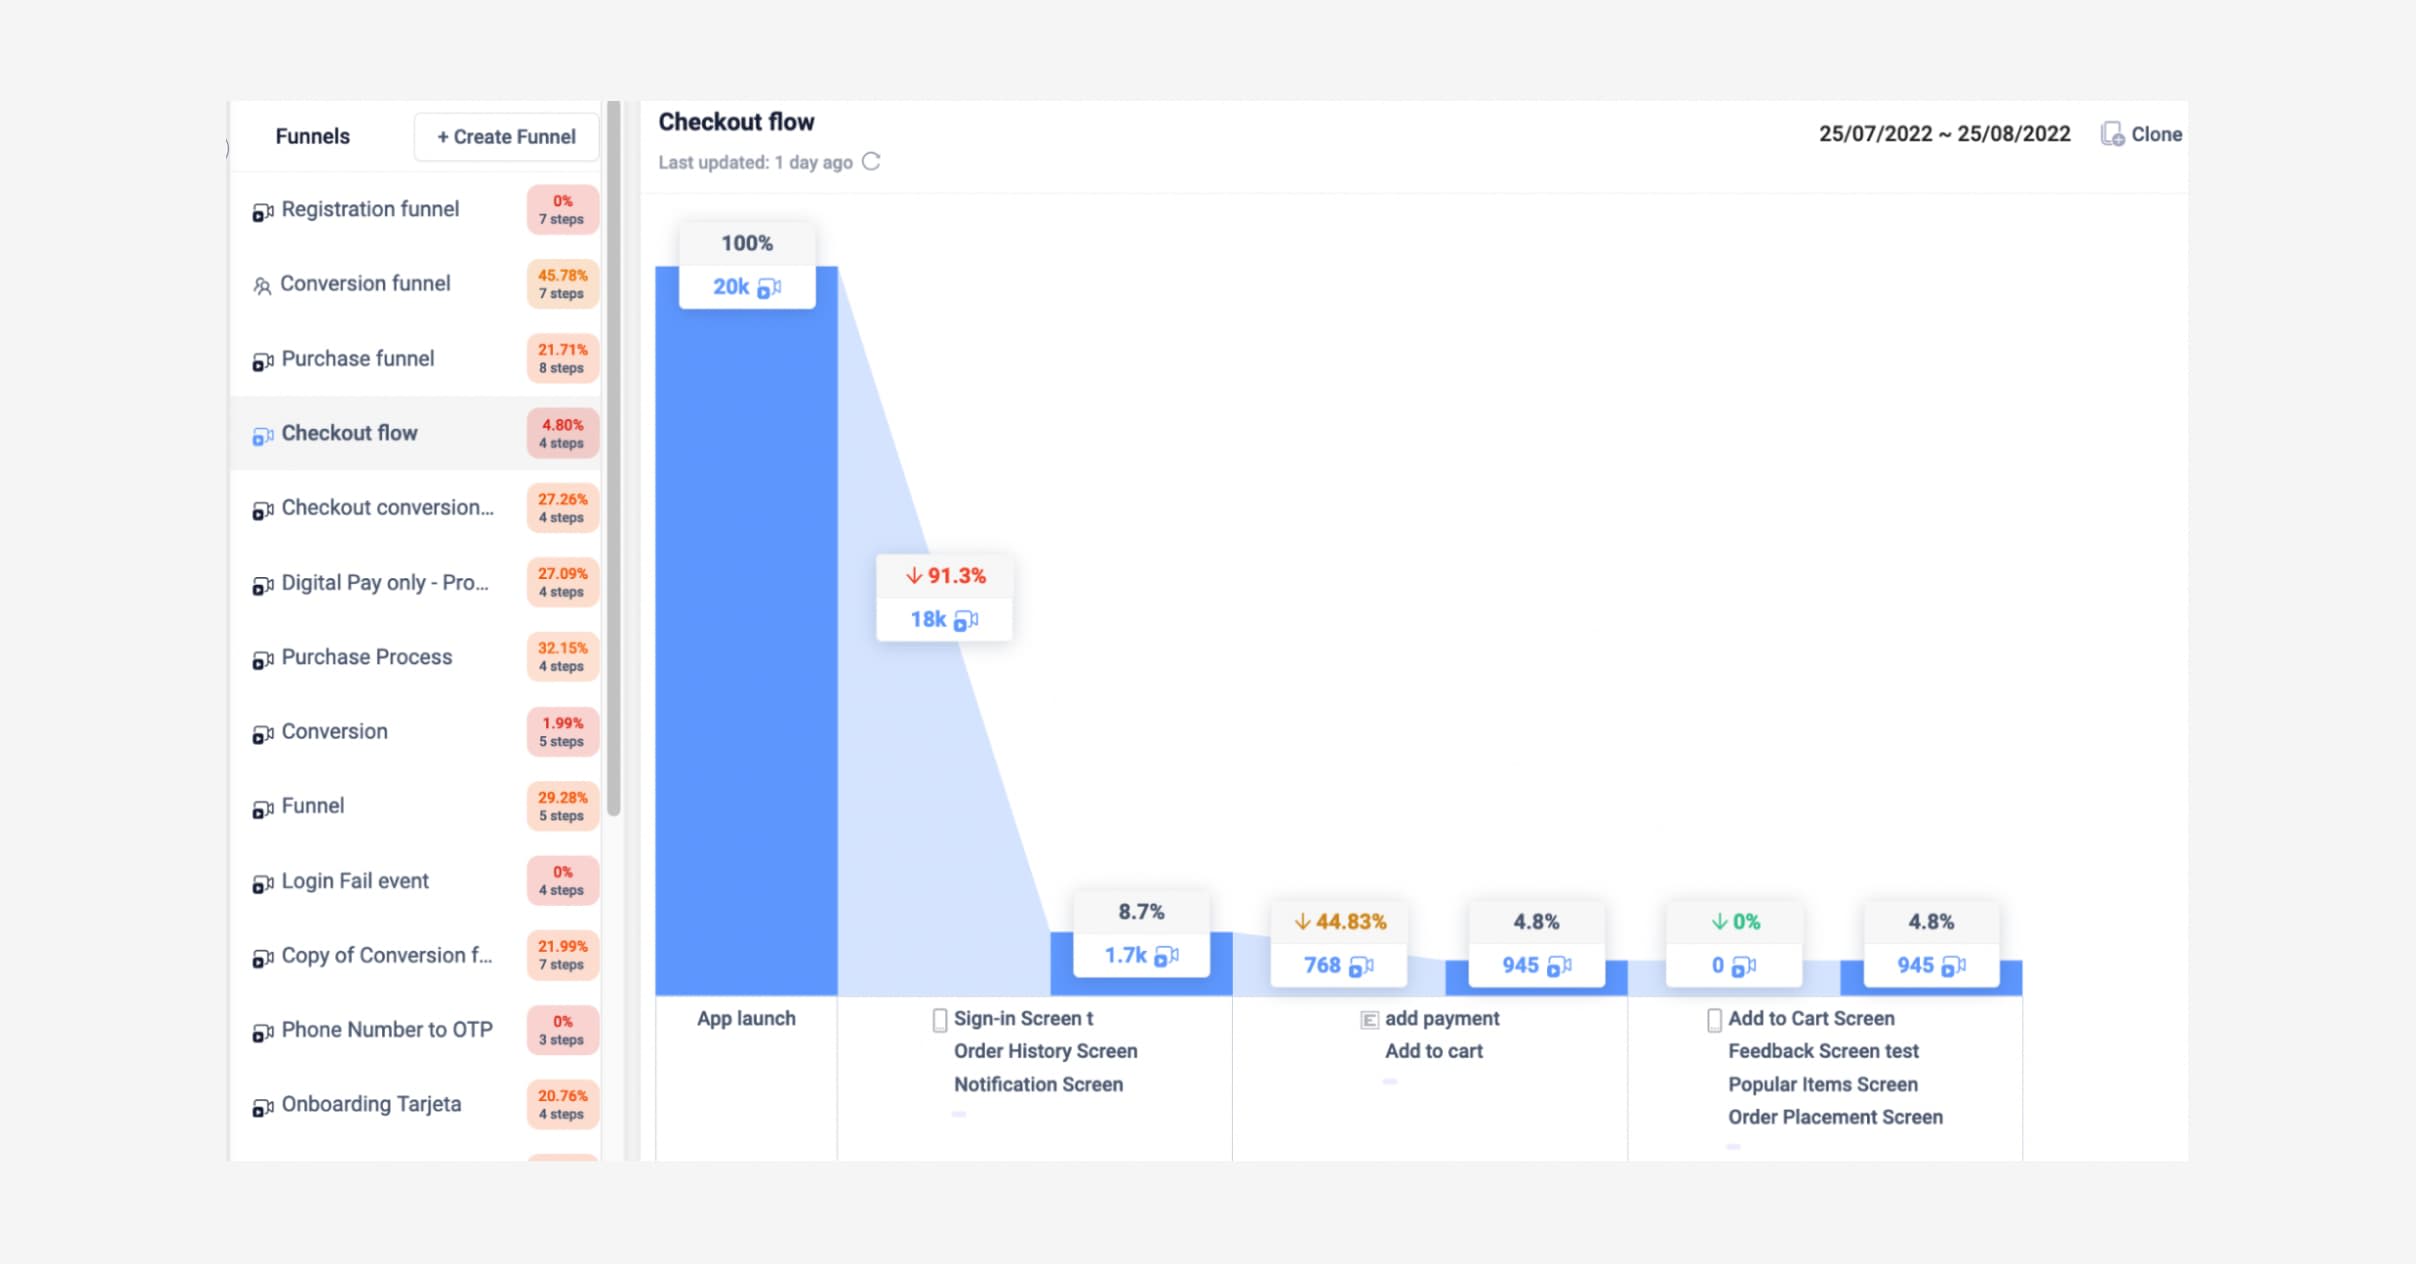
UXCam's Funnel Analytics lets you define a funnel, see the drop-off percentage at each step, and then (this is the part most tools miss) watch the session replays of the users who dropped off. You stop guessing why they left and start seeing it: a tap target that never registered, a form field that rejected a valid input, a spinner that never resolved.
Pair funnels with UXCam's issue analytics to surface rage taps and UI freezes at each drop-off point. That's usually where the obstacle lives.
3. Instrument with the right analytics stack
You cannot measure CX with one tool. A healthy stack usually includes:
A quantitative web/marketing analytics tool (GA4, Amplitude) for traffic, acquisition channels, and top-of-funnel.
A qualitative mobile and web intelligence tool (UXCam) for session replay, heatmaps, rage taps, and in-product behavior.
A voice-of-customer tool (survey or NPS platform) for sentiment.
A support/CX platform (Zendesk, Intercom) for ticket volume and resolution time.
UXCam is a product intelligence and product analytics platform, covering both mobile apps and the web, installed in over 37,000 products. On the qualitative side, Tara AI ingests thousands of sessions and returns prioritized recommendations, which collapses what used to be a week of analyst work into a few minutes. If you want a detailed comparison with web-era analytics, see our take on Google Analytics for mobile apps.


4. Pick KPIs that map to journey stages
The biggest mistake I see is teams tracking 40 metrics and acting on none of them. Pick 3-5 per stage.
| Journey stage | KPI | Where to measure |
|---|---|---|
| Acquisition | CAC, channel conversion rate | GA4, ad platforms |
| Onboarding | Activation rate, time to first value | UXCam funnels |
| Engagement | DAU/MAU, session length, feature adoption | UXCam retention analytics |
| Support | Ticket volume, time to resolution, CSAT | Zendesk/Intercom |
| Loyalty | NPS, repeat purchase rate, referral rate | Survey tool + billing data |
For a deeper list, see our 50+ mobile app KPIs cheat sheet.
5. Personalize the parts that matter
Personalization is not a buzzword when it's done at the right moments. McKinsey's research shows 71% of consumers now expect personalized interactions and 76% get frustrated when they don't happen.
The trick is knowing where to personalize. Blanket personalization (calling everyone by their first name in every email) is noise. Targeted personalization (showing a returning user a continue-where-you-left-off card, or surfacing the exact support article relevant to the error they just hit) is signal. UXCam segmentation lets you watch sessions by user cohort so you can see which moments are worth customizing and which aren't.
Housing.com used this approach to grow feature adoption from 20% to 40% by redesigning the parts of the app that confused new users, while leaving the parts power users already loved alone.
6. Optimize for quality per session, not volume
I've watched teams spend a quarter driving more installs only to see retention drop because the product wasn't ready. More top-of-funnel on top of a leaky bucket is just more waste.
Inspire Fitness took the opposite approach. They used UXCam to find the exact moments inside their app where users lost interest, fixed those flows, and grew time-in-app by 460% while cutting rage taps by 56%. No new acquisition spend. Just better sessions for the users they already had.
7. Gamify the moments that earn it
Done right, gamification reinforces progress at points where the customer has already done work. Completing onboarding, hitting a usage streak, referring a friend, leaving a review. Costa Coffee's loyalty mechanics lifted registrations by 15% because the reward was tied to an action the user already wanted to take.
Done wrong, gamification is a progress bar nobody asked for. The test I use: does the reward make the customer's next session more valuable to them? If not, cut it.
14 specific patterns and pitfalls I see across end-to-end CX audits
This is the pattern library I keep referring back to when I audit apps. Some are tactics to adopt, others are traps to avoid. All of them move numbers.
1. The deep-link blind spot
Paid campaigns and email links often drop users into mid-app screens that skip onboarding entirely, leaving first-time users without context. Use UXCam's User Journeys filtered by first_session=true to see the entry points and consider a lightweight contextual primer for deep-linked arrivals. Branch's mobile growth data shows deep-linked users convert 2-3x better when the landing experience matches intent.
2. The forgotten password spiral
Password reset is the single most common churn cliff I see in returning-user cohorts. Watch replays of reset flows and look for broken email rendering, expired tokens, or SMS fallbacks that never arrive. Auth0's CIAM data puts abandoned reset flows at 20%+ for most B2C apps.
3. Web-to-app handoff friction
Users who discover you on mobile web and get pushed to install an app often land back at square one with no session context. Smart banners via Branch or Adjust preserve state, and UXCam lets you stitch the web and mobile sessions together to see the whole journey.
4. The empty state that stops everything
Search results with zero hits, inboxes with nothing in them, and dashboards with no data are common dead ends. Every empty state should include a next action. I run heatmaps on empty states specifically to see whether users tap the CTA or back out.
5. Permission prompts fired too early
Requesting push, location, or contacts permissions on the second screen tanks opt-in rates. Airship's messaging benchmarks show contextual prompts (triggered after a related action) convert 2-4x better than cold prompts. Move these deeper into the flow.
6. Silent payment failures
On checkout, a decline or 3DS challenge that doesn't surface a clear error message is a guaranteed drop. Session replay shows you the exact pixel where the user gave up. Stripe's own research has payment authentication friction accounting for 11%+ of abandoned e-commerce checkouts.
7. Over-translated but under-localized content
Strings get translated but date formats, currency, and legal copy stay in en-US. Segment UXCam sessions by locale and watch five sessions per market. The bugs are usually obvious inside ten minutes.
8. Support content that never surfaces in-product
Help articles live in a portal nobody visits. Surface them contextually at the point of confusion, either via a help widget (Intercom, Zendesk Messaging) or a tooltip triggered by rage taps. Ticket deflection rates jump 20-40% when content meets users in-flow.
9. Notification fatigue
Too many pushes trains users to swipe-to-dismiss, and then your retention campaign stops working entirely. Iterable's benchmarks suggest a frequency cap of 3-5 pushes per week is the sweet spot for most consumer apps.
10. The review prompt asked at the wrong moment
Asking for an App Store review right after a failed action is how you get 1-star reviews. Trigger review prompts after a success state (completed workout, successful transaction, feature streak) and you'll see ratings climb materially.
11. Session timeouts that log users out of context
Long-session users on tablets or large-format phones get logged out mid-task after 15 minutes of inactivity and lose everything. Review your auth timeout policy against actual session length data in UXCam. The default is almost always wrong.
12. A/B test pollution
Running five overlapping tests across a journey makes results unreadable. Use a proper experimentation platform (Statsig, LaunchDarkly, Optimizely) with mutual exclusion groups, not ad-hoc toggles.
13. Analytics-only QA
Shipping based on dashboards without watching a single session is how you end up with 99.9% event completion and 40% task abandonment. Every release review at every team I've advised now includes at least five session replays of the shipped feature.
14. Ignoring tablet and foldable layouts
Responsive breakpoints break in weird ways on larger screens. UXCam heatmaps on tablet segments show dead zones you'd never find in simulator testing.
15. Orphaned error states
Generic "something went wrong" messages that don't link to recovery or support are the silent killer of trust. Every error state should have a copy-able error code, a suggested next step, and a one-tap path to support. I've watched teams cut error-driven churn by double digits just by rewriting five error screens.
Industry-specific considerations
End-to-end CX is never generic. The same seven-step playbook lands very differently depending on the vertical. Here's what shifts.
Fintech and banking
Trust is the bottleneck, not UX polish. KYC, 2FA, and fraud prompts are unavoidable but they're also where you lose 30-50% of signups. Instrument every KYC step as a funnel stage and watch replays of each rejection type. Plaid's financial app report shows first-time users who finish KYC in a single session are 3x more likely to fund. The fix is usually plain-language error messaging and a clear path back when a document fails verification.
E-commerce and retail
The journey crosses devices almost always: discovery on social or search, consideration on mobile web, purchase on app, returns in-store. Stitch these with a consistent user ID and look at multi-session funnels rather than single-session ones. Guest checkout vs forced signup is still the biggest single lever, and Baymard Institute's cart abandonment research puts mandatory account creation as the #1 cause at 34%.
Health, fitness, and wellness
The first seven days decide everything. Users download the app with intent, try it, and either build a habit or disappear. Retention curves are steeper than almost any other category. Inspire Fitness's 460% time-in-app lift came from fixing the exact first-week moments where users bounced. Pair in-app behavior with wearable data where relevant, and treat the "first completed workout" or "first logged meal" as your activation milestone.
SaaS and B2B
The buyer and the user are often different people. The CX spans the marketing site, a sales demo, a free trial, an admin setup, and daily end-user flows. Map each persona's journey separately. Admin activation (inviting teammates, connecting integrations) predicts account expansion better than end-user engagement in most tools. OpenView's PLG benchmarks have teams that hit time-to-value under 10 minutes converting trials at 2x the rate of those over 30.
Travel and hospitality
Session gaps are long (weeks between search and booking) and the journey crosses web, app, email, and in-destination touchpoints. Use UXCam retention cohorts to measure return-to-search rate and identify which inspiration content actually drives bookings. Offline touchpoints (check-in, housekeeping, concierge) feed back into app reviews whether you measure them or not.
Media and streaming
Engagement is the metric. Completed-play rate, session depth, and content-to-content transitions matter more than individual screen conversion. Look at where users exit a session and whether the next-content recommendation is doing its job. Heatmaps on the home feed tell you fast whether recommendations beat recency.
CX tools by category
You won't get end-to-end coverage from any single vendor. Here's the stack I recommend teams assemble.
Product intelligence and product analytics: UXCam for mobile and web session replay, heatmaps, funnels, retention, user journeys, and issue analytics. Amplitude and Mixpanel for cross-surface event analytics.
Web and marketing analytics: GA4, Adobe Analytics, and Fathom for privacy-friendly site analytics.
Voice of customer and surveys: Qualtrics, Delighted, Typeform, and Survicate for in-app micro-surveys.
Support and CX platforms: Zendesk, Intercom, Front, and Help Scout.
Customer data and engagement: Segment, Rudderstack, Braze, Iterable, and OneSignal for cross-channel messaging.
Experimentation and feature flags: Statsig, LaunchDarkly, and Optimizely.
Attribution and deep linking: Adjust, Appsflyer, and Branch.
Journey mapping and research ops: Miro, FigJam, Dovetail, and Smaply.
Common mistakes to avoid
These are the failure modes I see on almost every first engagement with a new CX team. Fix these and you're ahead of 80% of programs.
Optimizing one touchpoint in isolation. The adjacent ones leak and you never see it in your single-funnel dashboard.
Tracking 40 metrics without a hypothesis. Every metric needs an owner and a decision it will drive.
Skipping session replay. Quantitative funnels show where users drop. Only replays show why.
Treating mobile and web as separate programs. Customers don't. Your analytics shouldn't either.
Launching personalization without segmentation discipline. Personalizing the wrong thing is worse than not personalizing.
Running CX as a marketing function. CX spans product, support, and marketing. Housing it in one silo starves the others.
Using NPS as the only loyalty signal. Pair it with repeat behavior and billing data. Sentiment surveys lie more than logs do.
Ignoring indirect touchpoints. Reviews, forum threads, and App Store ratings shape expectations before you see the user. Monitor them.
Shipping fixes without measuring before and after. If you can't show the funnel delta, the fix didn't exist.
Outsourcing the session review. Product managers, designers, and engineers all need to watch sessions themselves. Insight doesn't delegate well.
A CX maturity model and how to get started
Most teams I talk to are at level 2 and think they're at level 4. Here's the progression I use to level-set.
Level 1: Reactive. You respond to complaints as they arrive. No journey map exists, no funnels are defined, and session data isn't reviewed. Tickets drive roadmap.
Level 2: Instrumented. GA4 and a support platform are in place. You know install-to-activation conversion but can't diagnose why it drops. Quantitative only.
Level 3: Qualitative + quantitative. Session replay, heatmaps, and funnels are live. You can point to specific screens and gestures that break. Recora and Housing.com were operating here when they moved the numbers they moved.
Level 4: Cross-functional ops. CX has defined owners per journey stage, weekly reviews, and a backlog prioritized by customer impact. Tara AI or equivalent feeds the backlog continuously.
Level 5: Predictive. You model churn and friction before it happens, personalize per-cohort, and run structured experiments against every major journey change. Rare, and usually reserved for top 5% of product orgs.
The 90-day starter playbook
If you have 90 days and a small team, here's the sequence I'd run.
Week 1-2: Map your top two journeys. List every touchpoint. Rank by revenue impact.
Week 3-4: Install UXCam on mobile and web if you haven't already. Set up funnels for each mapped journey. Define 3-5 KPIs per stage.
Week 5-6: Review session replays at each drop-off. Let Tara AI surface the top 10 issues by session volume.
Week 7-8: Ship fixes for the top 3 issues. Measure funnel conversion before and after.
Week 9-10: Layer in personalization and retention campaigns targeted at the cohorts that now complete the fixed flows.
Week 11-12: Establish a weekly CX review. Pull funnel deltas, replay highlights, and Tara AI recommendations into a single 30-minute meeting with product, design, and support.
That's the pattern that moved Recora, Inspire Fitness, and Housing.com. None of them boiled the ocean. They picked two journeys, instrumented them properly, and fixed what the data showed.
Quantify your end-to-end customer experience with UXCam
Improving end-to-end customer experience is about making every touchpoint legible to your team, then making it better. UXCam gives you session replay, heatmaps, funnels, retention, user journeys, and issue analytics in one platform, plus Tara AI to turn the raw session data into a ranked to-do list. It's trusted in 37,000+ products and rated 4.7 on G2.
Start with UXCam for free. No credit card, 30-day trial, full feature access.
How AI session analysis reads cross-surface customer experience
The hardest CX measurement problem is the seams: the moment a customer hands off from web to mobile to support to onboarding. Each surface is usually instrumented separately, and the resulting data is reconciled by hand if at all.
Tara AI inside UXCam reads sessions across both mobile and web on a unified data layer and surfaces the specific friction that lives at the seams. The CX team stops debating which surface "owns" a problem and starts shipping fixes against the seam itself.
Frequently asked questions
What is the difference between customer experience and end-to-end customer experience?
Customer experience often gets used narrowly to mean a single interaction or channel: the in-app experience, the support experience, the checkout experience. End-to-end customer experience is the deliberate view of all of those stitched together across the entire lifecycle, from awareness through churn or renewal. The distinction matters because fixing one touchpoint in isolation rarely moves the numbers. Customers judge you on the whole arc, so you have to measure and manage the whole arc.
How do I measure end-to-end customer experience?
Start by mapping your top customer journeys, then pick 3-5 KPIs per stage (acquisition, activation, engagement, support, loyalty). Combine quantitative data from funnels and retention analytics with qualitative data from session replay, heatmaps, and surveys. UXCam handles the in-product qualitative and quantitative side on mobile and web, while tools like GA4 cover top-of-funnel and platforms like Zendesk cover support. The goal is one dashboard per journey, not 40 disconnected metrics.
What are the biggest mistakes teams make when improving CX?
The most common mistake is optimizing one touchpoint in a vacuum while the adjacent ones leak. The second is tracking too many metrics without a clear hypothesis per stage. The third, and the one that costs the most, is relying only on quantitative funnels without ever watching a session replay. Numbers tell you where users drop; replays tell you why. You need both. Skipping the why step means teams ship fixes that target symptoms, not causes.
How long does it take to see results from end-to-end CX improvements?
In-product friction fixes, like resolving a rage-tap hotspot or a broken form field, can move funnel conversion within days of shipping. Broader improvements, like onboarding redesigns or retention campaigns, typically show up in 4-8 weeks. Loyalty and lifetime value shifts take one to two quarters because you're waiting for new cohorts to mature. The Inspire Fitness 460% time-in-app lift and the Recora 142% support-ticket reduction happened within a single quarter of instrumenting and fixing with UXCam.
Does UXCam work for web and mobile?
Yes. UXCam started as a product intelligence platform and is covering the web too, so the same session replay, heatmaps, funnels, retention, and issue analytics work across both surfaces. This matters for end-to-end CX specifically, because most customer journeys cross devices (ad on web, install on mobile, support ticket on web). Having one platform view the whole journey avoids the stitched-together analytics problem most teams run into when they bolt two separate tools together.
How does Tara AI help with end-to-end customer experience analysis?
Tara AI is UXCam's AI analyst. It processes thousands of sessions automatically, surfaces patterns (rage taps clustered on a specific screen, drop-offs correlated with a specific device, confusion on a specific gesture), and returns a prioritized list of recommended actions. For CX teams, this collapses a week of manual session review into a few minutes and ensures you're working on the highest-impact issues first. It's especially useful when you have high session volume and can't realistically watch every replay.
Who should own end-to-end customer experience in a company?
The least bad answer is a cross-functional CX lead reporting to a product or growth executive, with dotted-line ownership into each functional team that touches a touchpoint. Pure marketing ownership skews the program toward acquisition. Pure product ownership misses the support and post-purchase touchpoints. The governance model that works best is a weekly review where product, design, support, and marketing each bring their journey segment.
How many journeys should I map to start?
Two or three at most. Pick the journeys that account for the highest share of revenue or retention, usually acquisition-to-activation and a core engagement loop. Teams that try to map everything at once produce wall-sized artifacts that nobody acts on. You can always add journeys once the first two are instrumented and improving.
What's the difference between journey mapping and funnel analysis?
Journey mapping is the qualitative, narrative view: what the customer is trying to do, what they feel, which channels they touch. Funnel analysis is the quantitative measurement of specific steps in that journey. You need the map first to know what to put in the funnel, and you need the funnel to know which parts of the map are broken.
How do I calculate ROI on CX investment?
Pick a single funnel, measure baseline conversion, ship fixes, and measure again. Multiply the conversion delta by the revenue per converted user and annualize. For support-side fixes, multiply ticket volume reduction by fully-loaded cost per ticket (typically $15-25 for tier 1, $50+ for escalations). Recora's 142% ticket reduction translates directly into support headcount freed up for higher-value work.
Is end-to-end CX just a rebrand of UX?
No. UX is about usability and aesthetics of a specific surface. End-to-end CX includes UX, but also marketing, pricing, onboarding content, support quality, billing, off-boarding, and everything that happens between a user and your brand regardless of surface. You can have great UX and bad CX if your billing experience is hostile or your support queues are a week long.
How does privacy regulation affect end-to-end CX measurement?
GDPR, CCPA, and platform-level changes (ATT on iOS, privacy sandbox on web) constrain what you can identify and track across touchpoints. UXCam's approach is to privacy-mask sensitive fields by default and operate on anonymized session data, which keeps you compliant while preserving the diagnostic value. For cross-channel identity, invest in first-party data collection via Segment or Rudderstack and stop relying on third-party identifiers.
Can small teams do end-to-end CX well?
Yes, and often better than large ones because decision latency is lower. The 90-day playbook above works with a team of three: a PM, a designer, and an engineer. The constraint is focus, not headcount. Large teams usually fail because they try to boil the ocean. Small teams succeed because they pick two journeys and finish the work.
How do I get cross-functional teams to care about CX metrics?
Tie the metrics to outcomes each function already owns. Show product a funnel delta tied to a feature they shipped. Show support a ticket-volume drop tied to a copy fix. Show marketing a CAC-to-LTV shift tied to better onboarding. Shared dashboards fail when they feel like someone else's score. They work when each team sees its own work reflected in the numbers.
What's the single highest-leverage thing I can do this week?
Watch ten session replays of users who dropped out of your core conversion funnel. No instrumentation changes, no new dashboards, just watch. I've never had a team do this exercise and not come out with a list of fixable, high-confidence issues they hadn't seen in any dashboard.
AUTHOR
Silvanus Alt, PhD
Founder & CEO | UXCam
Silvanus Alt, PhD, is the Co-Founder & CEO of UXCam and a expert in AI-powered product intelligence. Trained at the Max Planck Institute for the Physics of Complex Systems, he built Tara, the AI Product Analyst that not only analyzes user behavior but recommends clear next steps for better products.


TABLE OF CONTENTS
- Key takeaways
- What is end-to-end customer experience?
- Why end-to-end CX is worth the work
- Seven ways to improve end-to-end customer experience
- 14 specific patterns and pitfalls I see across end-to-end CX audits
- Industry-specific considerations
- CX tools by category
- Common mistakes to avoid
- A CX maturity model and how to get started
- Quantify your end-to-end customer experience with UXCam
- How AI session analysis reads cross-surface customer experience


Related articles


Product best practices
12 Apps with Great User Onboarding (2026 Examples)
The 12 mobile app onboarding flows I'd study if I were designing one today, with specific callouts for what each does well, common mistakes, and the...
Silvanus Alt, PhD
Founder & CEO | UXCam


Product best practices
Why creating a data-driven culture has less to do with data than you think
Kishan Gupta, CEO, shares 5 tips and techniques for fostering a data-driven culture based on his own experiences building and leading...


Kishan Gupta
Co-Founder of UXCam


Product best practices
Finance apps have a customer support problem, here's how to fix it
Learn about the customer support problem in finance apps and practical solutions to fix it in our latest blog post, and improve user satisfaction and...


Jane Leung
Product Analytics Expert