Flutter Performance Monitoring - Best Tools and Techniques


When it comes to developing high-performance mobile apps, choosing the right tools and techniques for monitoring and optimizing performance is crucial. With Flutter, Google's UI toolkit for building beautiful, natively compiled applications, developers can create fast and responsive apps across various platforms. But how can you ensure that your Flutter apps are running at their best?
In this article, we'll introduce you to the top Flutter performance monitoring tools and demonstrate how UXCam can help you monitor your app's performance with ease.
Why Performance Monitoring Matters
Performance is a critical factor in the success of any mobile app. A slow or unresponsive app can lead to user frustration, negative reviews, and ultimately, app abandonment. By employing the right tools and techniques for monitoring your Flutter app's performance, you can identify bottlenecks and improve the overall user experience.
Top Tools and Techniques for Flutter Performance Monitoring
The top three best performance monitoring tools to you track and optimize Flutter apps are UXCam, Flutter DevTools, and Firebase Crashlytics
We'll dive into their key features, use cases and pricing below:
UXCam
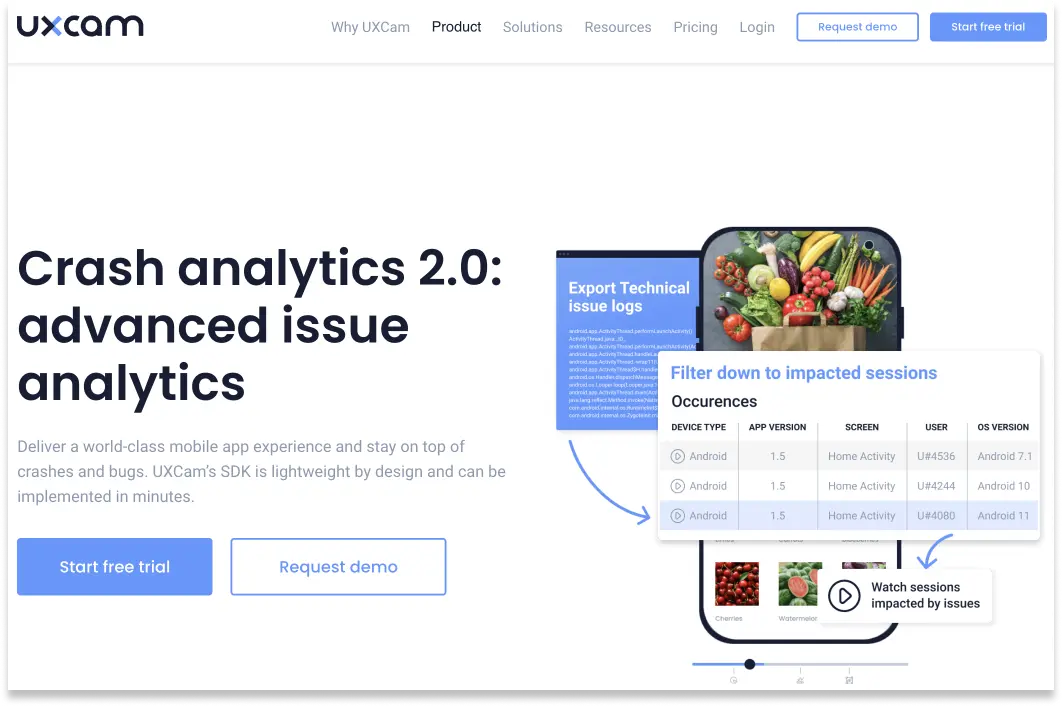
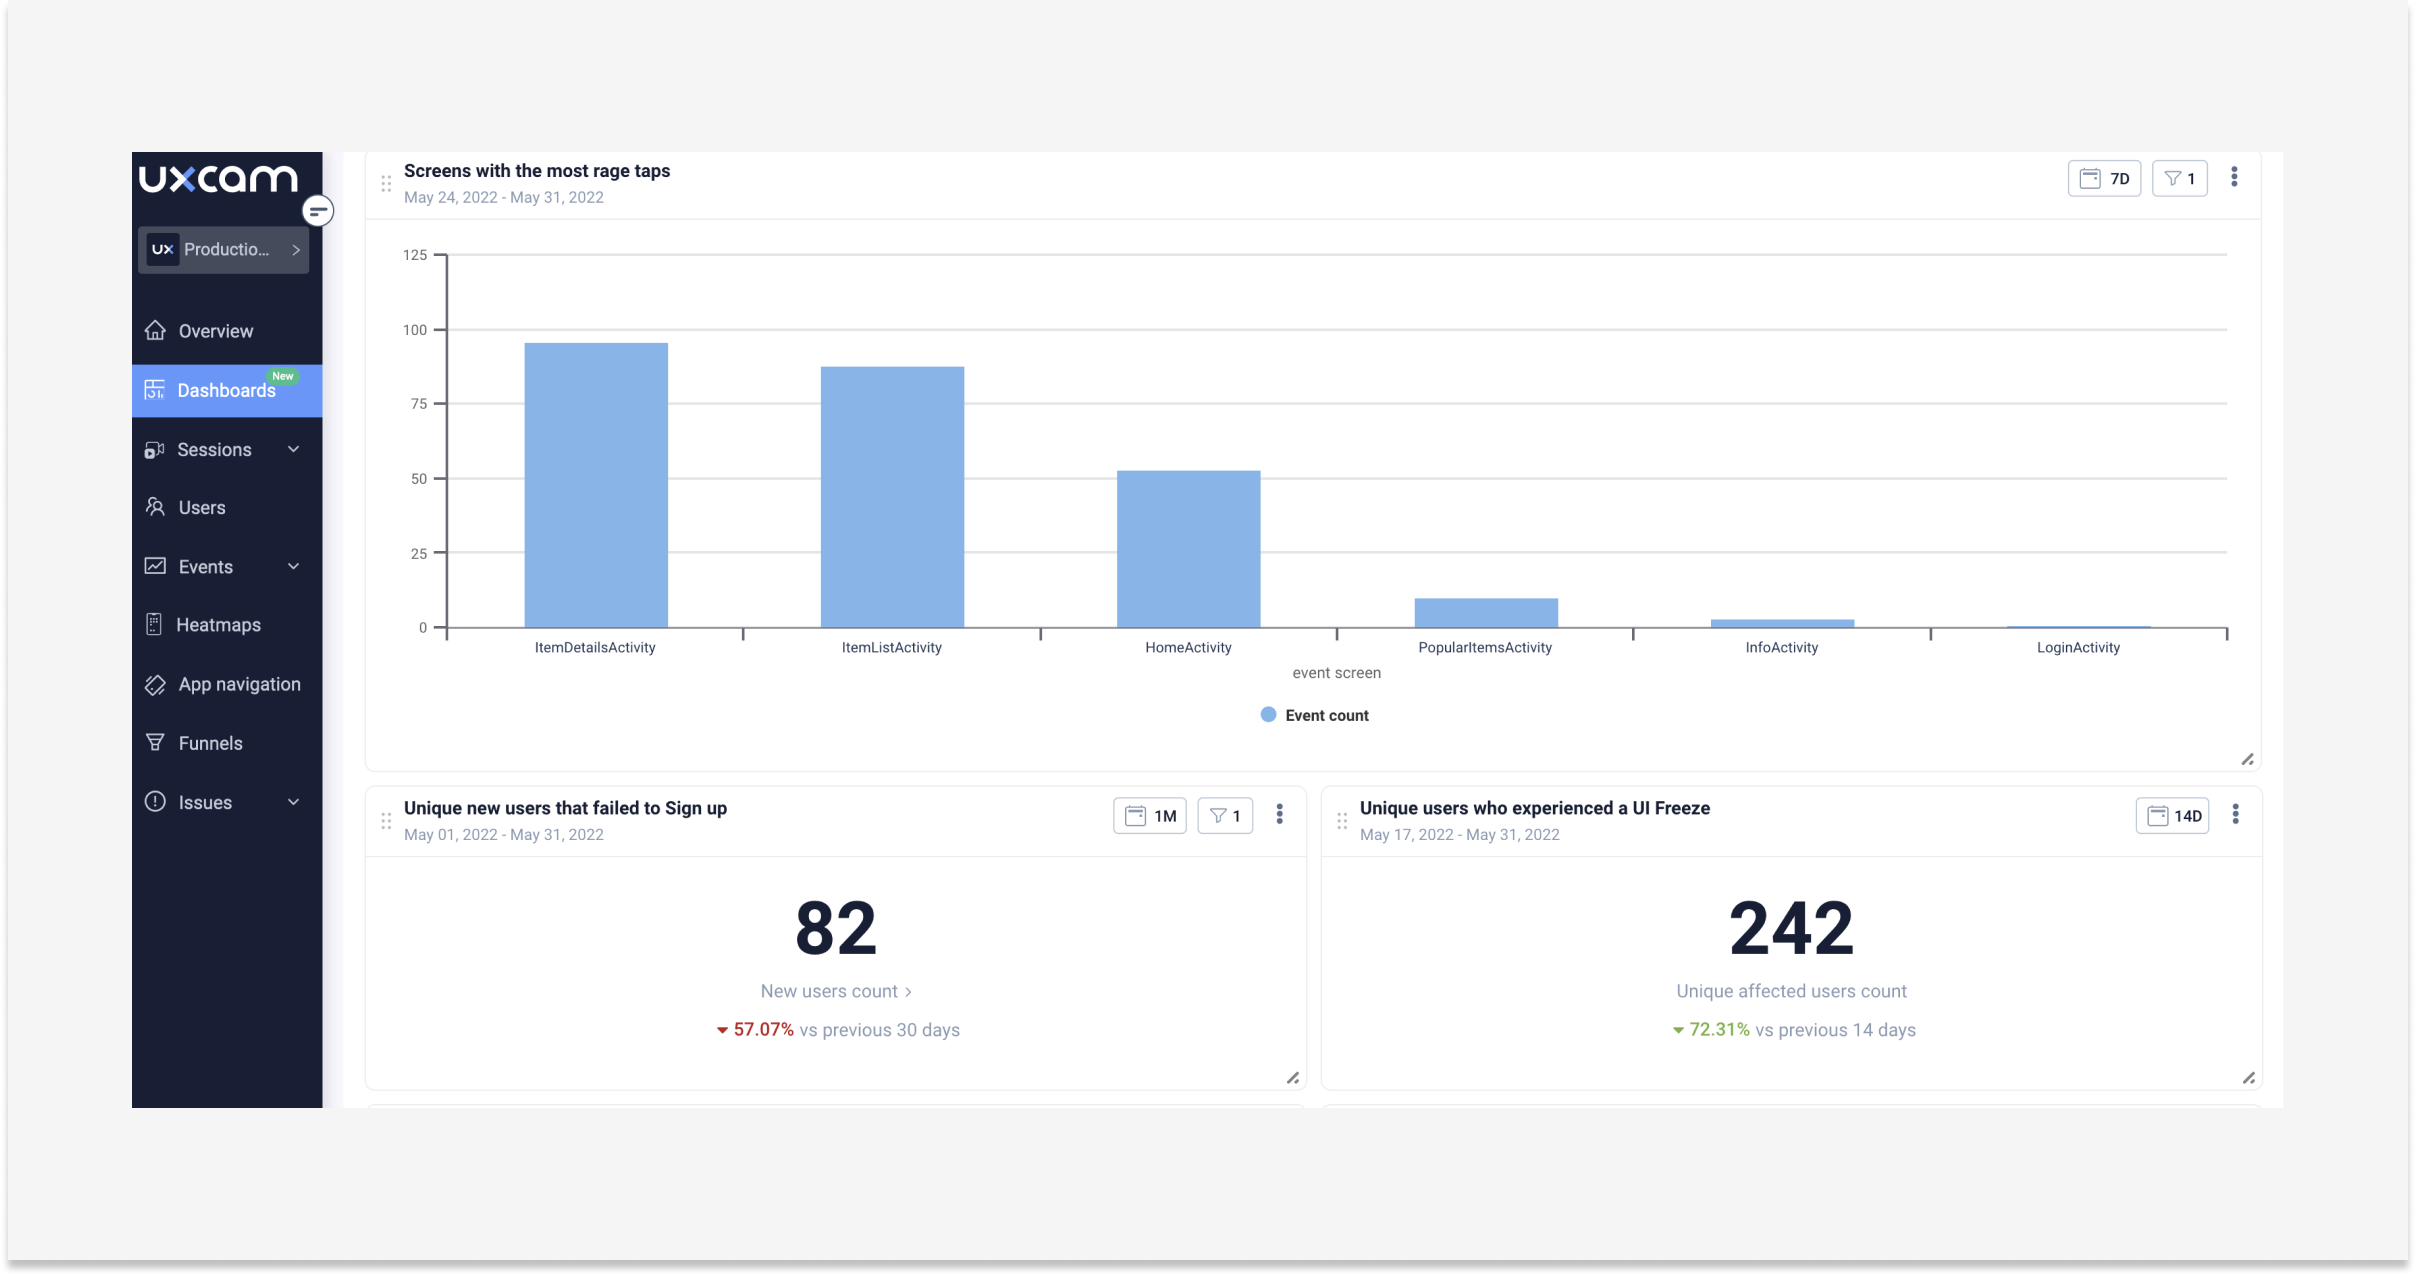
UXCam is a leader in mobile app issue monitoring analytics. It captures every micro-interaction in your app to deliver actionable data reports. The tool offers powerful features to help teams use contextual insights to refine app performance and experience.


Whether you’re a product or engineering team, UXCam provides better context on app performance issues, allowing you to get to the root cause behind bugs, UI freezes, and crashes. You get detailed issue reports and can easily collaborate with stakeholders to ensure app performance and stability. UXCam comes highly recommended for Flutter app performance monitoring as it has a dedicated lightweight Flutter mobile SDK . It also works on the common all native and non-native mobile app development including iOS, Android, React Native, Xamarin, Cordova, and Unity.
Features
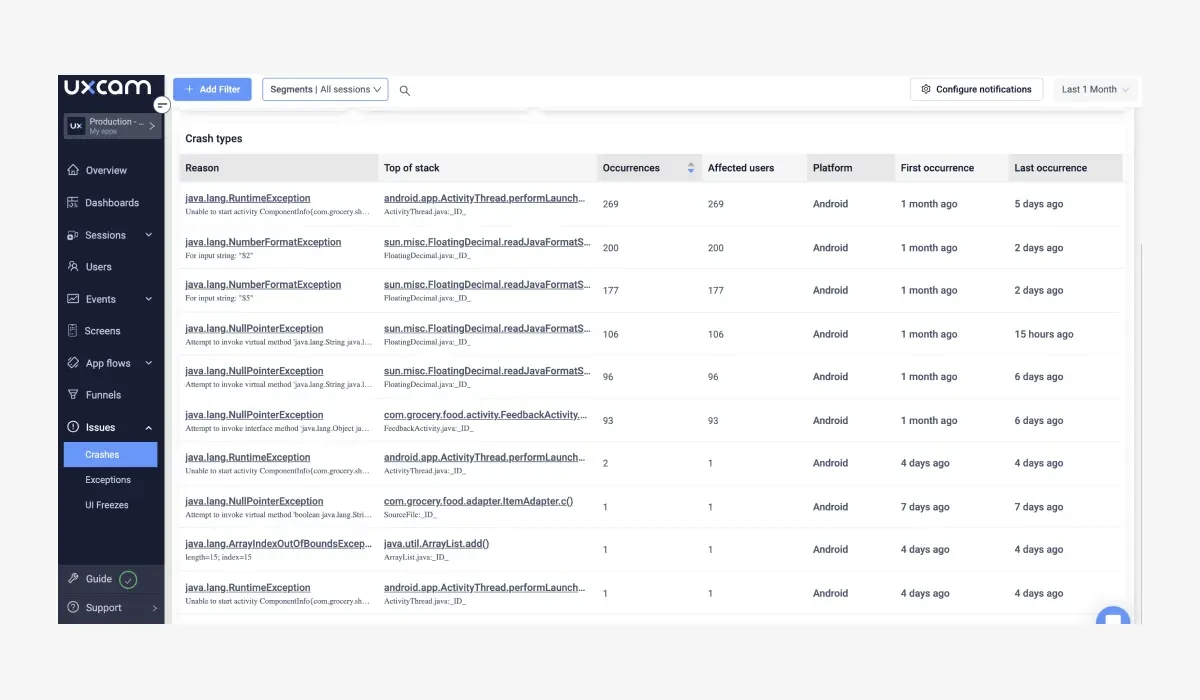
Issue Analytics: You can track and fix technical issues in real-time before they impact your user experience. With Issue Analytics, you get access to crash and UI freeze reports, and you can export the logs for detailed analysis. Plus, you get data on users and sessions impacted by technical issues.
Session Tagging: When reviewing multiple sessions for technical issues, you can easily tag them to identify sessions with similar problems. This way, you can always return to the tagged user sessions for further investigation. You can also use the “viewed session” tag to mark sessions that have been investigated.
Session Replay: How did a crash occur? What really happened during the event? With session replay, you get a complete picture of crashes and other technical issues. The feature allows you to record all sessions, which you can replay and analyze to understand the causes of crashes.
Screen Flow Analytics: With Screen Flow, you can visualize users' movement on your app. This helps you identify their drop-off points and determine if the drop-offs resulted from technical issues. You can use reverse flow to identify all points where users drop off or get stuck.
Screen Heatmaps: UXCam's detailed screen heatmaps help you review the screens where UI freezes occurred, enabling you to quickly identify and report handled exceptions.
Pros
UXCam's issue analytics feature provides in-depth visibility into crashes and UI freezes. You can use custom events to find correlations between crashes and events. More importantly, you can rewatch how users experienced UI freezes and crashes with session replay to determine the ideal fixes.
Cons
The tool doesn’t list the pricing for the different plans -- you’ll need to contact support to get this information. The free plan offers limited session recordings; you’ll need to upgrade your plan.


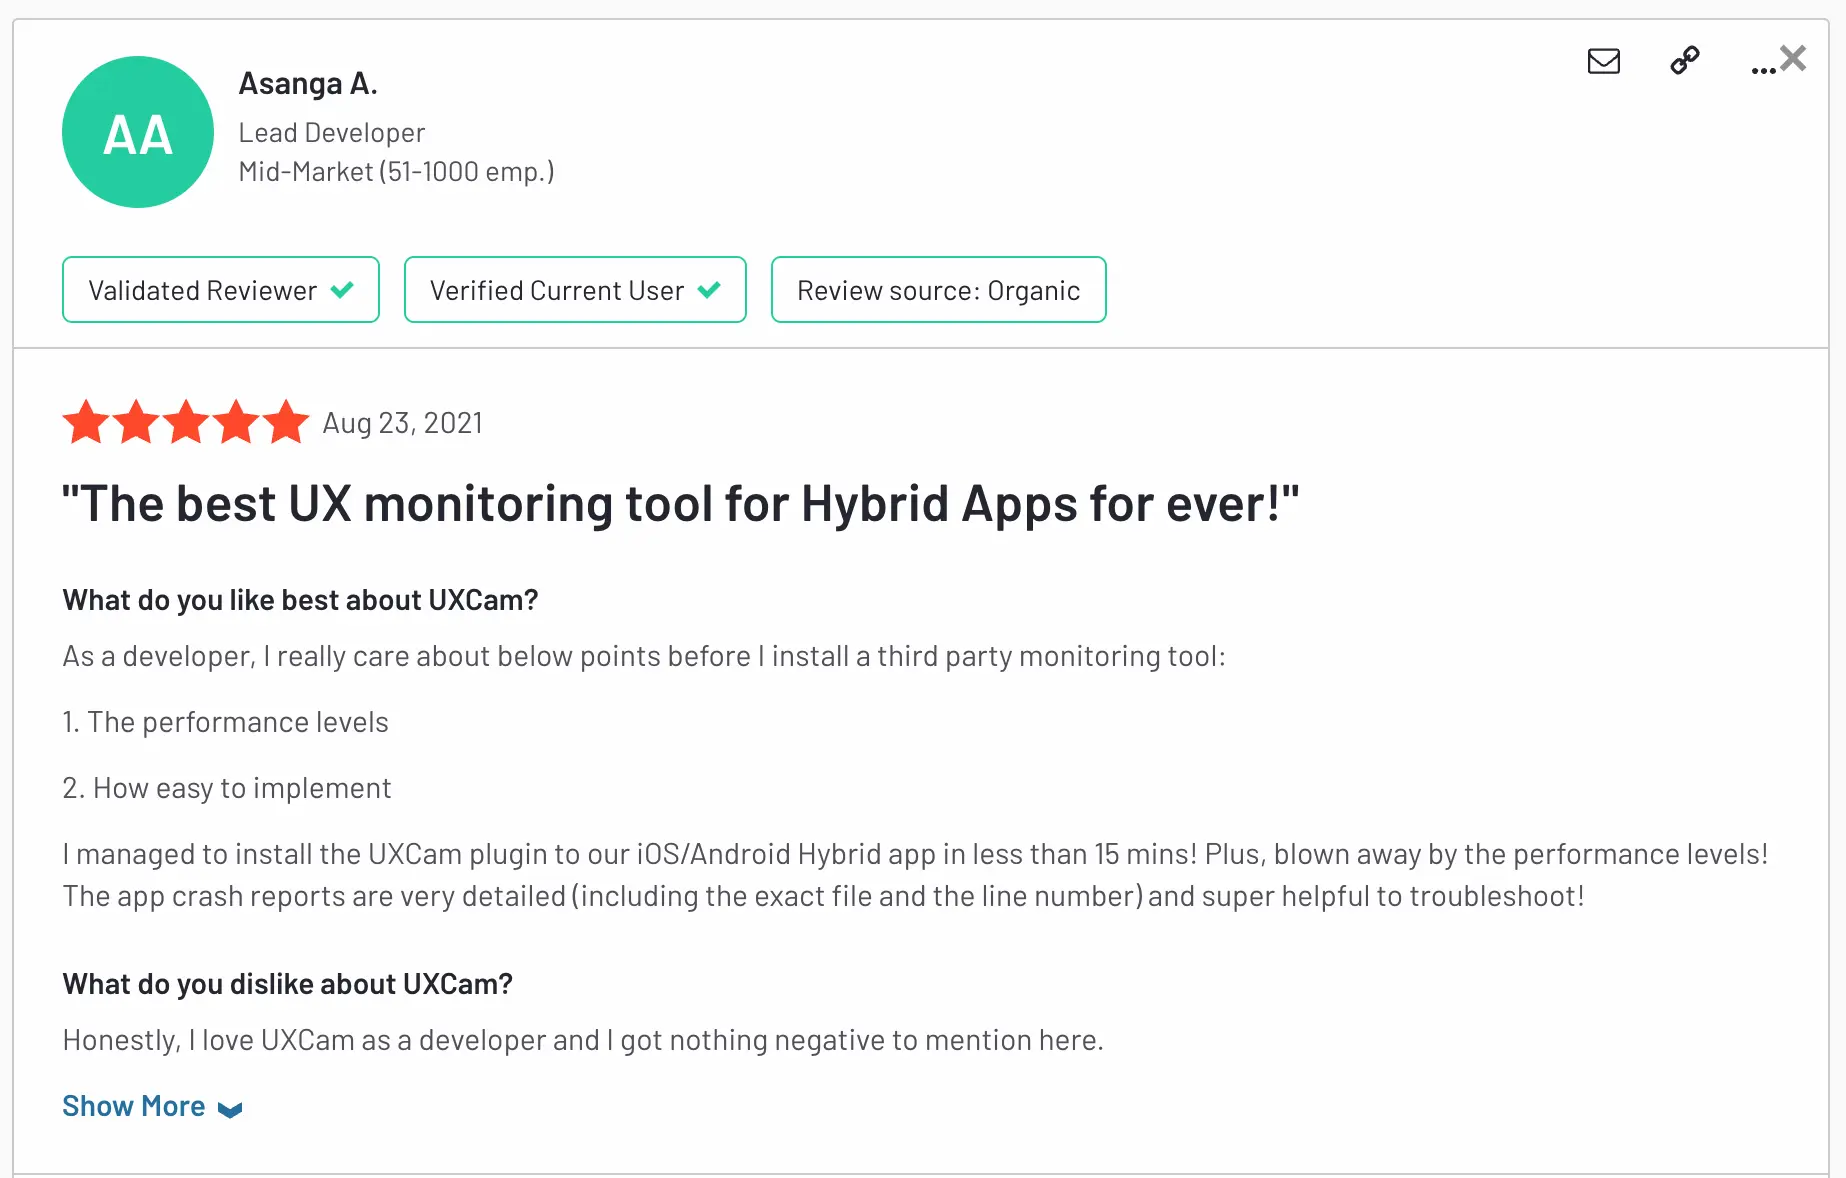
The best mobile product and engineering teams deploy UXCam to monitor their flutter apps, identify errors, get better insights, and resolve issues quickly.
You can request a demo to see how UXCam works if you have any questions.


Flutter DevTools
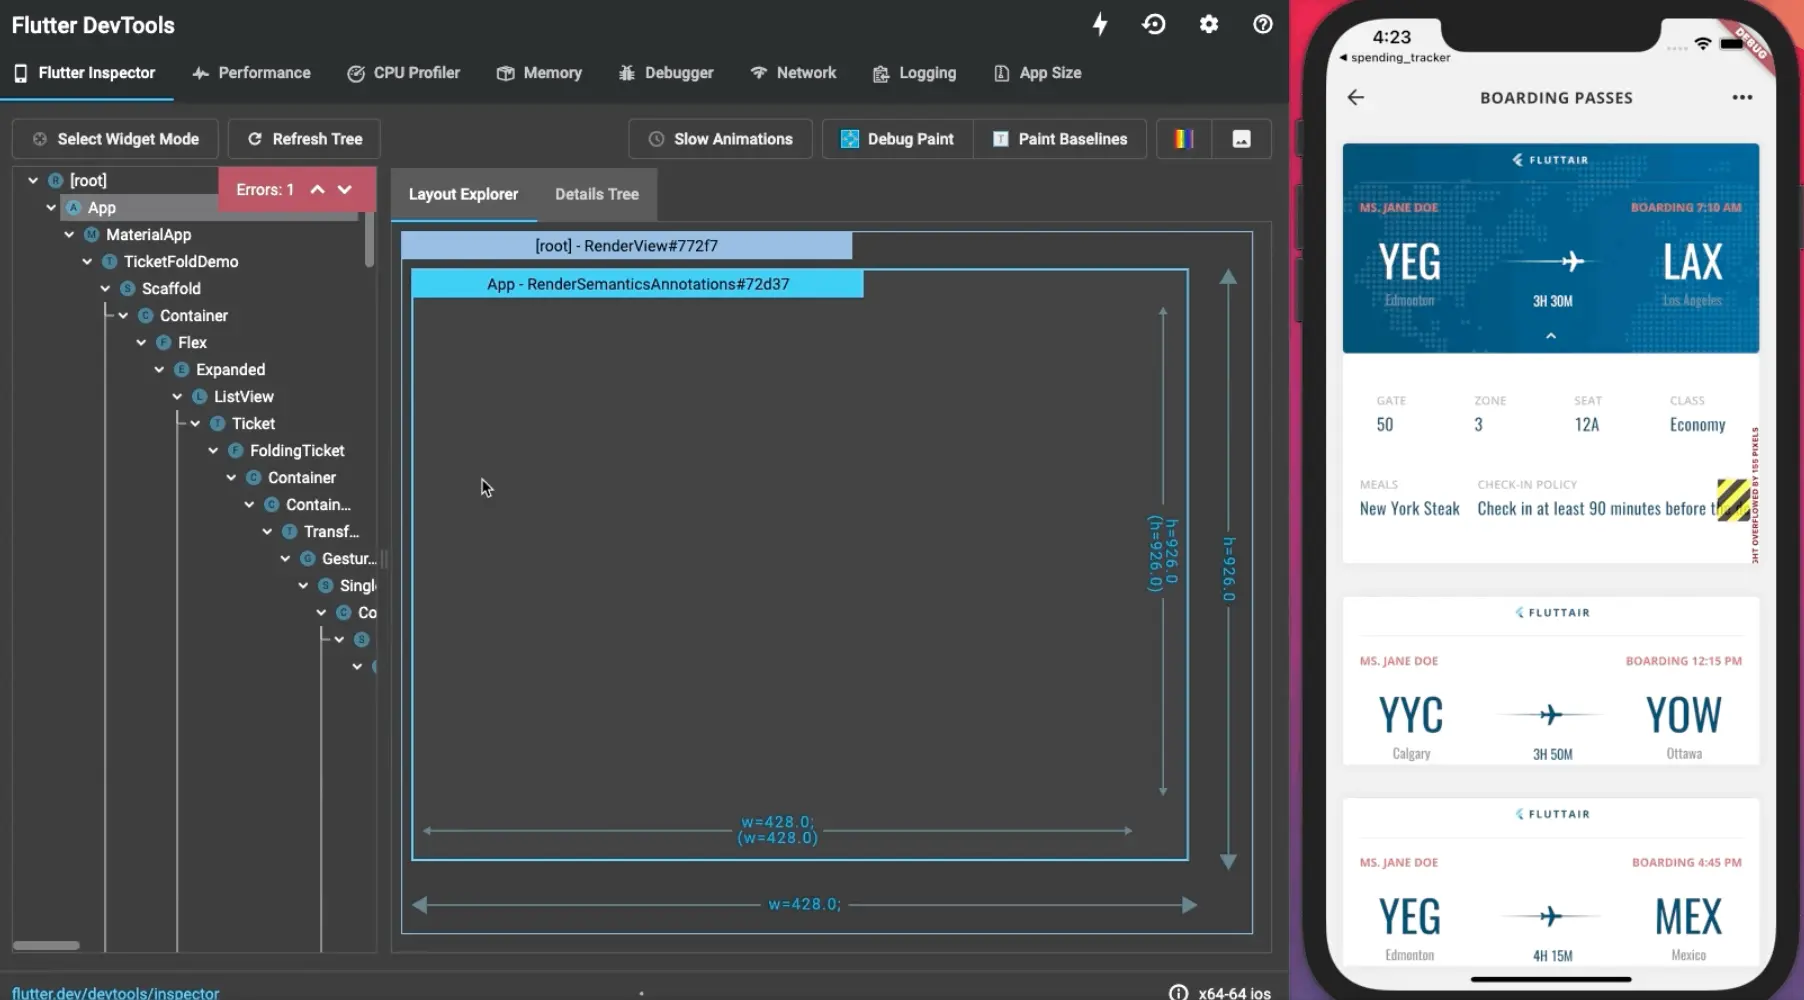
Flutter DevTools is a suite of performance monitoring and debugging tools for Flutter developers. It is a free, open-source project developed by the Flutter team, and it provides developers with a graphical user interface (GUI) to visualize the performance and behavior of their Flutter apps. The DevTools suite includes several tools, such as Timeline, Memory, and Inspector, that help developers debug and optimize their apps.


Key features
Timeline: provides a timeline of events that occur in the Flutter app, allowing you to see how long each frame takes to render and identify performance issues.
Memory: provides a visual representation of the memory usage of the app, allowing you to identify memory leaks and optimize memory usage.
Inspector: this allows you to inspect the hierarchy of widgets in your app and view their properties and state.
Network: allows your dev team to inspect the network requests made by your app and view the response data.
Logging: provides a console for you to view log messages from their app.
Pricing
Flutter DevTools is completely free and open-source.
Pros
Powerful debugging and performance monitoring tools: DevTools provides developers with a suite of tools that help them identify and fix performance issues and bugs in their apps.
Easy to use GUI: DevTools provides a graphical user interface that makes it easy for developers to visualize the behavior and performance of their apps.
Free and open-source: DevTools is completely free and open-source, making it accessible to developers of all levels and budgets.
Cons
Can be resource-intensive: Depending on the size and complexity of the app, running DevTools may consume a significant amount of system resources, potentially slowing down the app or the developer's computer.
Firebase Crashlytics
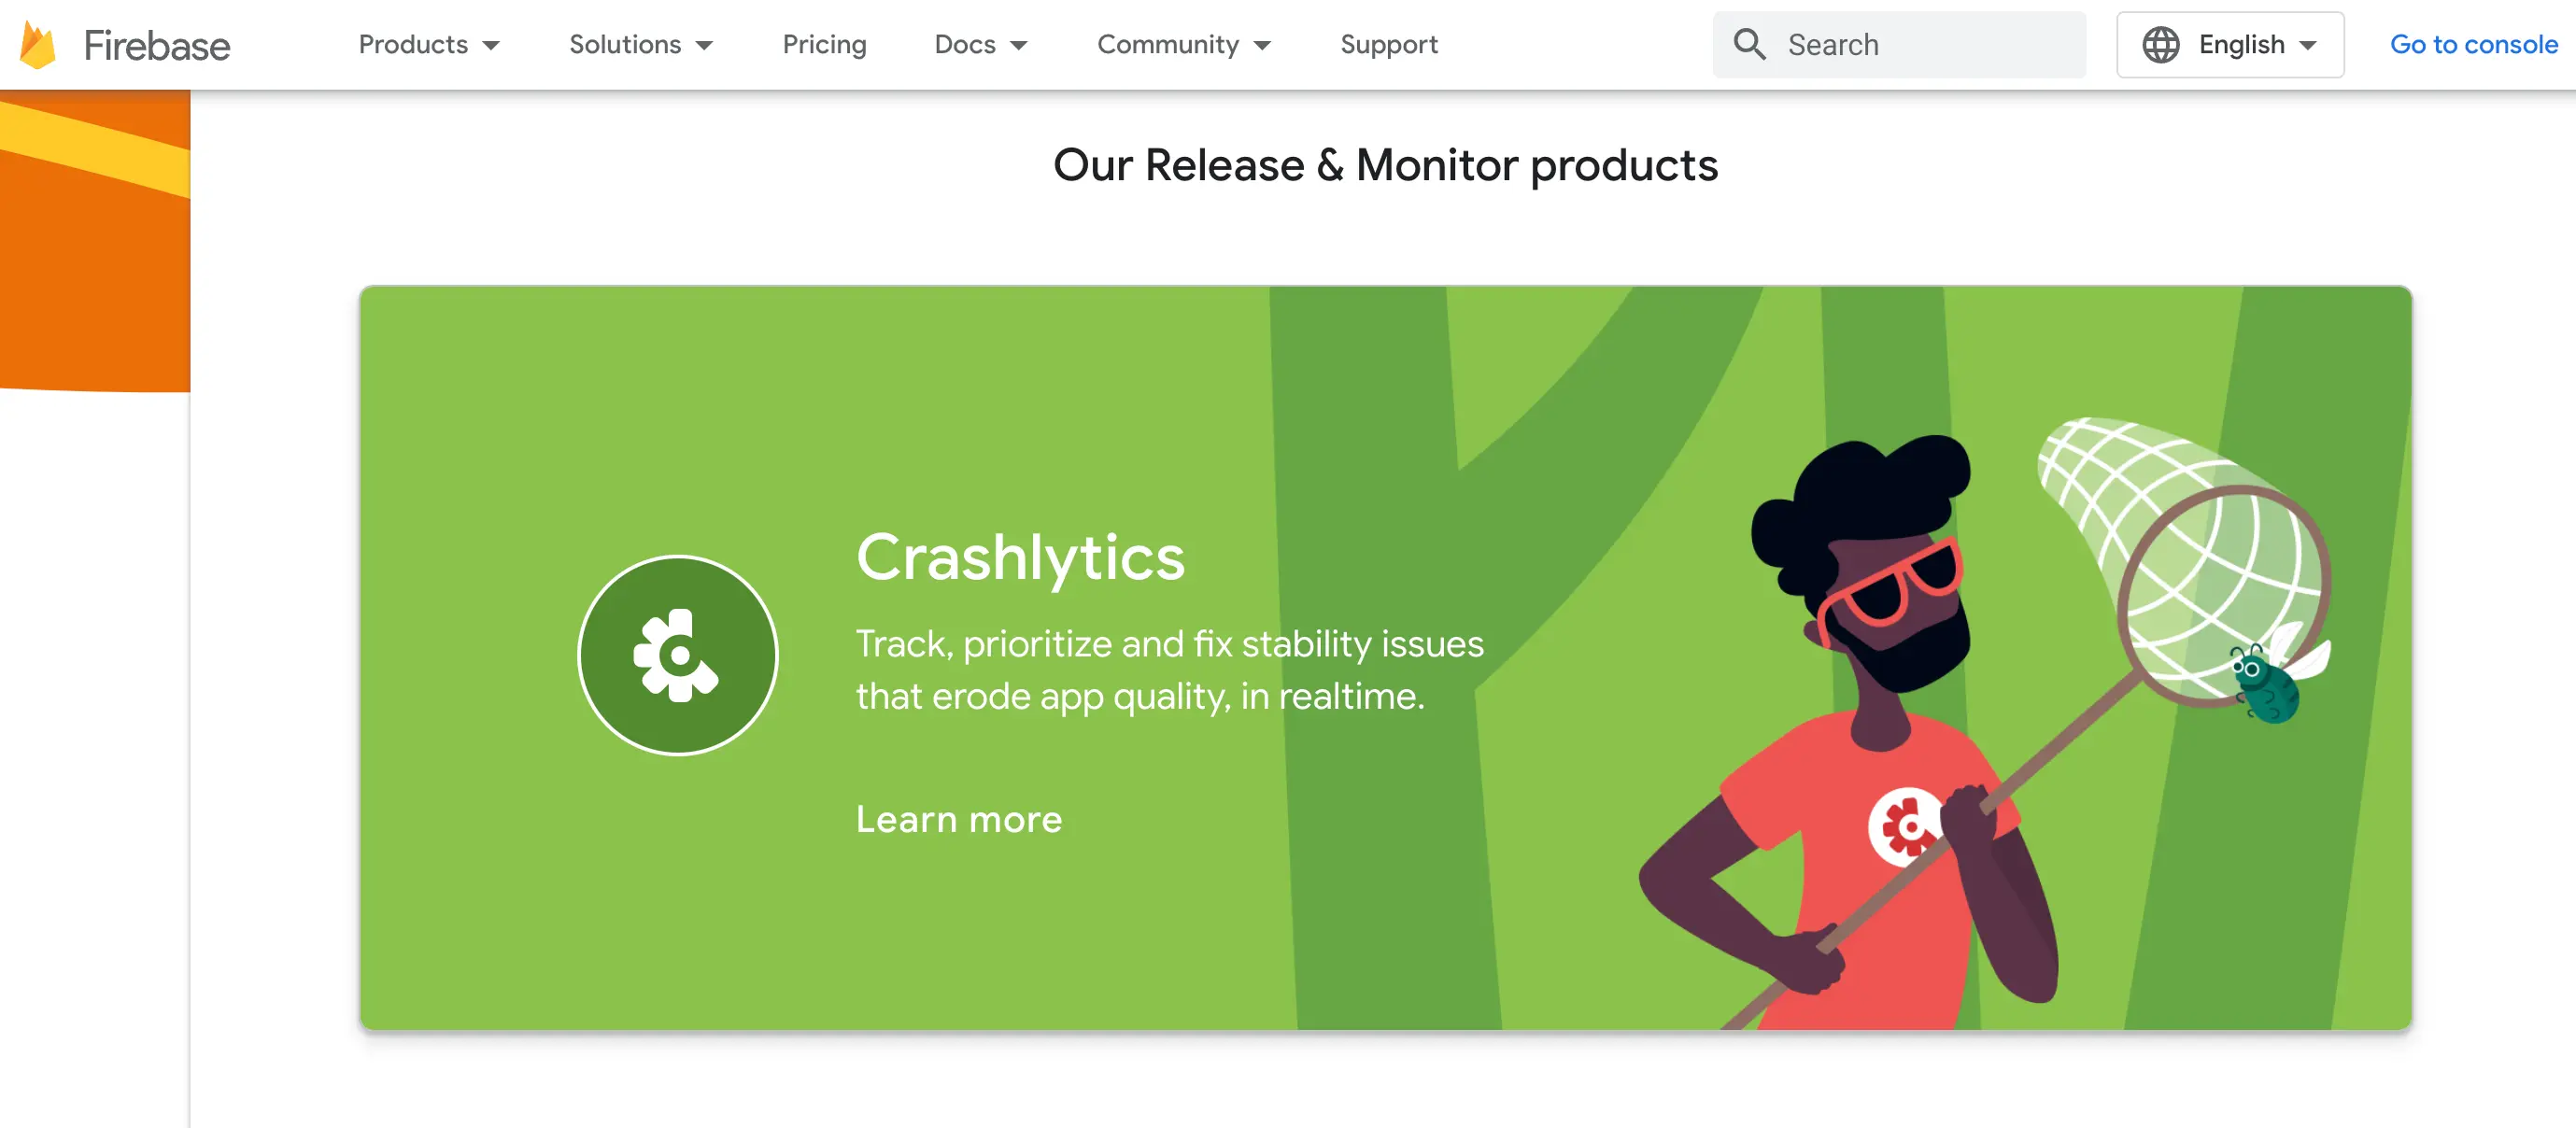
Firebase Crashlytics is a robust mobile app performance monitoring tool that helps you track, analyze, and improve the stability of your Flutter app. It is a part of the Firebase platform, which offers a comprehensive suite of app development tools and services. Firebase Crashlytics offers real-time insights into your app's crashes, errors, and performance issues, helping you identify and fix problems quickly.


Key features
Crash reporting: Firebase Crashlytics provides detailed crash reports that include information about the user's device, app version, and operating system, making it easier to identify and troubleshoot issues.
Real-time alerts: You'll receive real-time alerts whenever a crash occurs, allowing you to respond quickly and minimize the impact on your users.
Error tracking: Firebase Crashlytics tracks and reports on non-fatal errors, such as network failures, that can impact your app's performance.
Integration with Firebase: Firebase Crashlytics is fully integrated with other Firebase services, including Cloud Messaging, Analytics, and Performance Monitoring, allowing you to create a comprehensive performance monitoring strategy for your app.
Customization: You can customize Firebase Crashlytics to suit your needs by setting thresholds for specific errors or crashes, and by setting up automated alerts to notify you of issues.
Pricing
Firebase Crashlytics is available for free as part of the Firebase platform. However, there are usage limits for certain features, such as event tracking and data storage. If you exceed these limits, you will be charged based on your usage.
Pros
Real-time crash reporting: Firebase Crashlytics provides real-time alerts and detailed reports on app crashes, allowing you to respond quickly and minimize the impact on your users.
Integration with Firebase: Firebase Crashlytics is fully integrated with other Firebase services, making it easier to create a comprehensive performance monitoring strategy for your app.
Customization: You can customize Firebase Crashlytics to suit your needs by setting thresholds for specific errors or crashes, and by setting up automated alerts to notify you of issues.
Free to use: Firebase Crashlytics is free to use, making it accessible for developers of all sizes.
Cons
Limited functionality: While Firebase Crashlytics is a powerful tool, it may not offer all the features and capabilities that some developers require for comprehensive performance monitoring.
Dependency on Firebase: If you're not using Firebase as your app's backend platform, you may find it difficult to integrate Firebase Crashlytics with your existing infrastructure.
Types of App Performance Metrics
When it comes to app performance monitoring, it's essential to understand the various types of performance metrics. These metrics provide insights into how well your Flutter app is performing and help identify areas that may need improvement. Let's dive into some key performance metrics to consider.
1. Error and crash rates
Error and crash rates are important metrics to monitor when developing a Flutter app. These metrics provide insights into the stability and reliability of the app and help developers identify and fix issues before they become major problems. In this article, we'll explore the best tools and techniques for monitoring error and crash rates in Flutter apps.
2. UI Freeze
This metric measures how often your app's user interface becomes unresponsive or "freezes" for a period of time. UI freezes can be caused by a variety of factors, including inefficient UI rendering, blocking the UI thread with long-running operations, or excessive network or disk I/O.
3. Handled Exceptions
This is another crucial performance metric to measure your app's performance. It focuses on an app's ability to handle unexpected errors or exceptions that may occur during its operation. When an exception occurs, it can cause the app to crash, lose data, or behave unpredictably, resulting in a negative user experience.
4. App startup time
App startup time is the amount of time it takes for your app to launch and become fully functional. A slow startup time can frustrate users and lead to abandonment. Monitor your app's startup time and strive to make it as fast as possible, ensuring a positive first impression for your users.
5. CPU and Memory Usage
Monitoring CPU and memory usage helps you understand how efficiently your Flutter app utilizes device resources. High CPU and memory usage can lead to a sluggish app and poor user experience. Keep an eye on these metrics to optimize your app's resource consumption and ensure smooth performance.
How to improve Flutter app performance with UXCam
UXCam is a powerful tool that provides detailed insights into how users interact with your Flutter app, and it can be used for monitoring app performance. In this context, UXCam allows you to analyze app logs, which can help you identify and fix bugs, crashes, and UI freezes in record time. Here are four ways to use UXCam for Flutter app performance monitoring:
Monitor errors, crashes, and other issues all within one tool
UXCam enables you to identify bugs that weren't caught during the development process and the information you need for debugging. You can also verify that your application is working correctly by analyzing requests sent, calls initiated, etc.
Furthermore, you can analyze warnings triggered during the session, such as login failures, security verifications, invalid parameters, etc. You can even filter by log type or find a specific log within a session.


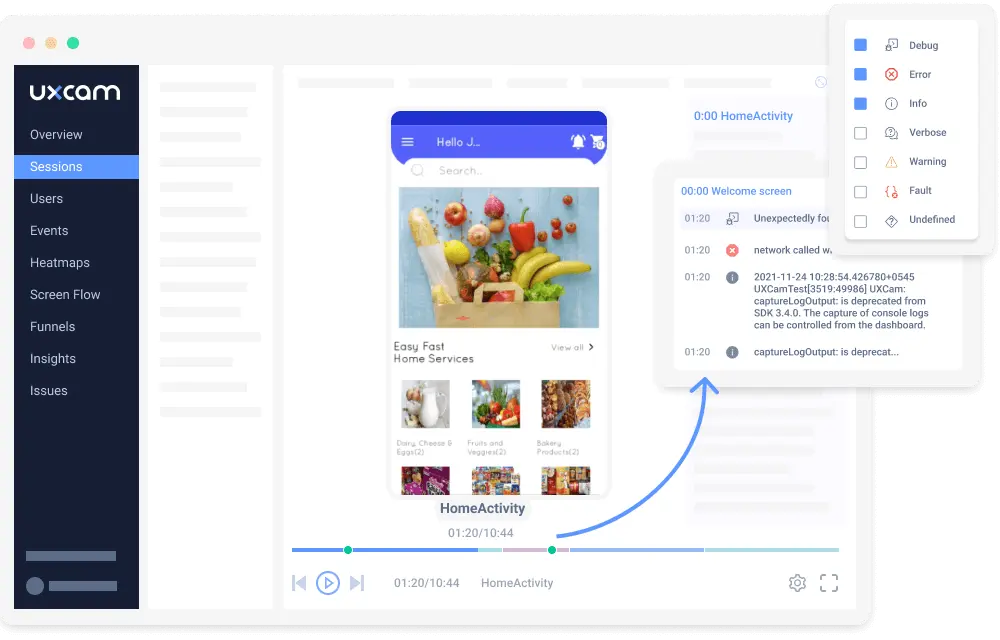
Analyze different types of logs
With UXCam, you can easily identify bugs that may have slipped through the cracks during the development process. By monitoring errors, crashes, and other issues, you can quickly pinpoint the root cause of the problem and get to work on a fix. This saves you time and helps ensure a smooth user experience.


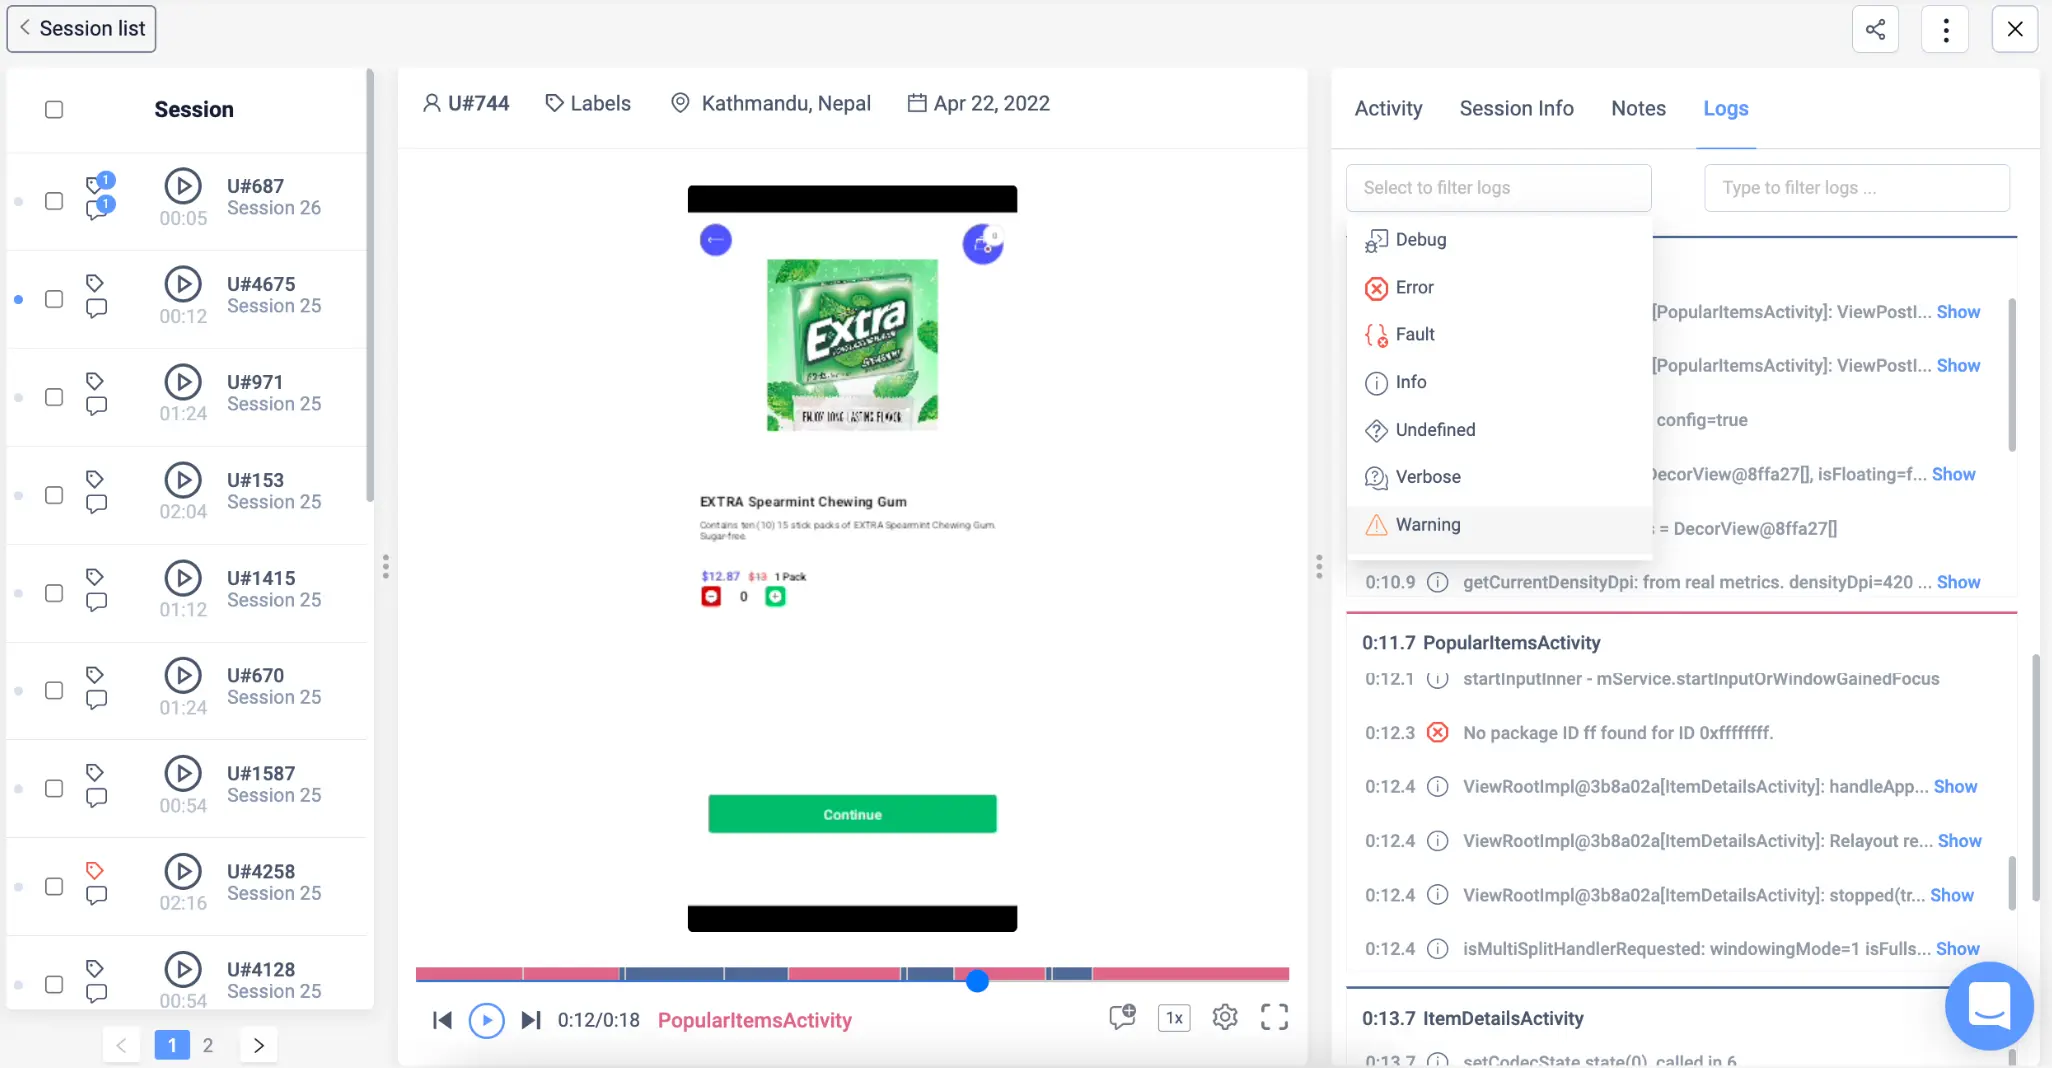
In your UXCam dashboard, you can find all these types of logs:
Error: a brief description of the problem encountered
Warning: it won't stop the application from running properly, but it’s something you could want to pay attention to, especially if in production.
Info: starting/stopping services, messages in the queue, etc.
Debug: information that would be helpful for troubleshooting issues (what information goes there depends on developers and what they want to capture).
Verbose: very detail level about the workflow, again, depending on what you want to capture in this tracing.
Fault: need to check with the team.
Undefined: if there’s nothing to evaluate on that log.
Enrich the analysis of the app logs with session replay
With UXCam, you can analyze gestures, actions, transitions between screens, and many other details. By comparing the information in the app logs with the device and network details that UXCam captures automatically, you can gain a better understanding of the issue at hand.
Additionally, you can use session labels to categorize sessions with different errors and collaborate with the team using notes and tags to analyze and fix the issue faster.


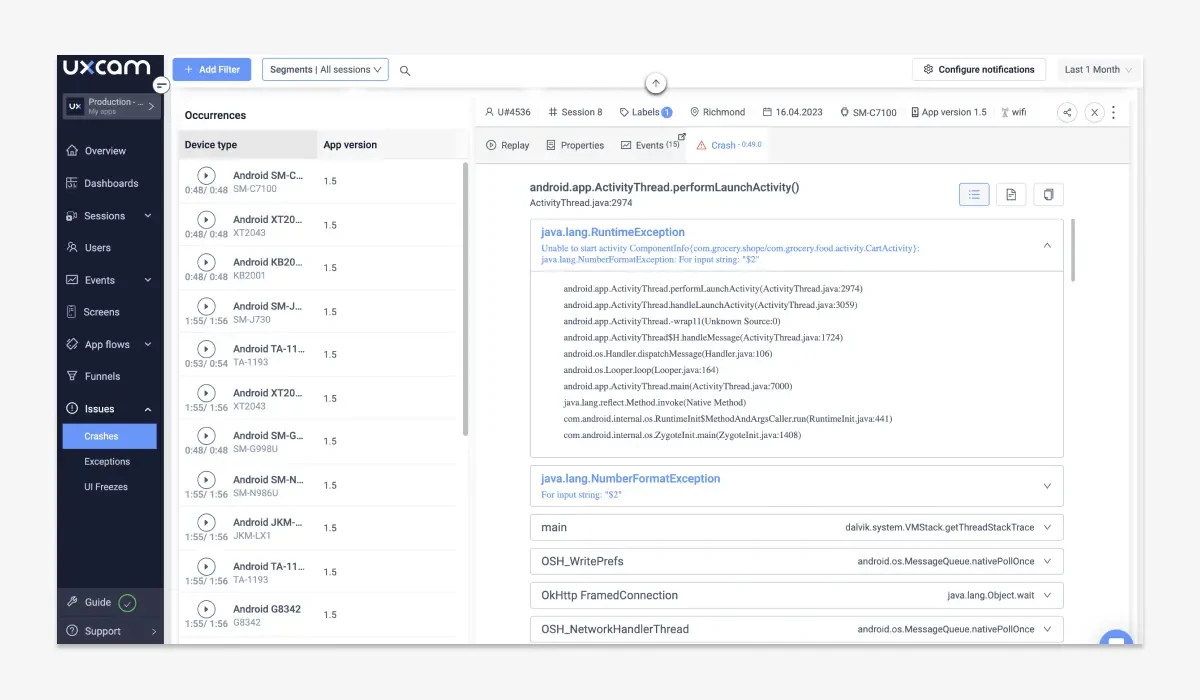
Analyze stack trace of handled exceptions
Use UXCam to log the exceptions that were caught in your app to help you with debugging and understand their impact on the user experience and app performance. Then, analyze the stack trace with the app logs to identify these exceptions and handle them more gracefully.
With app logs and session replay, you can analyze exceptions and understand which interaction in your app caused it, what the impact was on your app and features, and handle them more easily.


Understand the impact on user experience
By using UXCam to monitor app performance, you can find and solve the problems that affect the key processes of your application that prevent users from converting.


You can prioritize errors, bugs, and other issues based on their impact on user experience and product usage. This allows you to identify affected users and analyze their behavior to see how errors affect the experience.
Additionally, you can observe the impact of different technical problems of your application on the main KPIs.
Next-level performance monitoring for Flutter apps
UXCam provides a comprehensive application performance monitoring tool that delivers a unique blend of technical and user interface insights through session replay.
By leveraging this powerful tool, product teams can quickly identify and troubleshoot issues before they negatively impact the user experience. This, in turn, leads to higher user satisfaction, increased ROI, and reduced churn rates.
It's no wonder that UXCam is the go-to choice for thousands of product teams who consistently deliver exceptional user experiences. If you want to join the ranks of successful teams that rely on UXCam to keep their users happy, start a free trial with UXCam today and experience the benefits firsthand.
You might also be interested in the following:
Best Flutter crash reporting tool to manage app crashes
Mobile app analytics tool for Flutter
Flutter mobile app session recording & replay tool: UXCam
.NET MAUI vs. Flutter: Guide to choosing the right framework
AUTHOR
Tope Longe
Product Analytics Expert
Ardent technophile exploring the world of mobile app product management at UXCam.


Related articles


Conversion Analysis
React Native Crash Reporting + Best Tools and Techniques
Learn how to improve your mobile app's stability with effective React Native crash reporting. Explore the top techniques and tools for monitoring and managing...
Tope Longe
Product Analytics Expert
Conversion Analysis
Flutter Performance Monitoring - Best Tools and Techniques
In this article, we'll introduce you to the top Flutter performance monitoring tools and demonstrate how UXCam can help you monitor your app's performance with...
Tope Longe
Product Analytics Expert


Conversion Analysis
How to measure, analyze, and reduce app churn
All the user acquisition in the world won't matter if you've got a high churn rate on your app. If you want to know why users are uninstalling or unsubscribing, tools like screen flow, heatmaps, and screen recordings can get users loving — instead of leaving your...
Tope Longe
Product Analytics Expert