Top 5 Mobile App Churn Rate Benchmarks 2025


In this mobile churn rate benchmark guide, we will explore the concept of mobile app churn rate detail and show important benchmarks to track to help you understand how your app is performing. We'll also look at strategies to reduce the churn rate and keep users loyal.
How to calculate mobile app churn rate
Calculating mobile app churn rate accurately requires three measurements:
Total users at the start of the given period.
Total users at the end of the given period.
Total new users at the end of a given period.
The formula for calculating mobile app churn rate is:
((Total Users at End – New Users at End) / Total Users at Start) X 100%


Mobile app churn rate benchmarks
1. Day-one churn rate
The day-one retention rate is an important metric indicating the percentage of users who continue using an app after the initial 24 hours following installation.
The average day-one retention rate is approximately 25%, emphasizing the significance of retaining a quarter of users within the first day.
2. Day-seven churn rate
This metric gauges user engagement by revealing the percentage of users who continue using the app seven days after the installation date.
The benchmark for day-seven retention rate is 10.7%, illustrating the challenge of maintaining user interest beyond the first week.
3. Day-thirty churn rate (shopping apps)
Specifically applicable to shopping apps, the day-thirty retention rate reveals the percentage of users who continue using the app thirty days after installation.
For shopping apps, the average day-thirty retention rate is 5.6%, highlighting the unique challenges in sustaining user engagement in the realm of online shopping.
4. Three-month churn rate (general)
This metric measures the percentage of users who persist in using the app three months after the initial installation, providing insights into long-term user retention.
The global average for three-month retention is 29%, implying that nearly a third of users continue using the app after the crucial three-month mark, while 71% disengage during this period.
5. App abandonment rate
App abandonment rate reflects the percentage of users who abandon an app after only a single use.
In 2019, the global app abandonment rate was 25%, underscoring the challenge of making a lasting impression on users from the very first interaction.
These benchmarks serve as vital tools for tracking and comparing an app's performance over time. It's important to note that these are averages, and actual rates can vary based on factors like the type of app, its features, user experience, and the specific industry or market it serves.
By understanding and analyzing these metrics, app developers and businesses gain valuable insights into user behavior, enabling them to refine strategies for enhanced user retention and overall app success.
Why is it important to monitor mobile app churn rate?
Revenue impact
Churn rate directly impacts your app’s revenue. The higher the churn rate, the fewer users you have to monetize through ads, in-app purchases, subscriptions, etc.
According to recent research, lowering the churn rate by just 4% can boost the revenue by $11,150 in only half a year. This indicates that even minor enhancements in churn rate can result in significant revenue growth.
Improve customer acquisition cost (CAC)
Acquiring new users can be expensive. If your churn rate is high, you’re losing a significant portion of your investment in user acquisition. Data shows attracting a new customer costs 5X more than retaining an existing one.
Promotes user retention and adoption
Churn rate is a key indicator of user retention and adoption. A high churn rate could indicate that users are not finding value in your app, which could be due to various factors like poor user experience, lack of engaging content, or technical issues.
JobNimbus is a great example.
The product faced challenges with a high churn rate and a low app store rating. They identified that their app was poorly designed and did not meet the needs of their users, particularly those who were not tech-savvy. To address these issues, JobNimbus used UXCam to gain both quantitative and qualitative data about their users' behaviors and pain points.


To improve retention, JobNimbus used device data from UXCam to identify which operating systems (OS) to support. By monitoring their users' device models and OS versions, they were able to determine the number of users still using older phones with outdated OS. This allowed them to strategically decide when to stop supporting older versions.


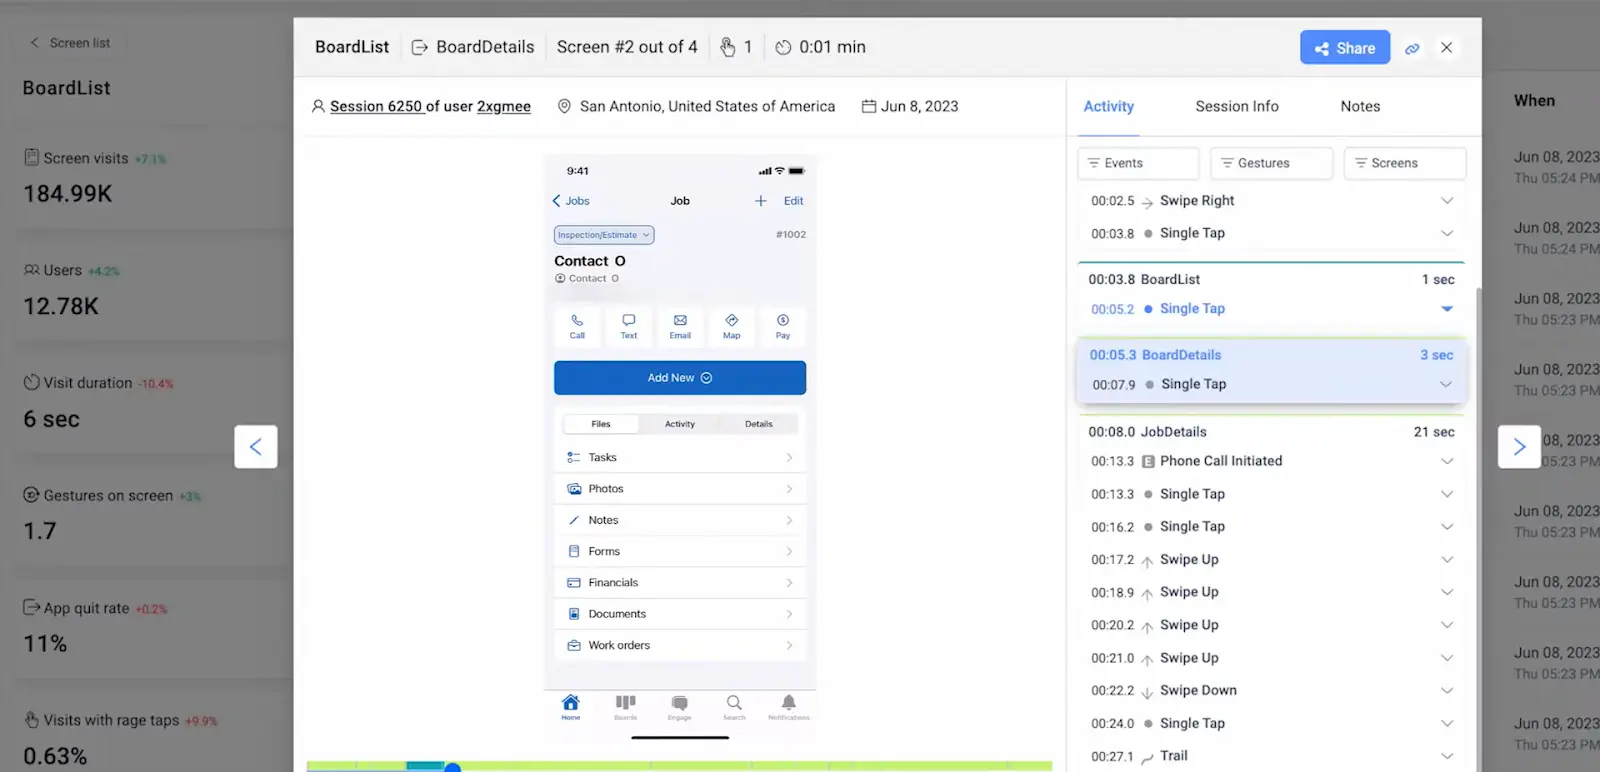
Additionally, by using UXCam to track adoption rates of new features, JobNimbus gained insights into user behavior. One important finding was a high adoption rate for the Kanban Board feature in their mobile app. Based on this, they adjusted their product roadmap and prioritized this feature over creating a separate version for the web. JobNimbus was able to rebuild their app, improve their app store rating from 2.5 stars to 4.8 stars, and transform churn into a top retention reason.
Mobile app churn rate calculation examples
If you had 1,000 users at the start of a month, and you gained 20 new users but only ended up with 980 at the end of the month, your churn rate would be:
((1,000 – 20) / 980) X 100% = 1.8%
If you had 1,000 users at the start of a month, and you gained 100 new users but only ended up with 1,050 at the end of the month, your churn rate would be:
((1,050 – 100) / 1,000) X 100% = 5.0%
Note: If you don’t subtract new users, you’re actually calculating the growth rate rather than the churn rate. Still an important metric, but very different, so make sure you’re consistent in your approach.
Conclusion
Navigating the ever-changing world of mobile app churn is a challenging (but important) task for both developers and businesses. By examining key metrics like day-one, day-seven, day-thirty, and three-month retention rates, as well as app abandonment rate, we can gain valuable insights into user engagement and identify areas that need improvement.
It's all about understanding how users interact with our apps and addressing any issues that may arise along the way.
Looking for a tool that supports churn analysis? UXCam is an all-in-one product analytics platform for mobile app teams. It gives you access to a wealth of app and user behavior data that you can use to reduce churn and build better products.
Sign up for free and elevate your app's UX to new heights.
You might also be interested in these;
How to measure, analyze, and reduce app churn
How to increase mobile app retention: ultimate guide
Mobile app retention benchmarks by industries
AUTHOR
Tope Longe
Product Analytics Expert
Ardent technophile exploring the world of mobile app product management at UXCam.


Related articles


Conversion Analysis
React Native Crash Reporting + Best Tools and Techniques
Learn how to improve your mobile app's stability with effective React Native crash reporting. Explore the top techniques and tools for monitoring and managing...
Tope Longe
Product Analytics Expert


Conversion Analysis
Flutter Performance Monitoring - Best Tools and Techniques
In this article, we'll introduce you to the top Flutter performance monitoring tools and demonstrate how UXCam can help you monitor your app's performance with...
Tope Longe
Product Analytics Expert


Conversion Analysis
How to measure, analyze, and reduce app churn
All the user acquisition in the world won't matter if you've got a high churn rate on your app. If you want to know why users are uninstalling or unsubscribing, tools like screen flow, heatmaps, and screen recordings can get users loving — instead of leaving your...
Tope Longe
Product Analytics Expert