Back to blog
10 MIN READ
Web Analytics Dashboard Examples and How to Use Them
PUBLISHED
14 November, 2024

Product Analytics Expert
A web analytics dashboard consolidates your key website metrics, providing real-time insights into traffic, user behavior, and performance.
You rely on data to drive your website’s success. Dashboards make this data accessible and actionable, enabling you to make informed decisions.
Whether you’re a product manager, marketer, or analyst, understanding key metrics is essential. Dashboards offer a clear view of your site’s performance and marketing effectiveness.
In this post, we’ll explore various web analytics dashboard examples, each highlighting unique features and tailored use cases. You'll earn to use these dashboards effectively to monitor performance, optimize marketing strategies, and enhance user experience
Web analytics dashboard examples
Understanding different web analytics dashboards can help you choose the right one for your needs. Let's explore some of the best dashboard for web analytics and how you can use them effectively.
User experience dashboard
A UX dashboard helps you enhance website usability and user satisfaction by analyzing interactions.
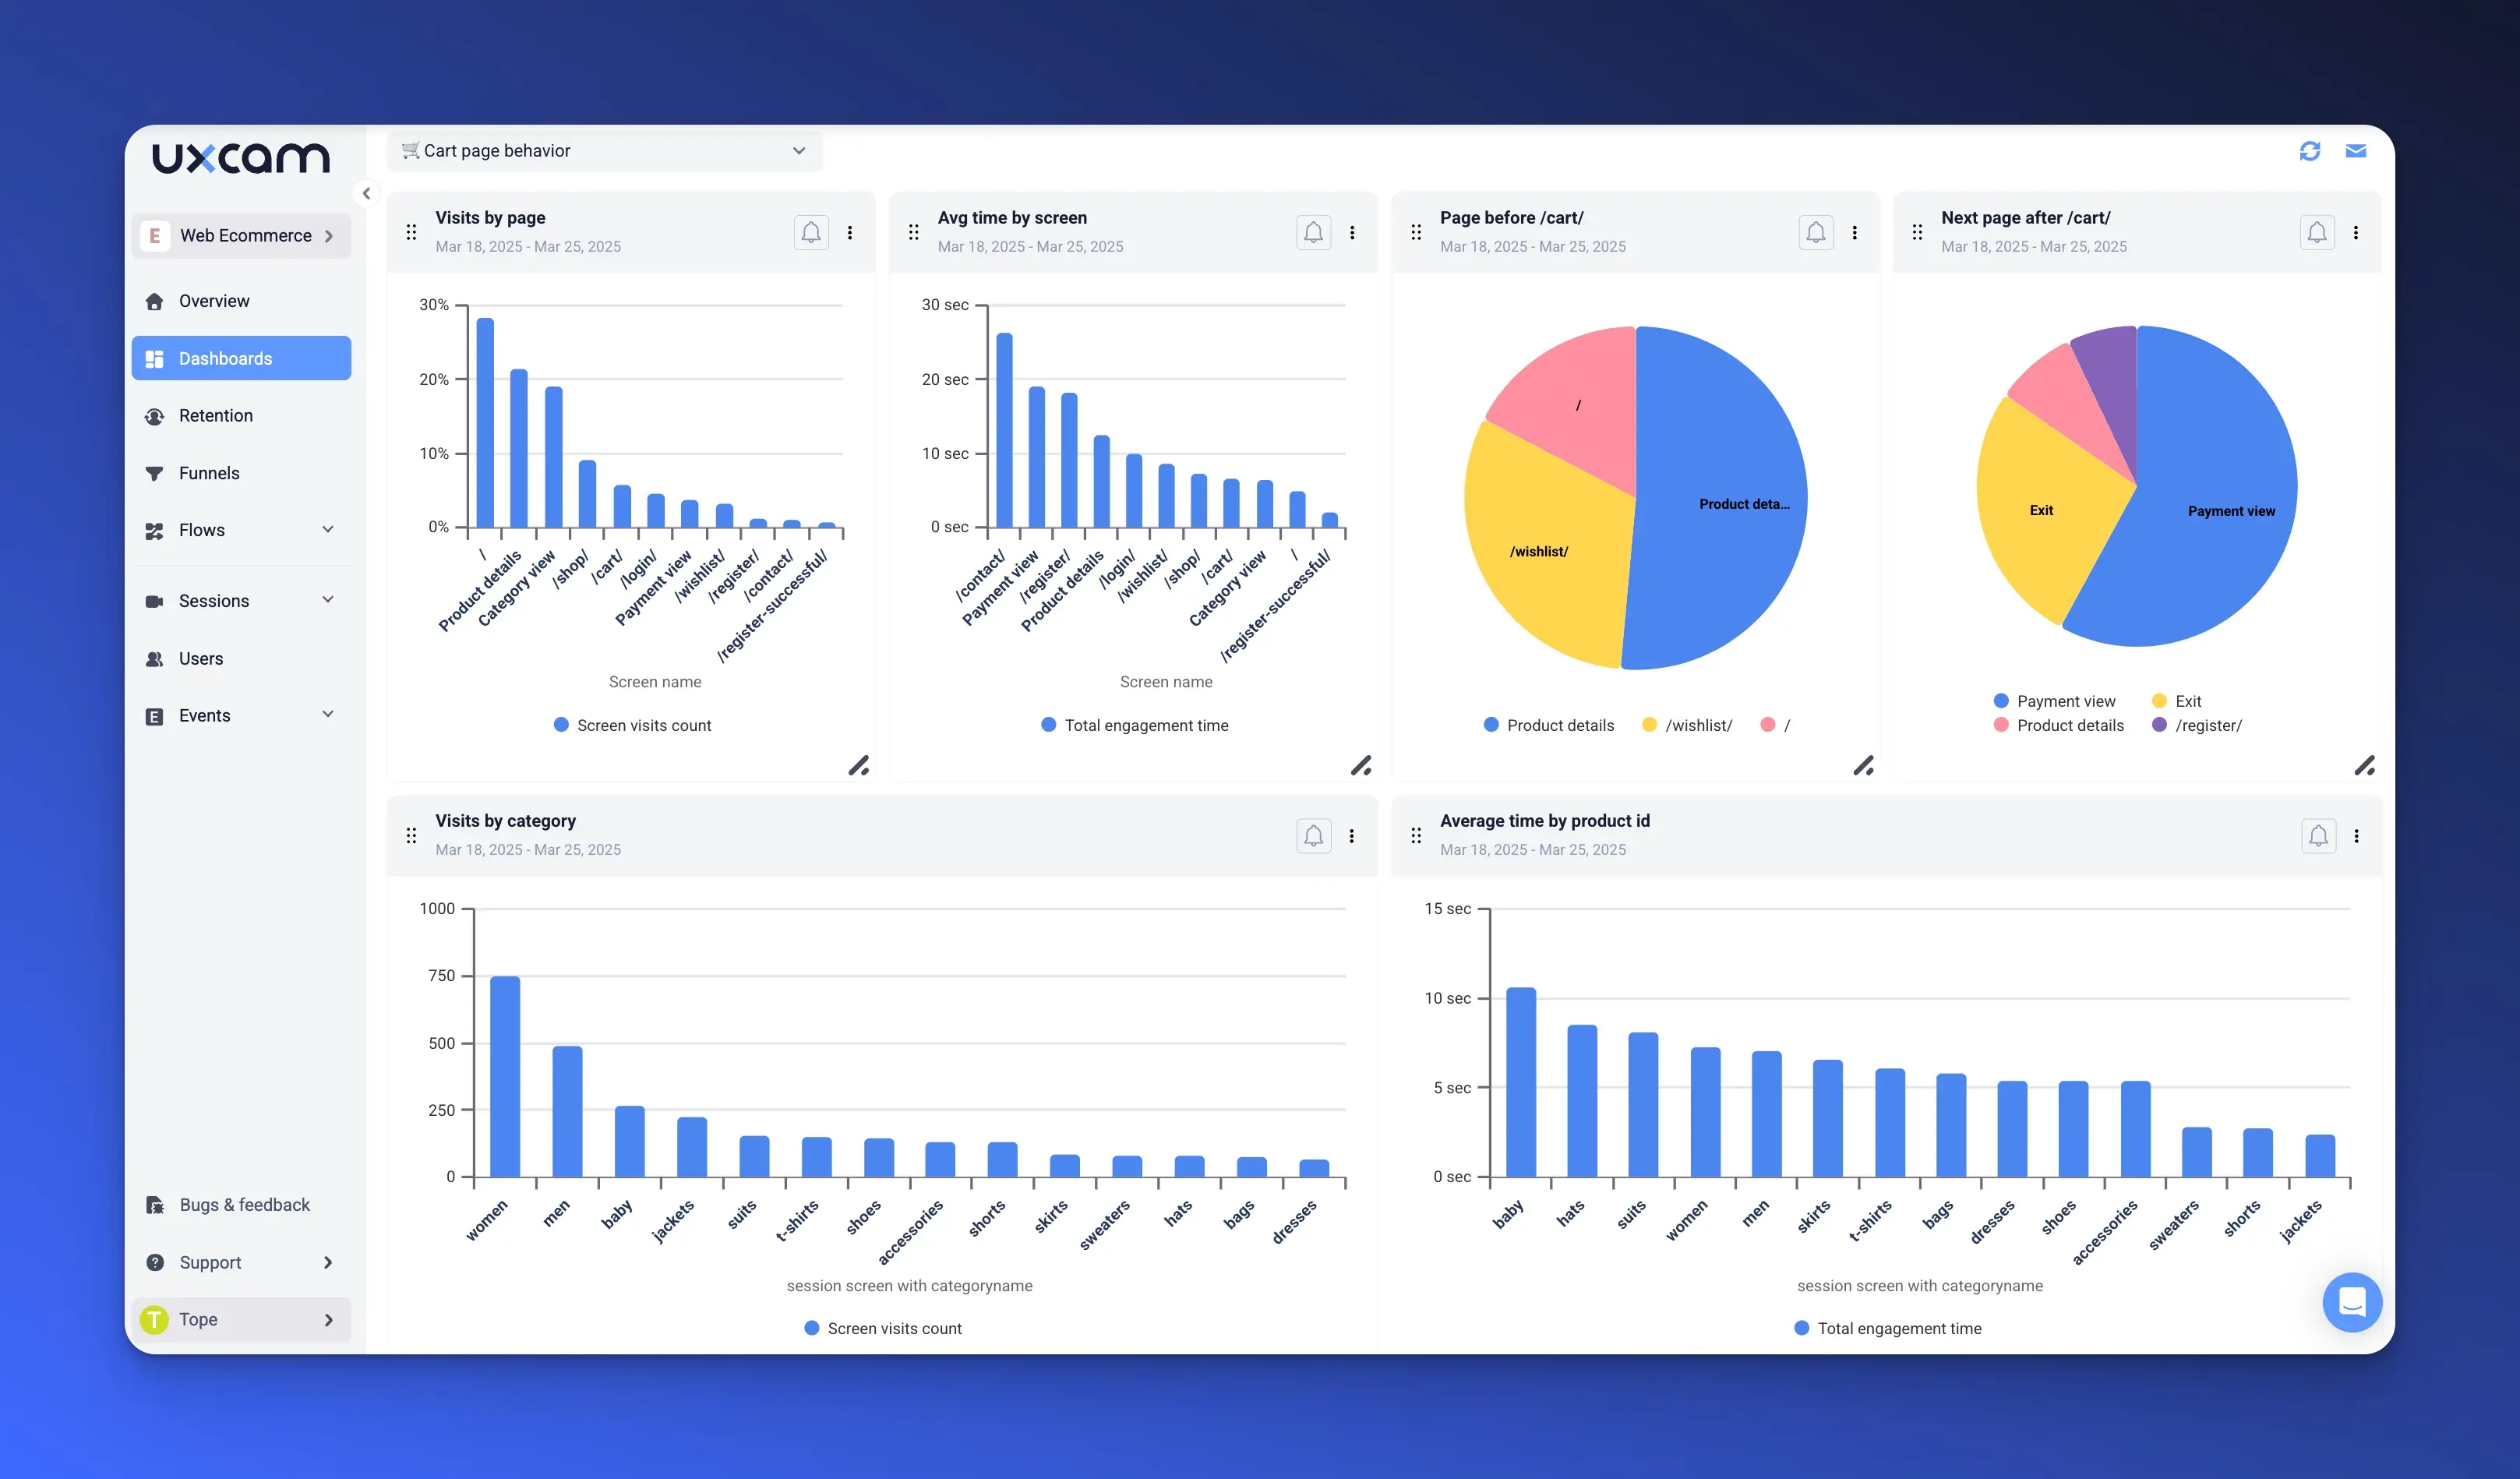
Key Metrics:
User Session Duration: Understand how long visitors stay on your site.
Page Load Times: Identify slow pages that may frustrate users.
Click Heatmaps: See where users click the most.
Session Replays: Watch recordings of user sessions to observe behavior.
User Feedback Scores: Collect direct feedback on user satisfaction.
Task Completion Rates: Measure how often users complete desired actions.
Recommended tools:
Hotjar: Provides heatmaps and session recordings.
UXCam for web: Offers in-depth analysis of user interactions including session replay and heatmaps.
Why you should choose UXCam for Web
UXCam empowers you to move faster, make better decisions, and build better products by combining powerful quantitative insights with qualitative context.
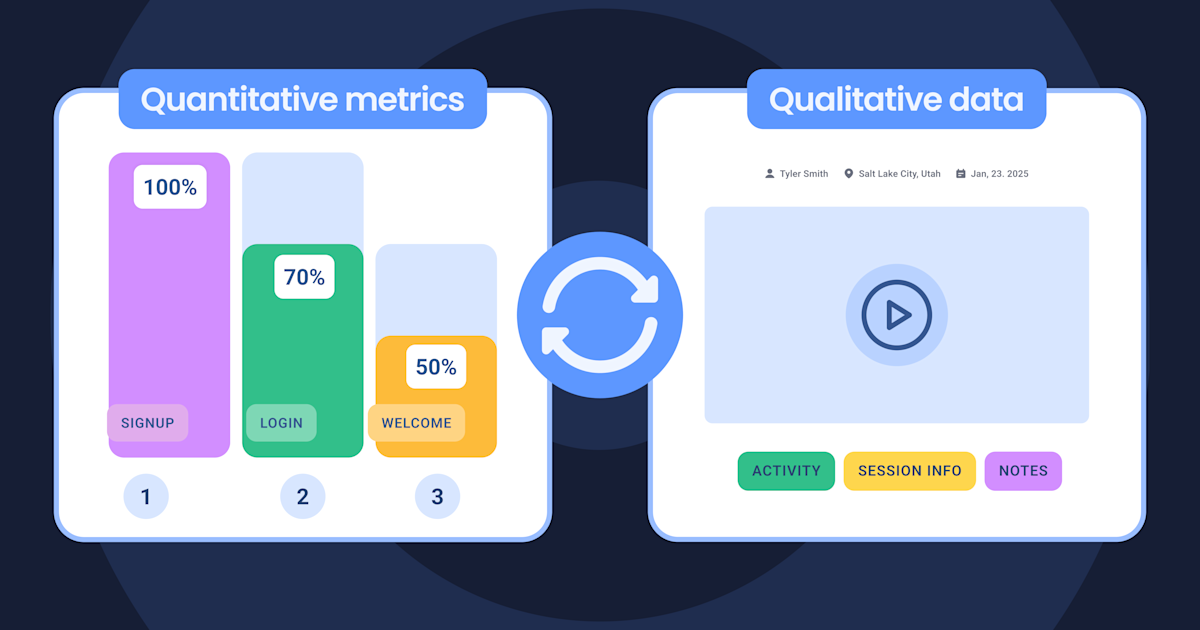

Most analytics tools force you to jump between dashboards, spreadsheets, and session replay apps to piece together a full picture. UXCam removes that friction with a native connection between product analytics and session replay, all from a single SDK. This means:
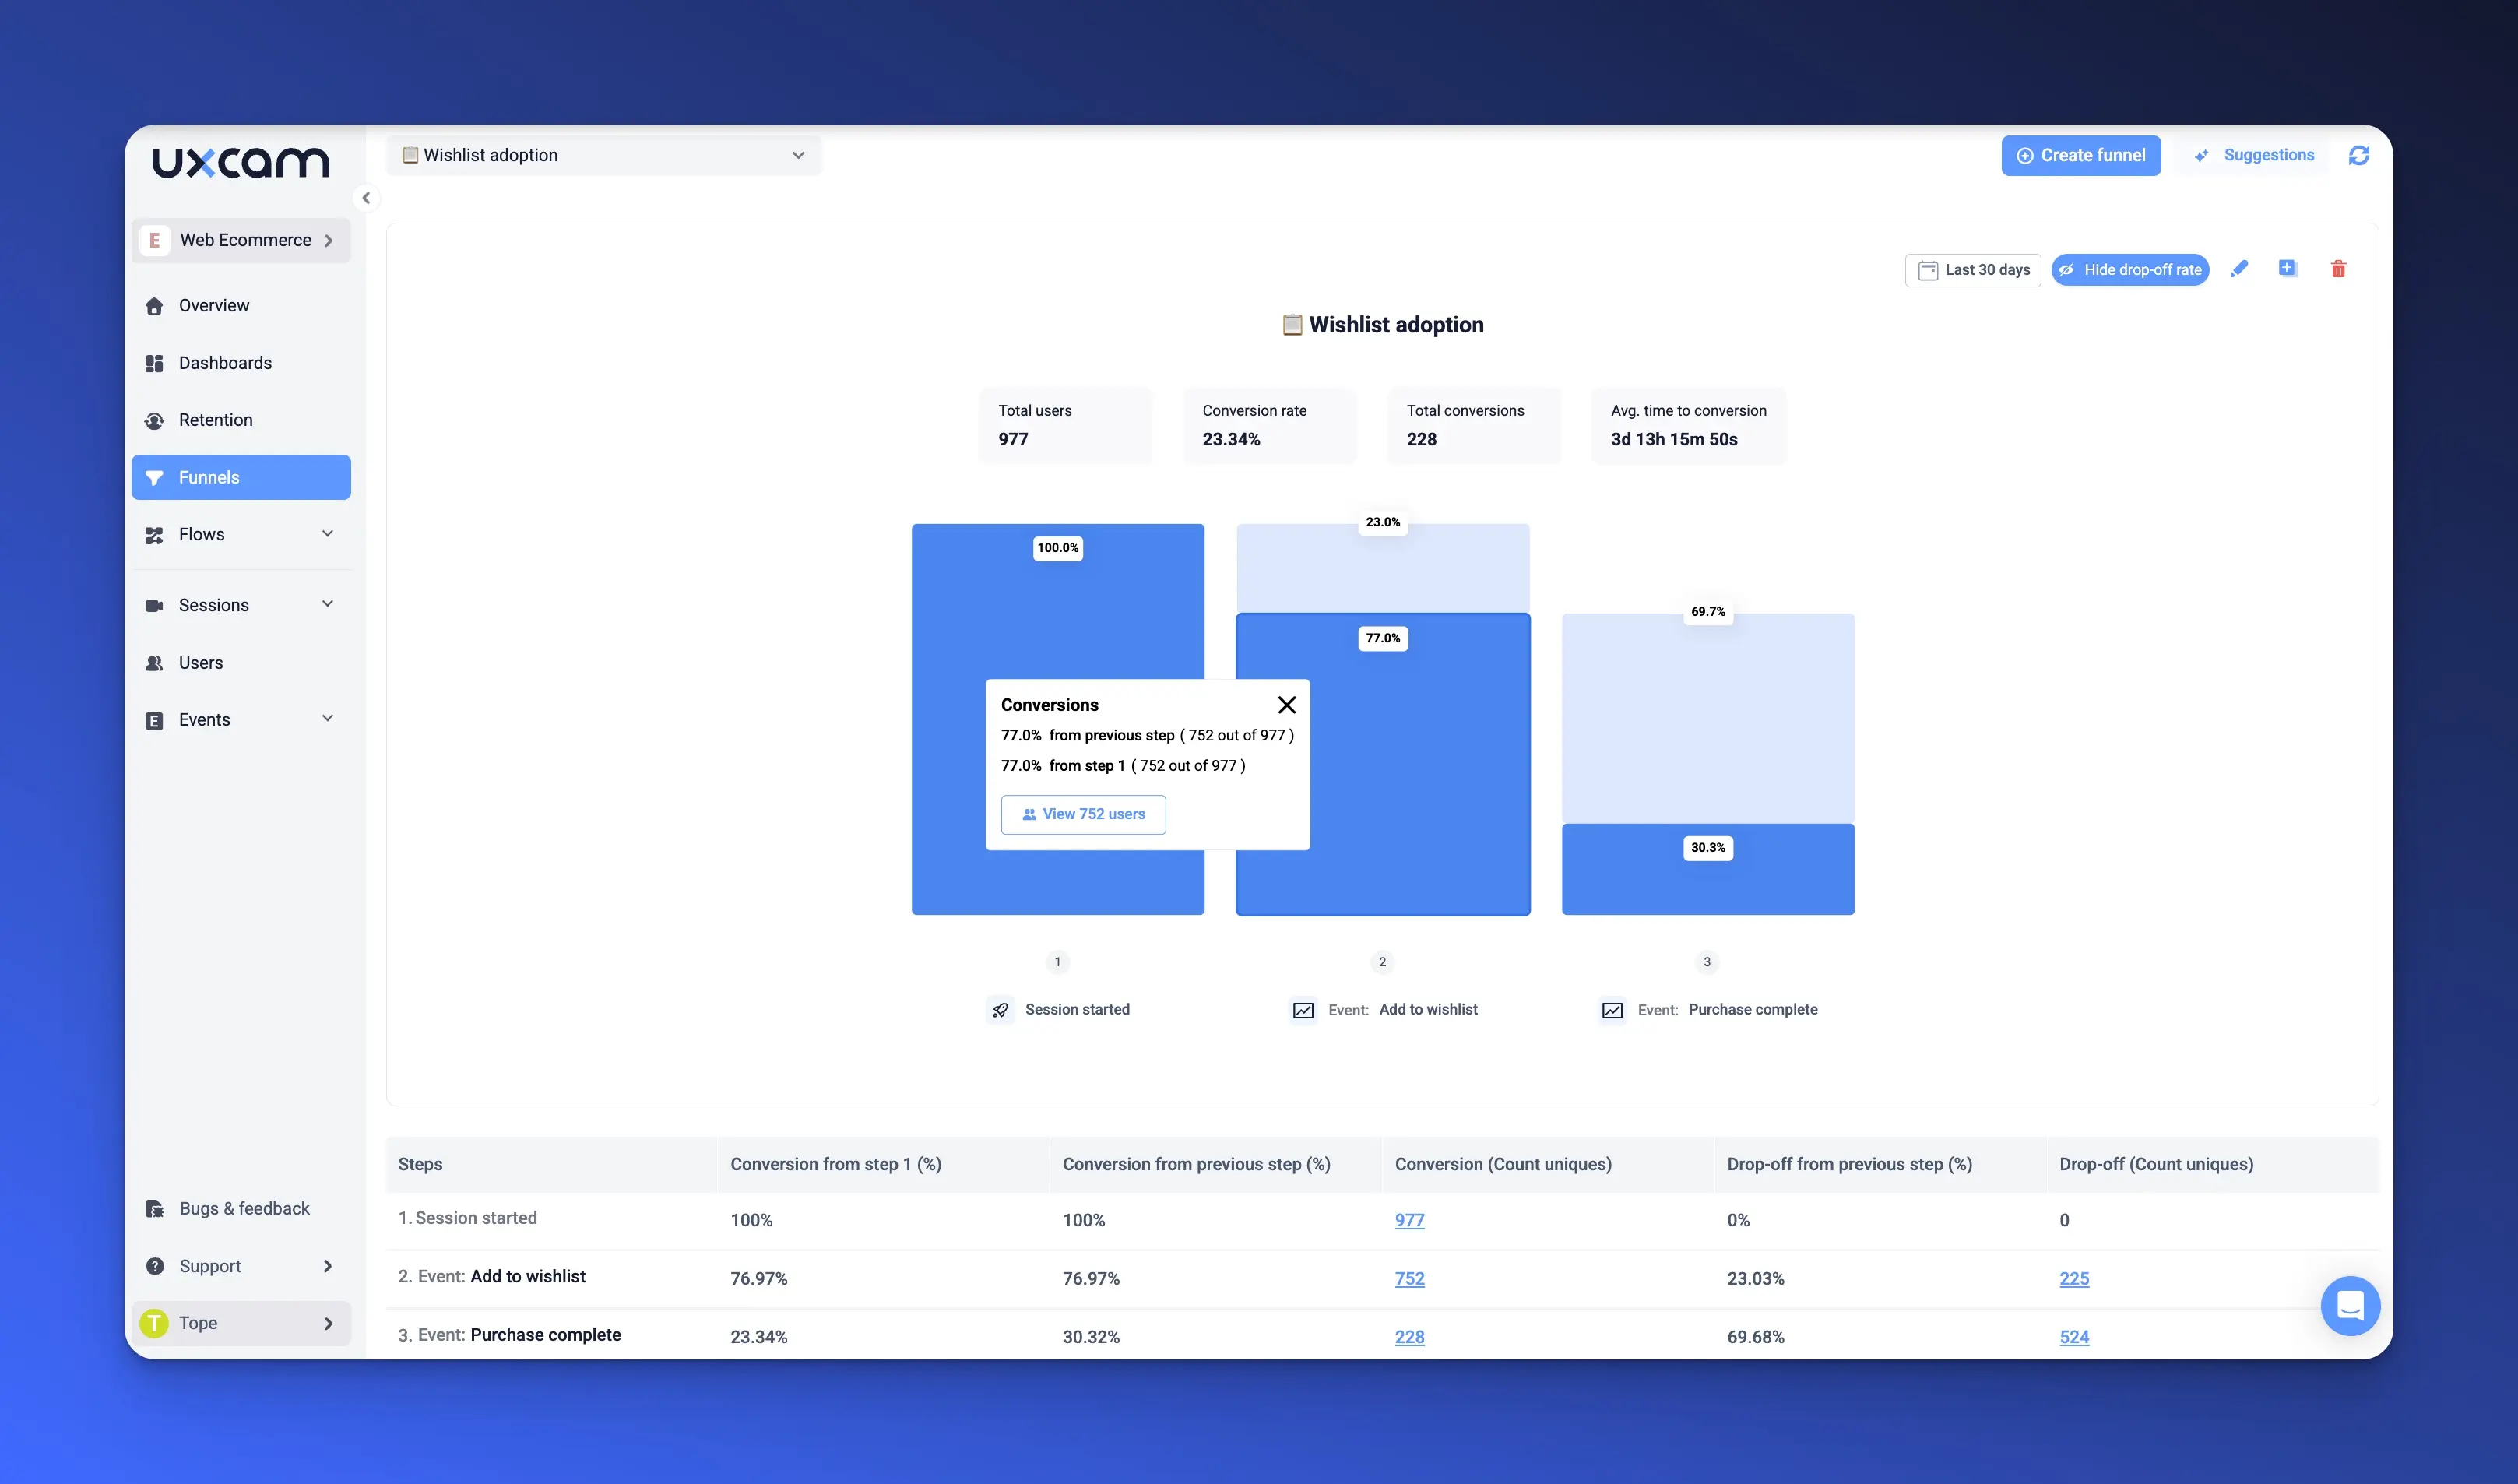
Spot a drop in your funnel? Jump straight into session replays of affected users.
See unusual behavior in a report? Click into sessions without losing context.
Want to analyze rage clicks or abandoned flows? Filter and view instantly.
Quick to set up, easy to use
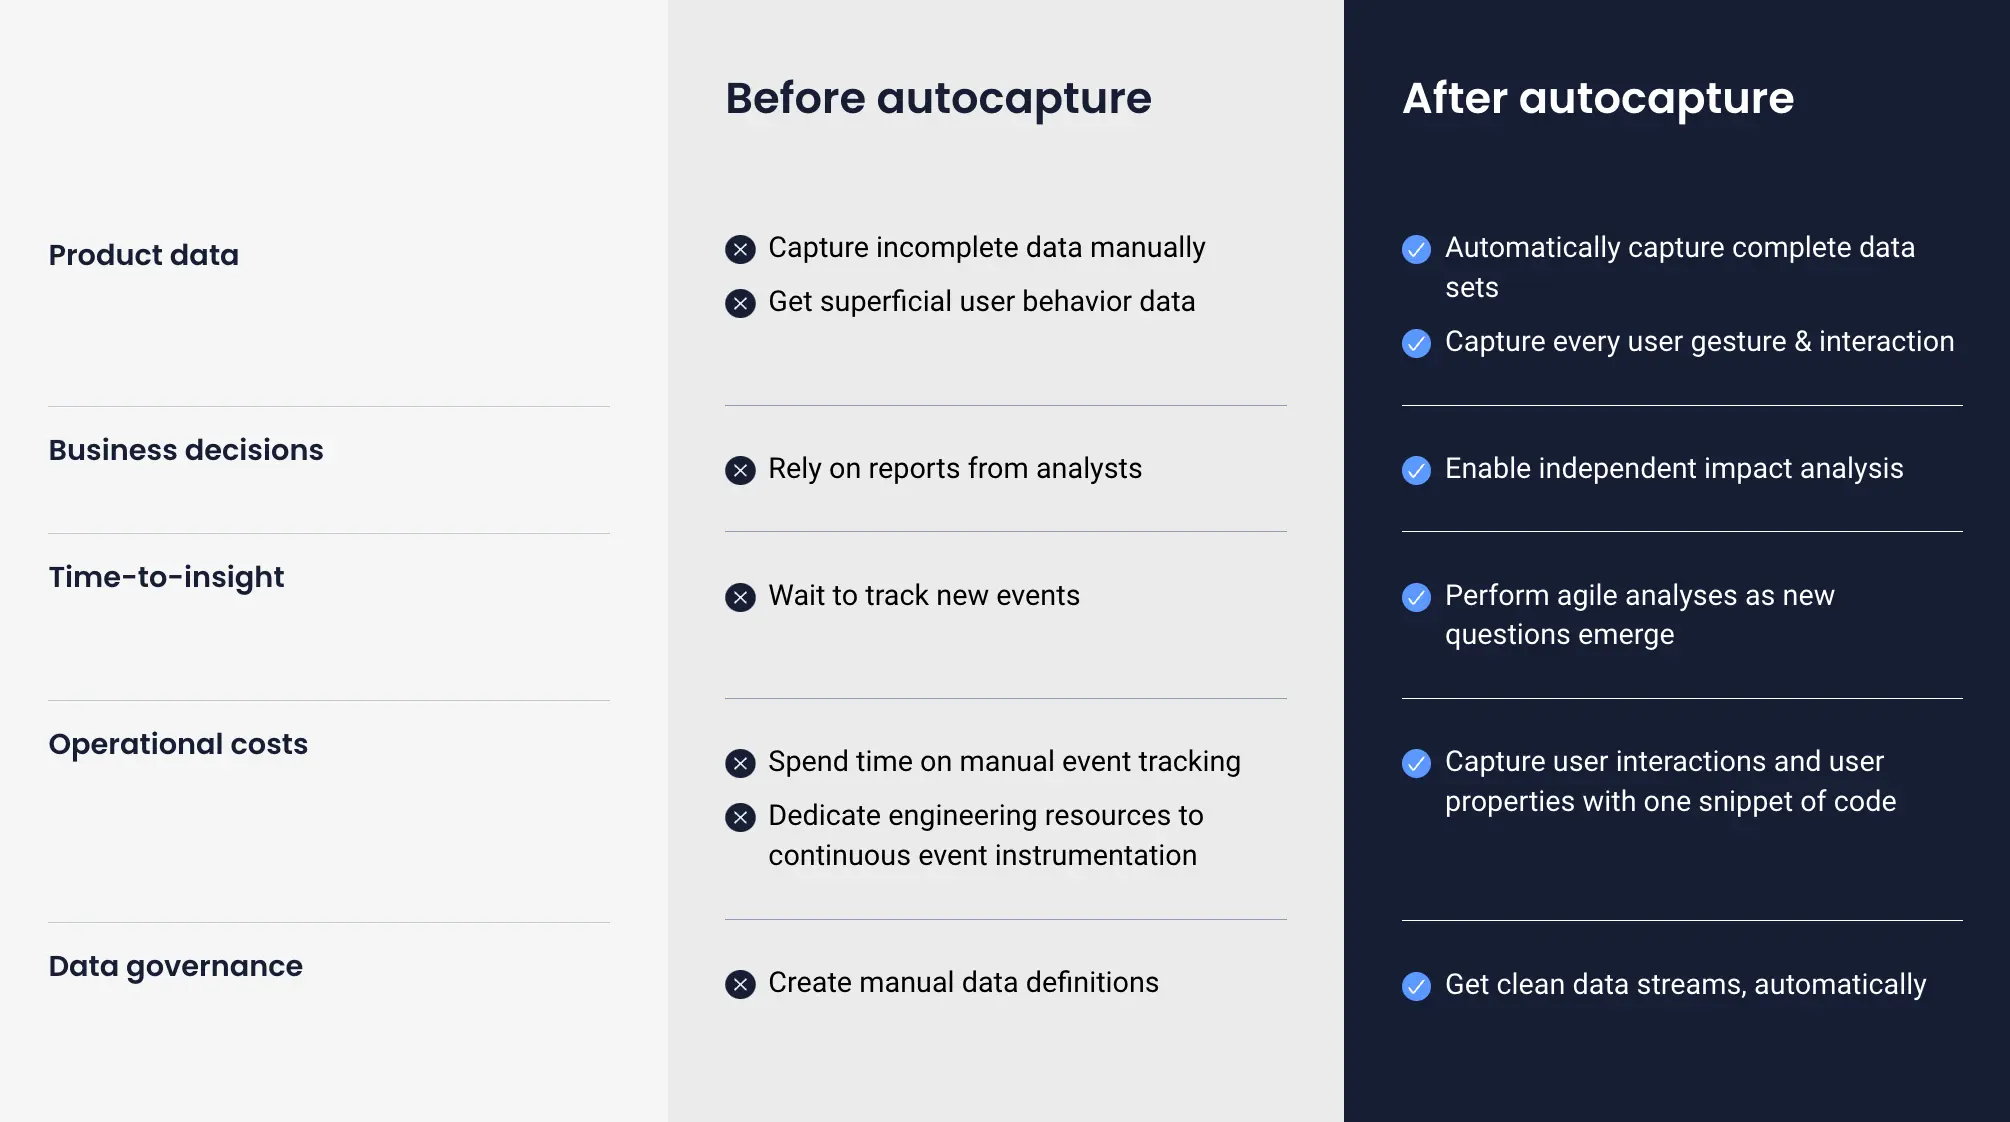
Because of our autocapture technology, you don’t need to set up every single thing you want to track—insights just start showing up right away. You’ll also get access to ready-made filters and report templates, so there’s no need to build complex dashboards from scratch. And if you're working with a team, it’s easy to share dashboards with others so everyone—product, design, and engineering—is on the same page.
Flexible, but not overwhelming
Even though UXCam is simple to use, it still gives you the flexibility to go deeper when you need to. It covers most of the common product analytics use cases right out of the box, but you can also set up custom events and filters to answer more specific questions.
Get insights in a few click
One of the most powerful advantages is how quickly UXCam gets you to insight. With just a few clicks, you can segment sessions based on user behavior, generate dashboards from a specific cohort, or jump directly into sessions tied to key events. You’ll even uncover patterns and friction points you might not have thought to track—surfacing insights that traditional, manual analytics setups often miss.
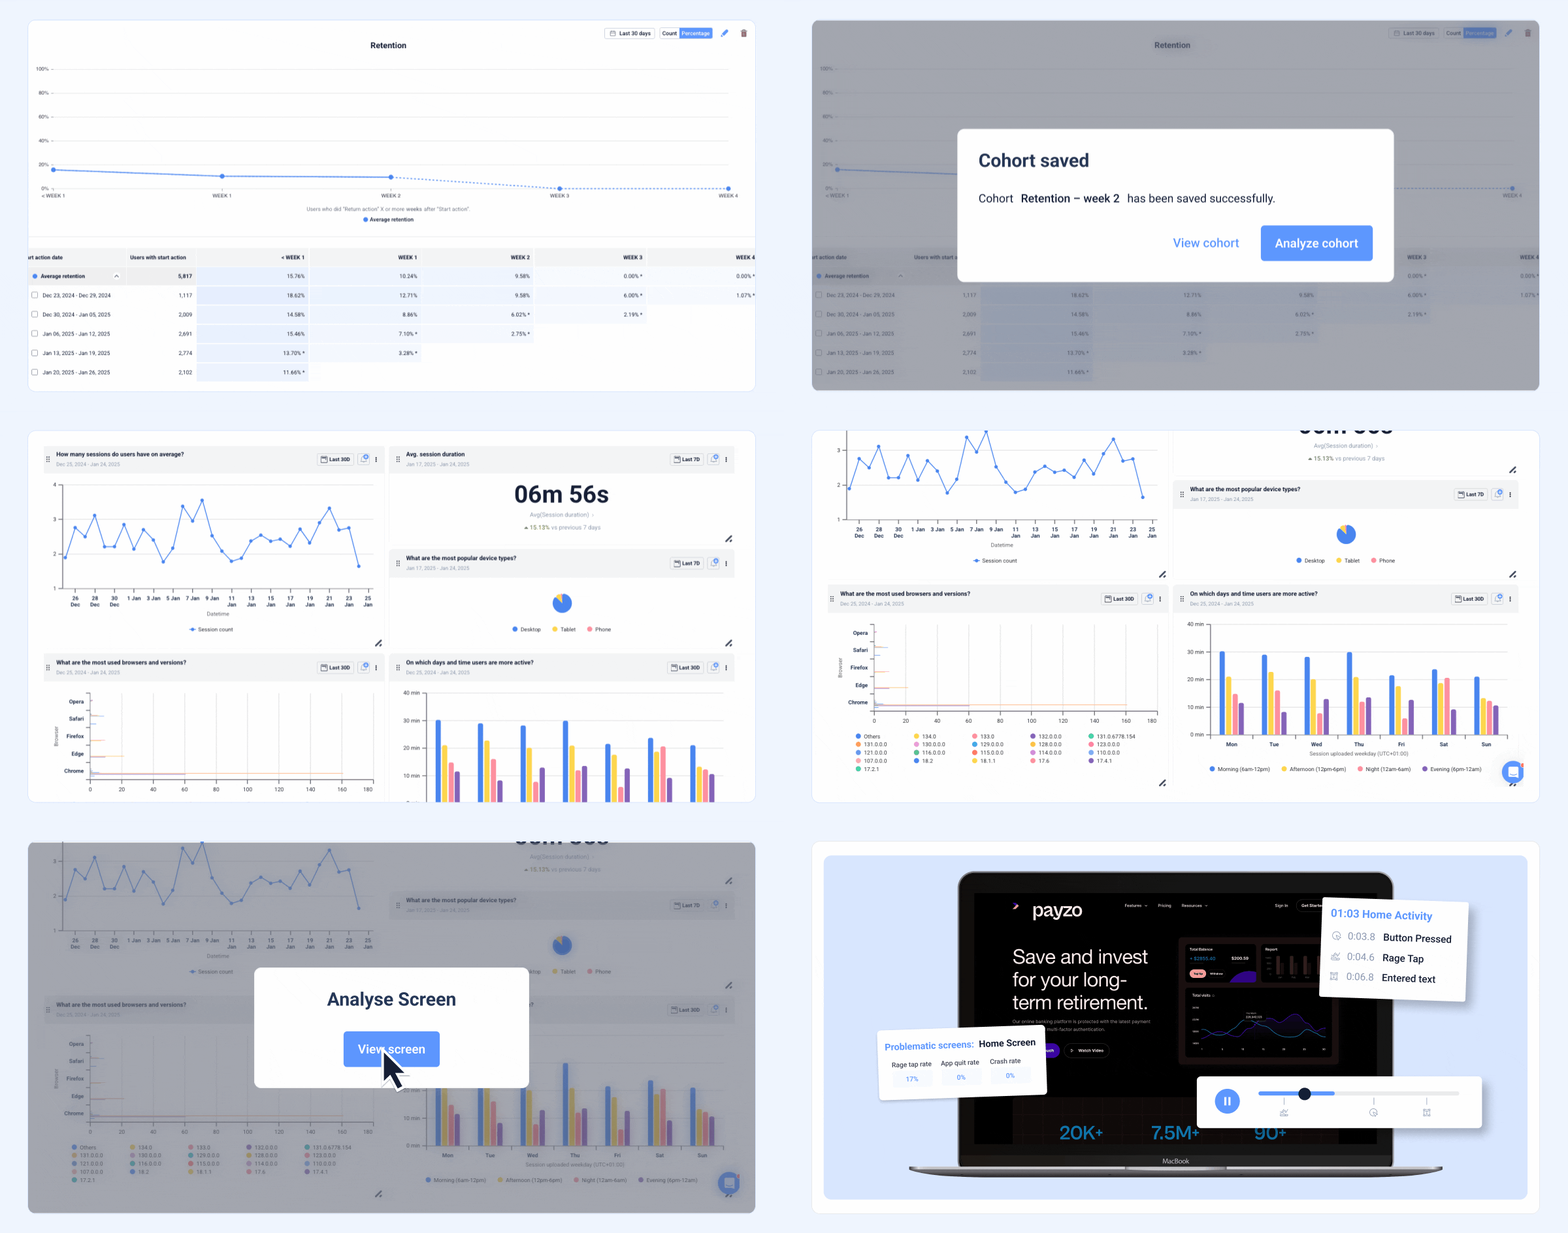
Ready to level up your website’s user experience? Sign up for free to start using UXCam to capture rich behavioral insights, fix friction points, and increase your conversion rates.
Marketing performance dashboard
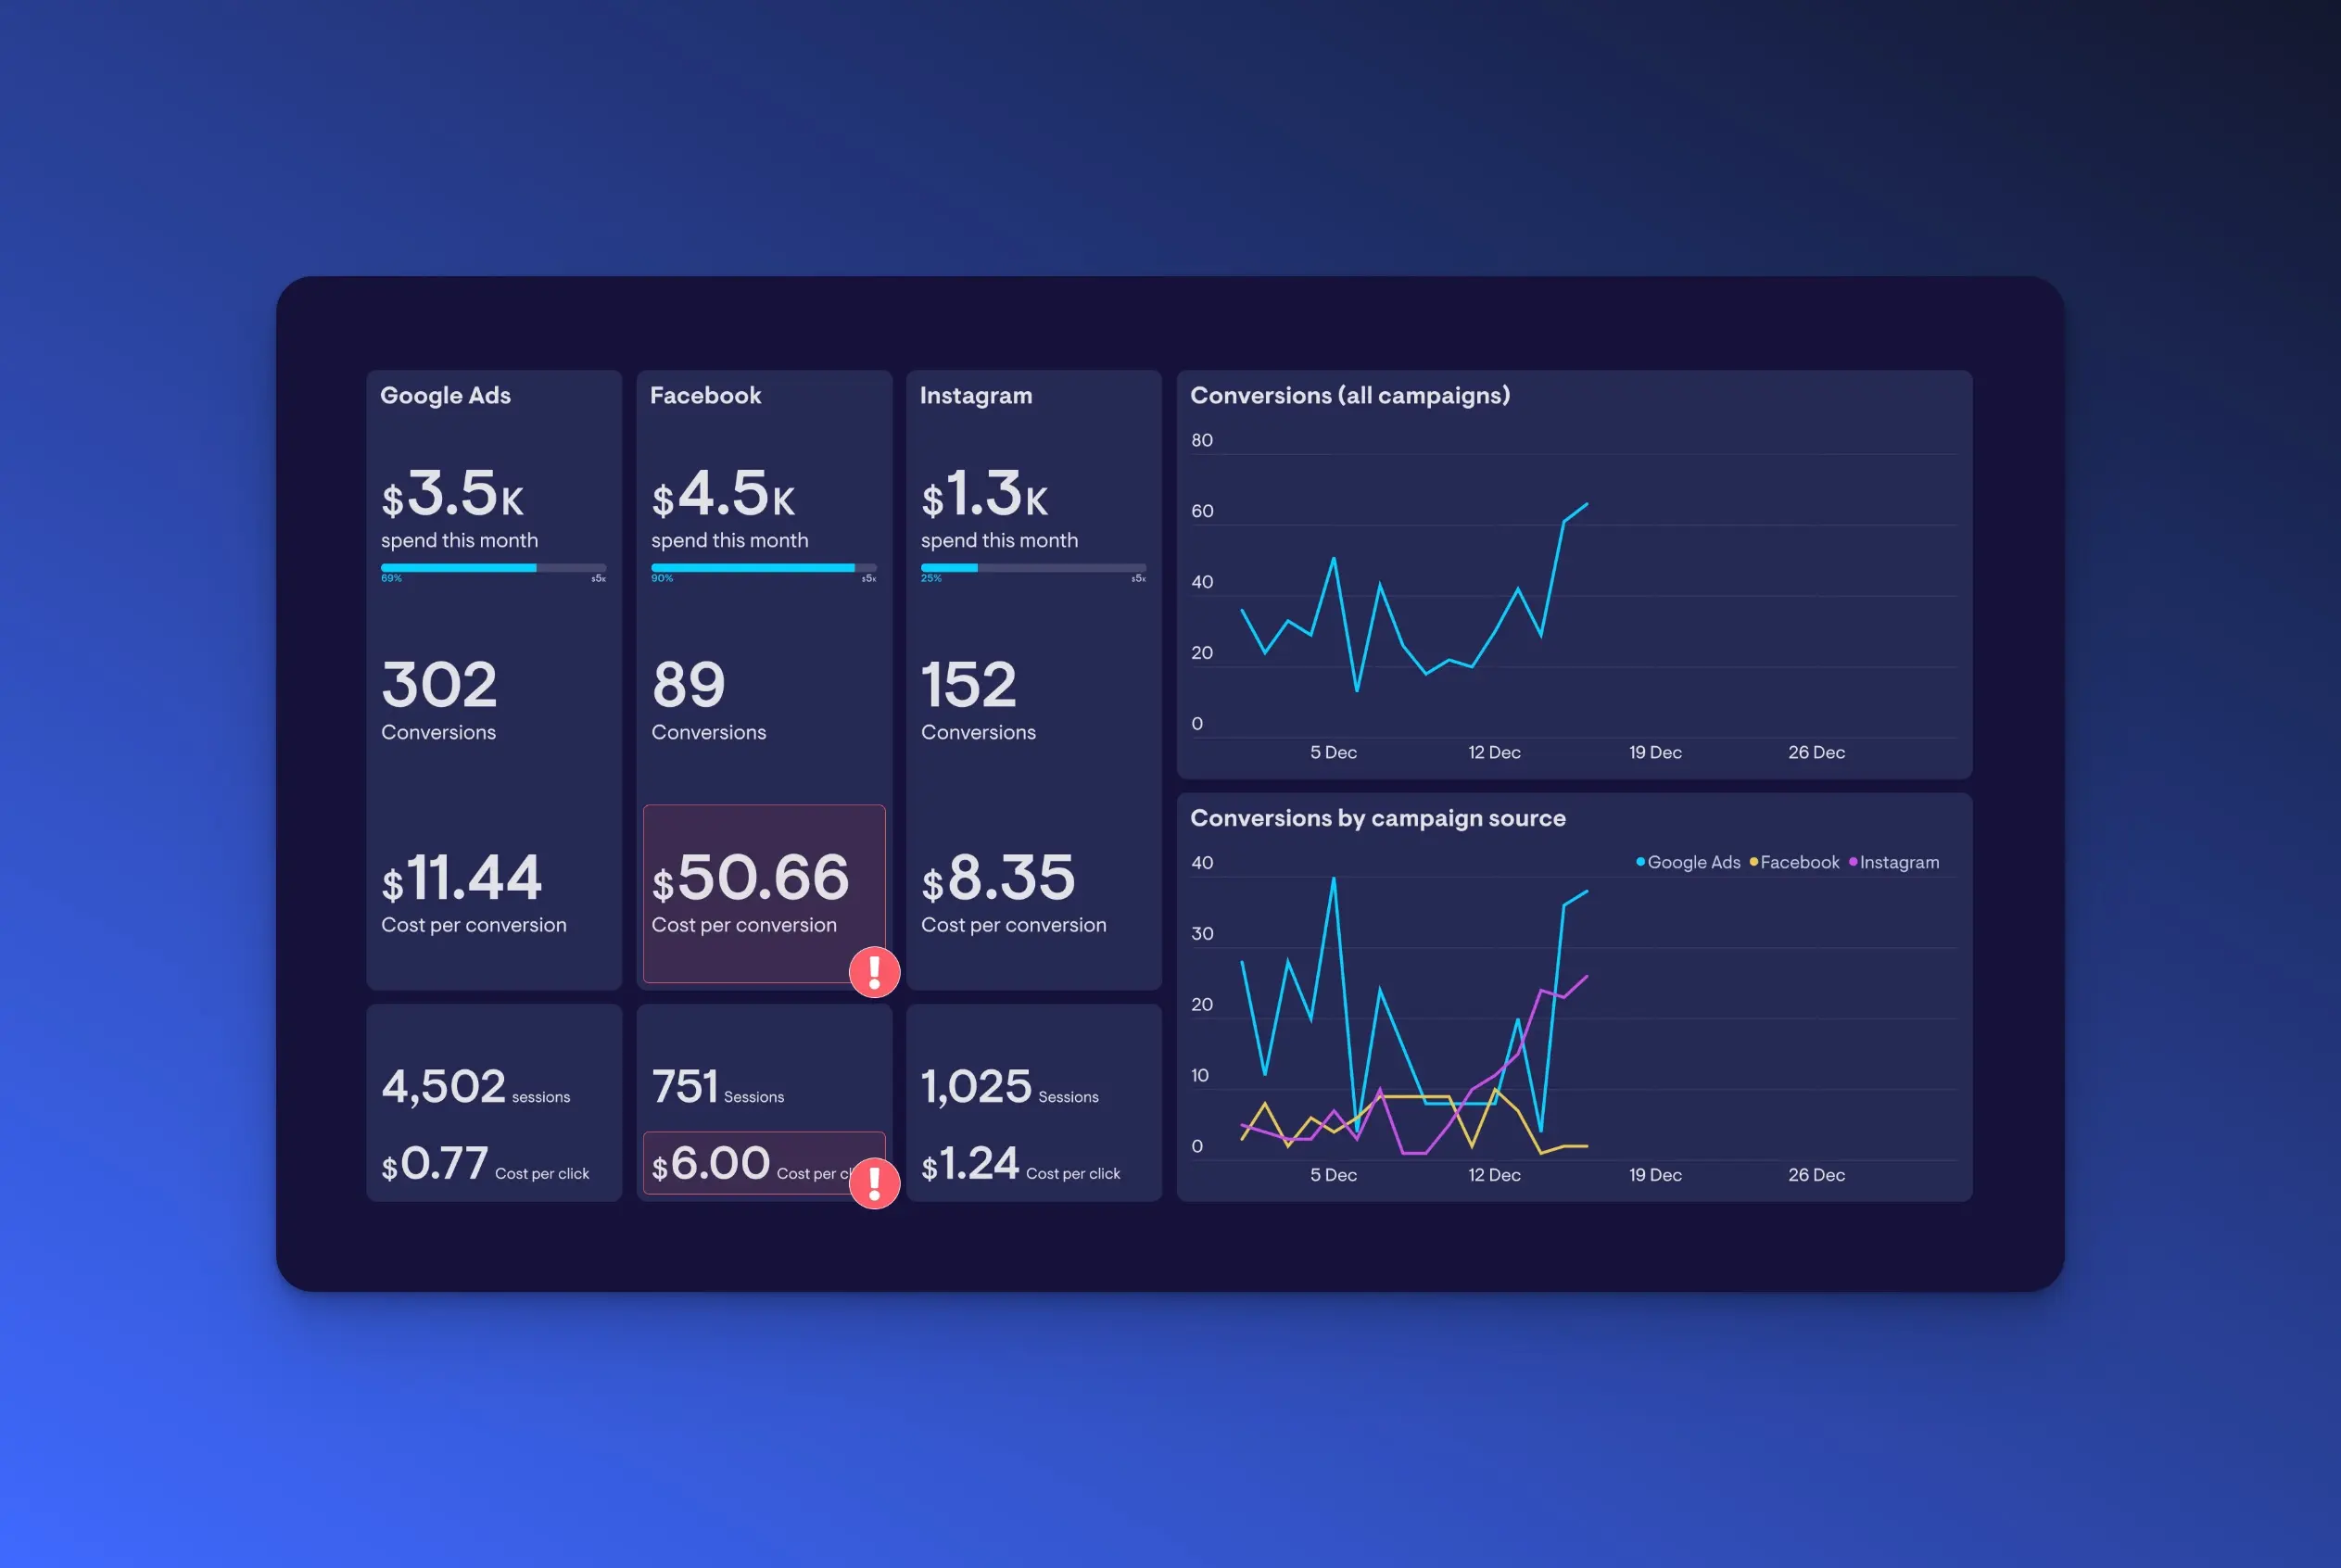
You use a marketing performance dashboard to track and optimize your campaigns across various channels. It helps you identify which strategies are working and where to invest your resources.
Key metrics:
Website Traffic Sources: See where your visitors are coming from—organic search, paid ads, social media, or referrals.
Conversion Rates by Channel: Understand how effectively each channel turns visitors into customers.
Cost per Acquisition (CPA): Measure how much you're spending to acquire a new customer.
Return on Investment (ROI) for Campaigns: Assess the profitability of your marketing efforts.
Click-Through Rates (CTR) for Ads: Determine how engaging your ads are to your target audience.
Social Media Engagement Metrics: Track likes, shares, comments, and other interactions on social platforms.
Recommended tools
Google Analytics: Provides insights into your website traffic and user behavior.
Google Ads: Offers data on your paid advertising campaigns.
Facebook Insights: Gives analytics on your social media engagement.
Geckoboard: Helps you create interactive data visualizations.
E-commerce dashboard
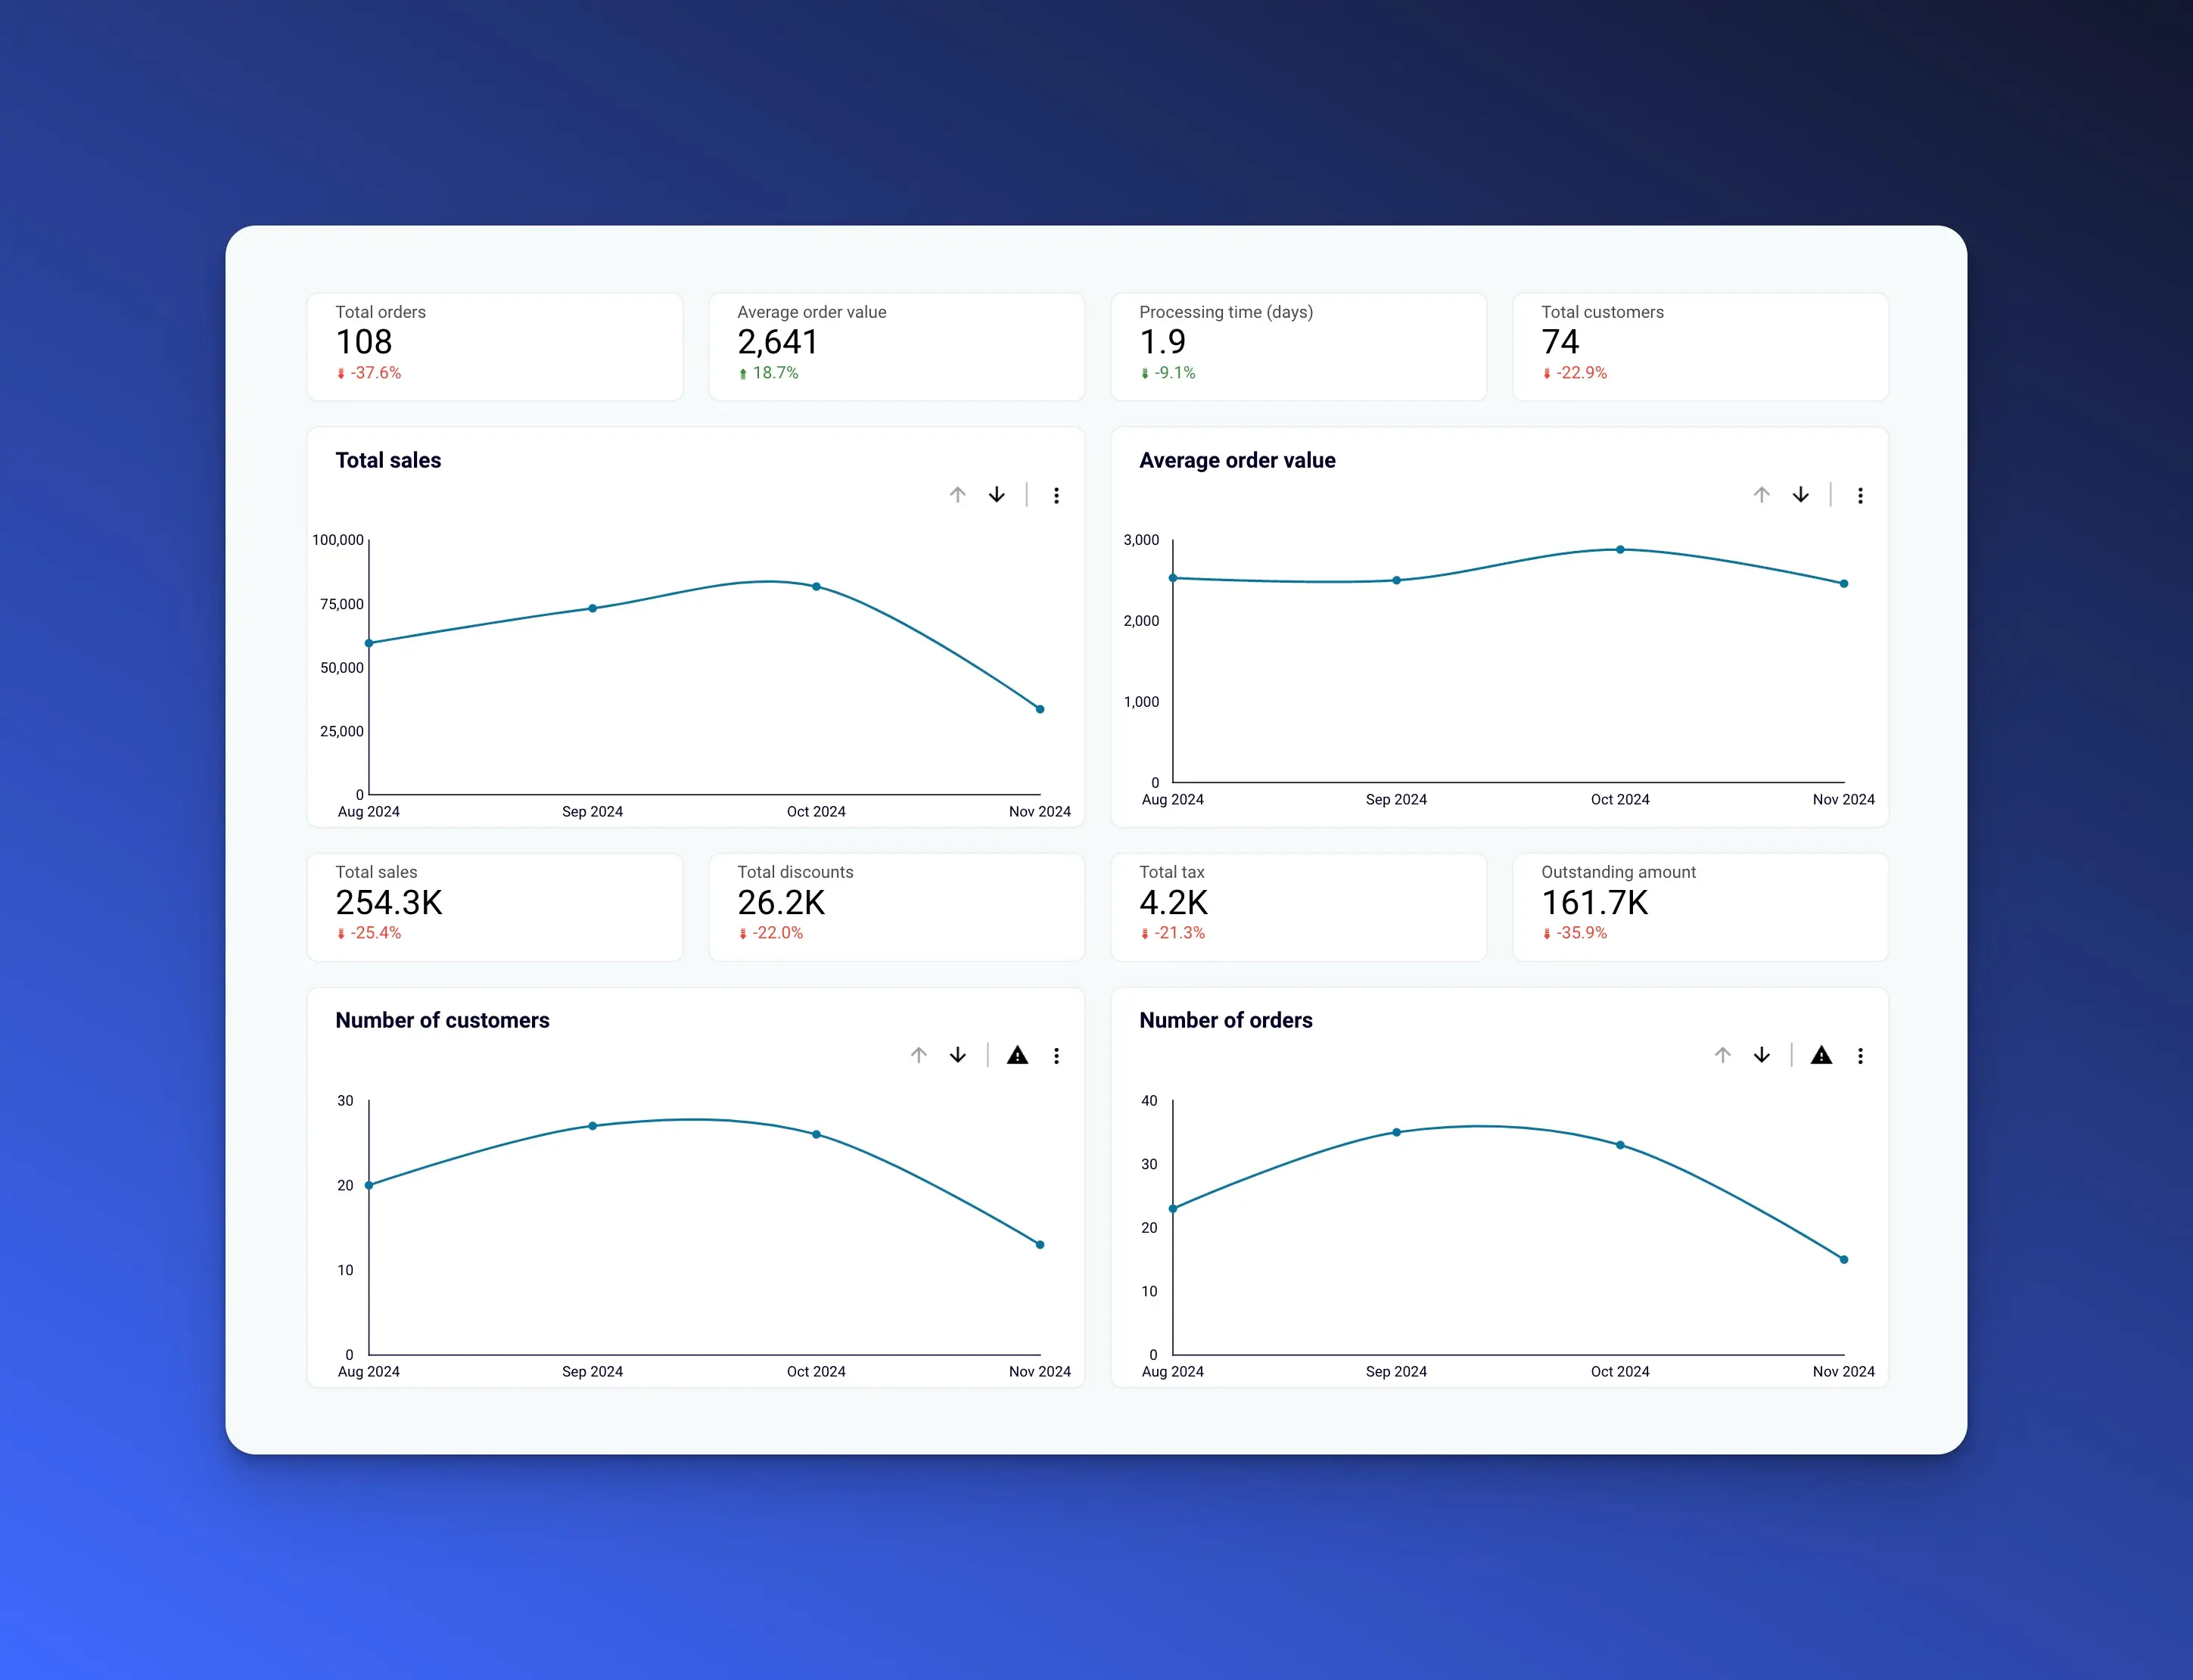
An e-commerce dashboard helps you monitor sales performance, customer behavior, and inventory management. It's essential for identifying growth opportunities and potential issues.
Key Metrics:
Total Sales and Revenue: Track your overall financial performance.
Average Order Value (AOV): Understand how much customers spend on average.
Shopping Cart Abandonment Rate: Identify how often customers leave without completing a purchase.
Top Selling Products: See which items drive the most sales.
Customer Lifetime Value (CLV): Estimate the total revenue you can expect from a single customer over time.
Inventory Levels: Monitor stock to prevent shortages.
Recommended tools
Shopify Analytics: If you use Shopify, this provides valuable sales and customer data.
Coupler.io: Offers connectors to Looker studio to provide insights into the sales pipeline.
Microsoft Power BI: Allows for advanced data visualization and reporting.
SEO dashboard
An SEO dashboard helps you monitor and improve your search engine optimization efforts. It provides insights into how your site performs in organic search results.
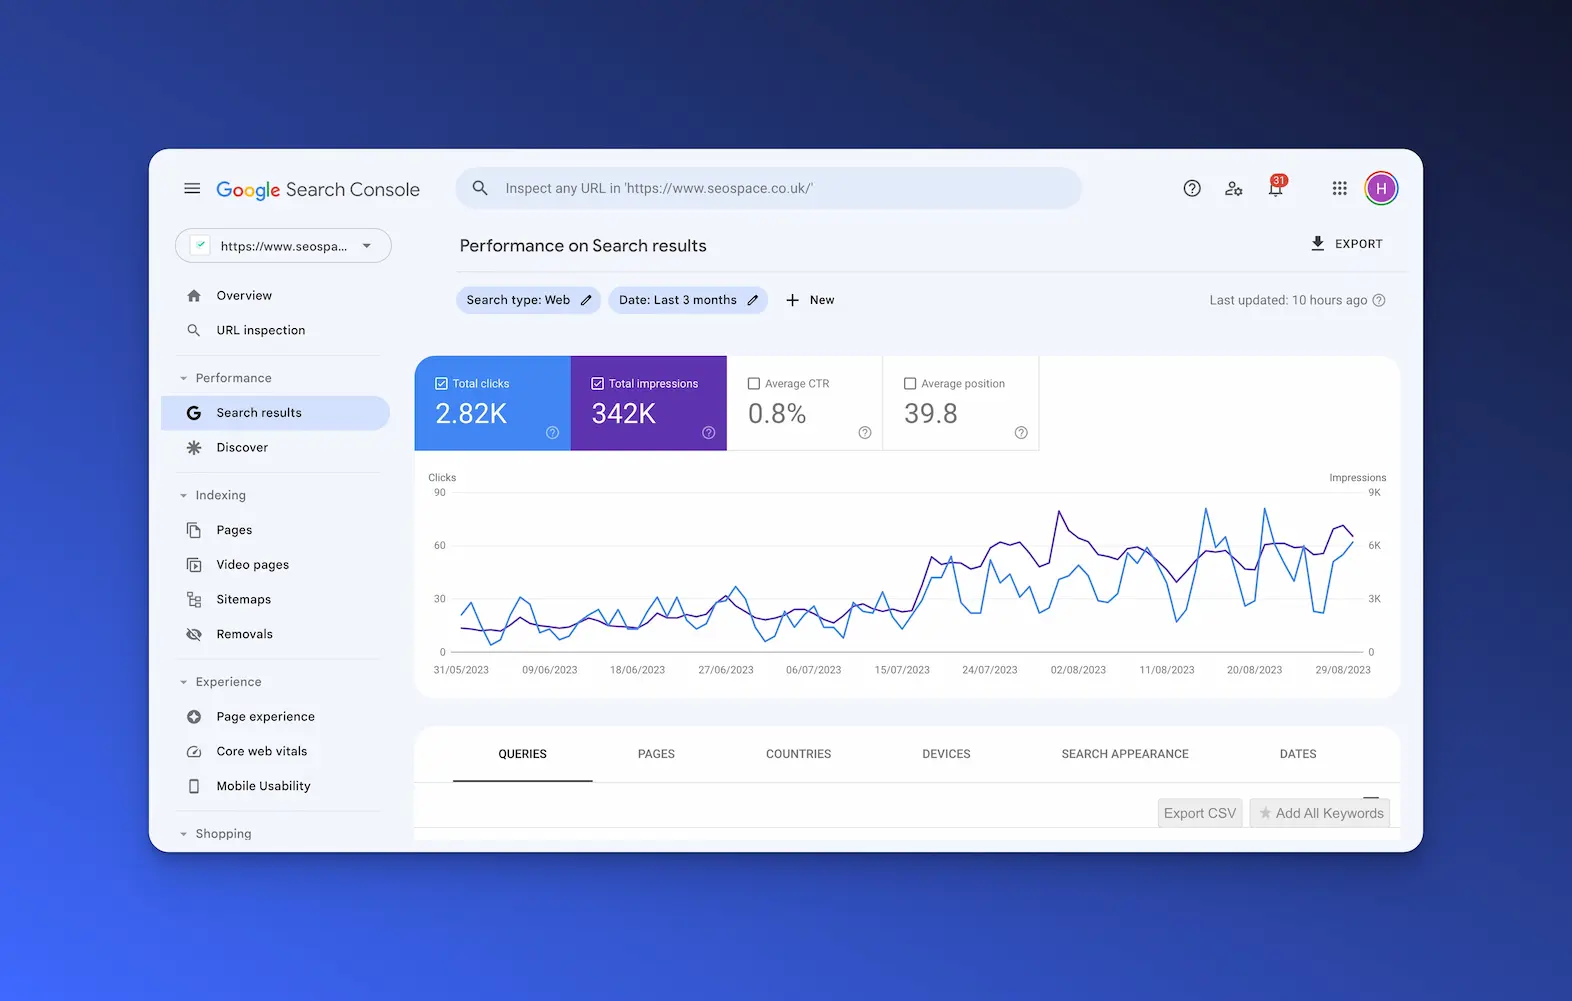
Key Metrics:
Organic Traffic Volume: See how many visitors find your site through search engines.
Keyword Rankings: Track your position for important search terms.
Backlink Quality and Quantity: Assess the number and quality of sites linking to you.
On-Page SEO Metrics: Monitor page load speed, mobile responsiveness, and other factors that affect rankings.
Click-Through Rates (CTR) from SERPs: Measure how often users click your site in search results.
Bounce Rate for Organic Visitors: Determine if your content meets visitors' expectations.
Recommended tools:
Google Search Console: Provides data on search performance and site health.
SEMrush: Offers comprehensive SEO analytics and competitor insights.
Ahrefs: Helps with keyword research and backlink tracking.
Executive dashboard
An executive dashboard provides high-level insights for senior management, focusing on overall performance and strategic goals.
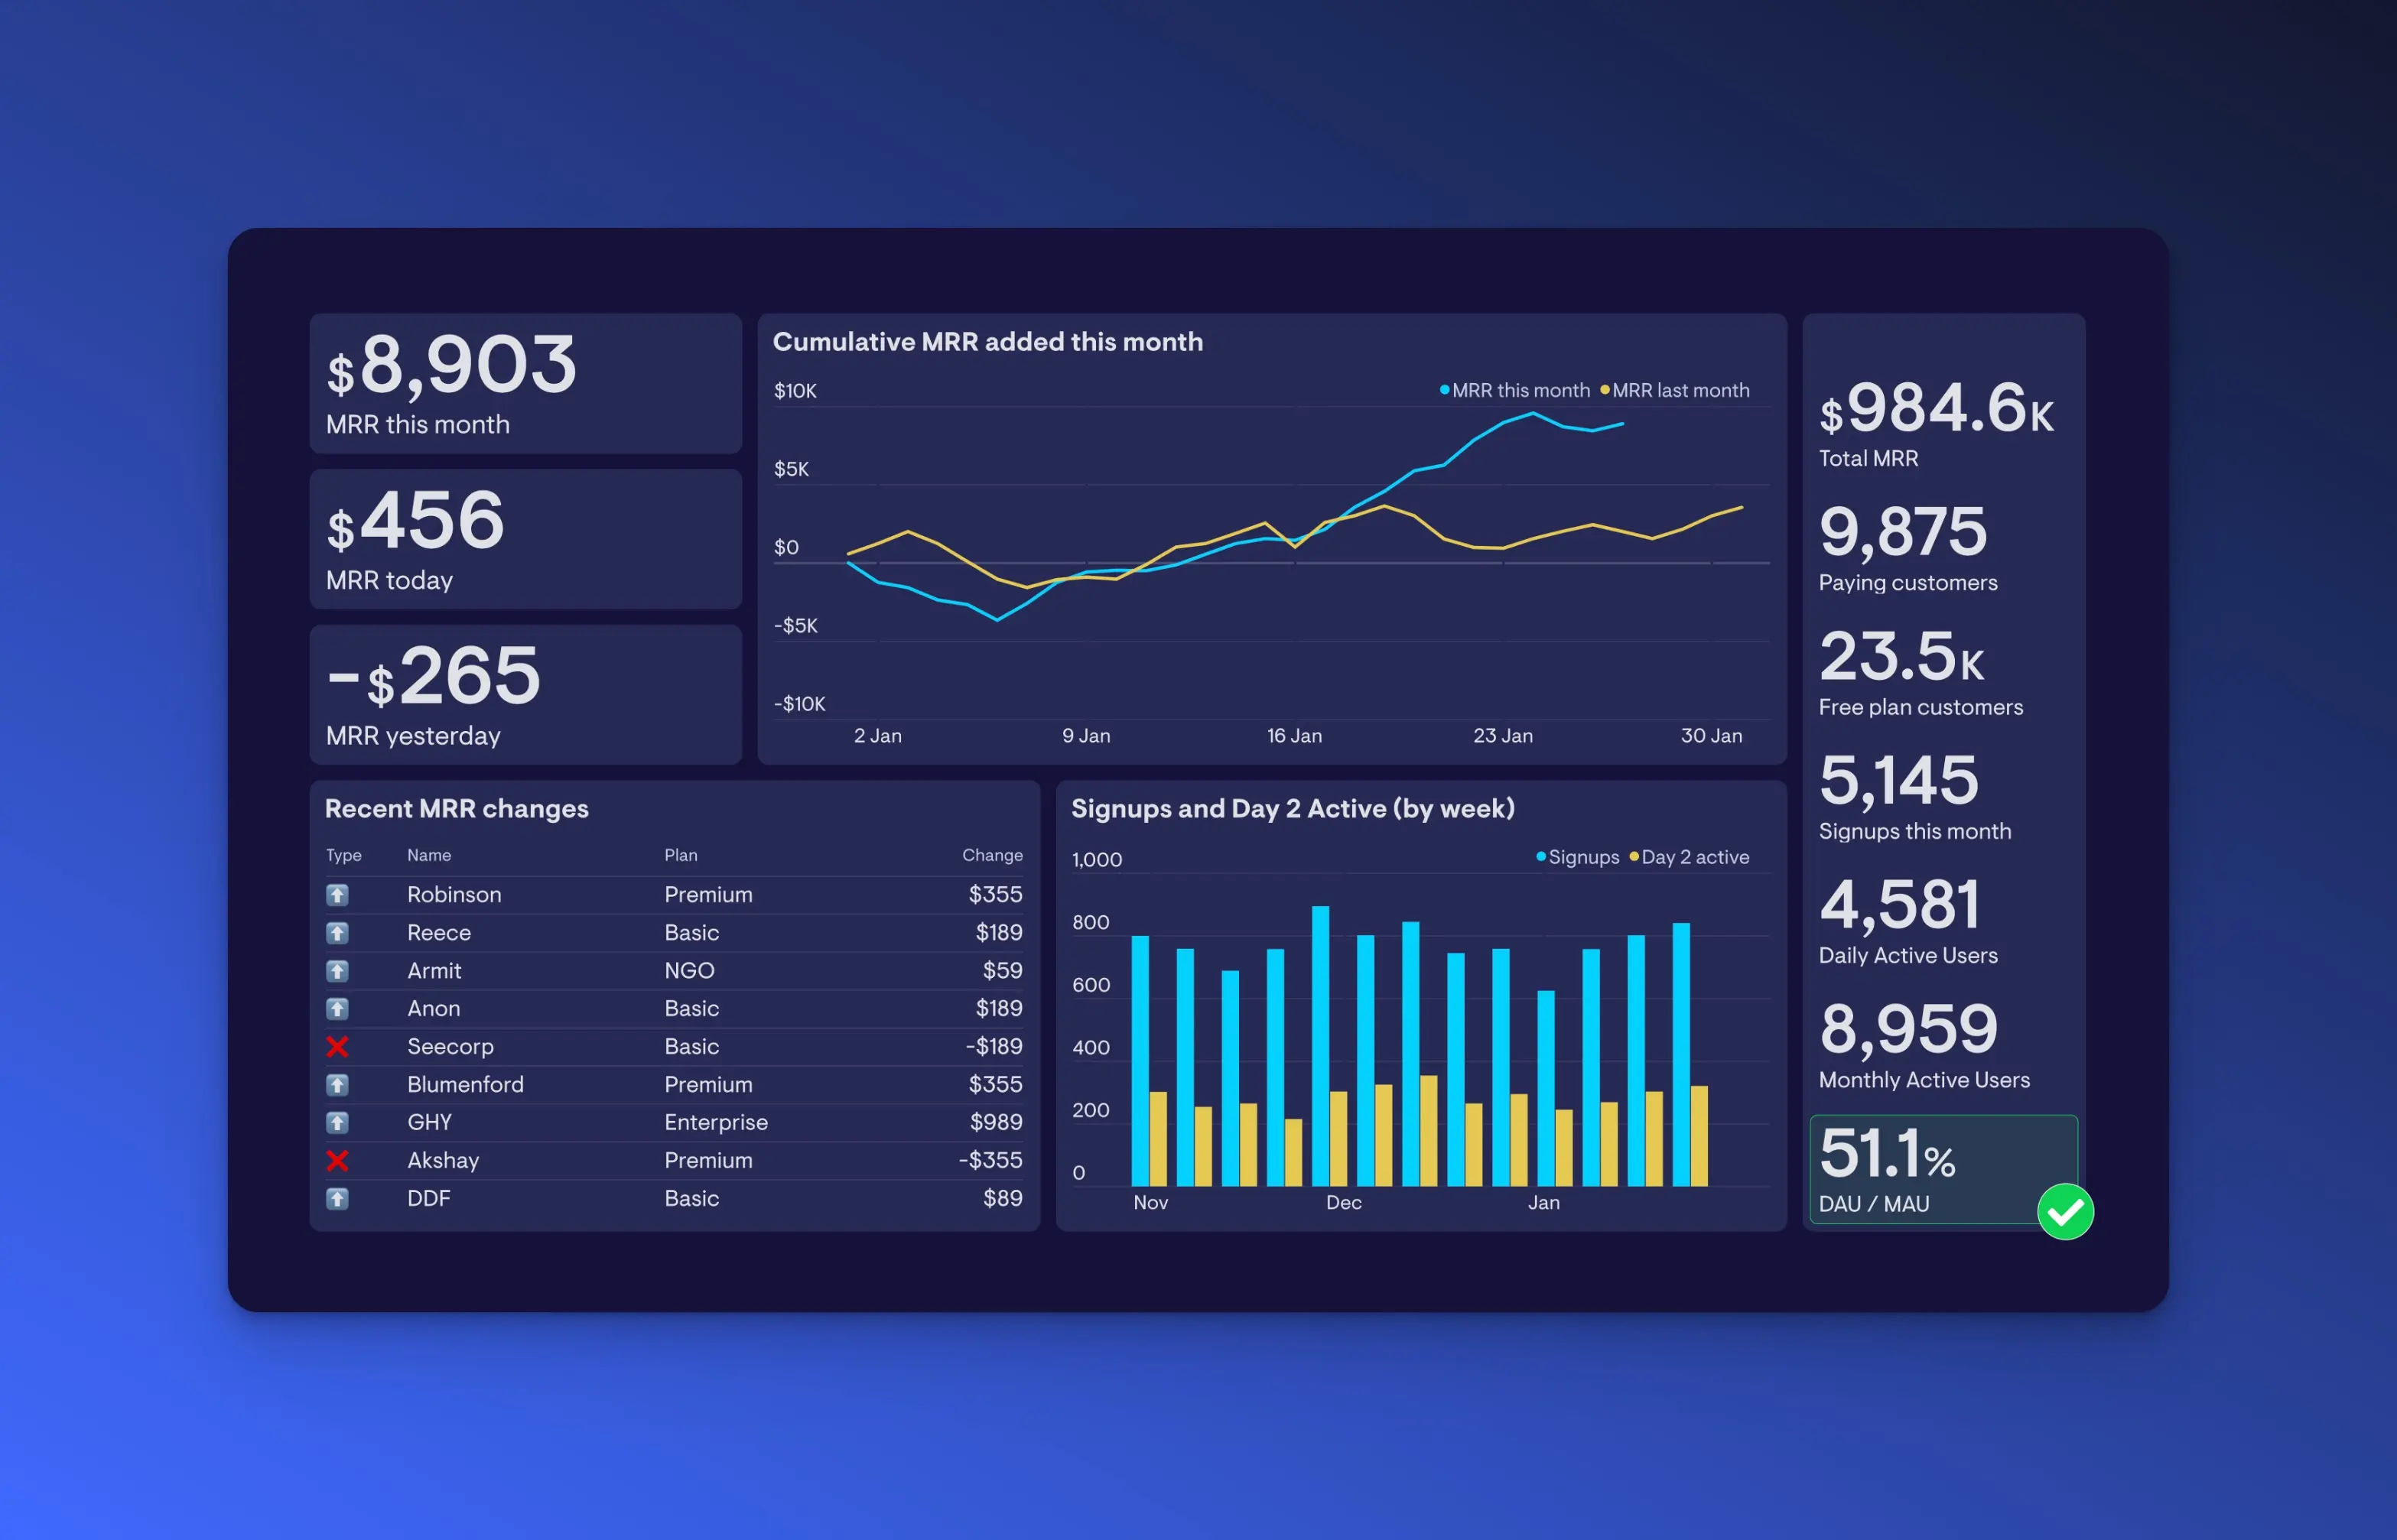
Key Metrics:
Overall Website Performance: Get a snapshot of traffic, conversions, and revenue.
KPIs Aligned with Business Goals: Monitor metrics that directly impact your objectives.
Financial Metrics: Track revenue, profit margins, and growth.
Customer Acquisition and Retention Rates: Understand how well you're attracting and keeping customers.
High-Level Marketing Performance: See the effectiveness of marketing efforts at a glance.
Tools Used:
Microsoft Power BI: Excellent for creating interactive, shareable dashboards.
Geckoboard: Offers powerful data visualization tools.
Google Looker Studio: Integrates well with Google products for seamless data flow.
Website metrics dashboard (Content performance)
A content performance dashboard helps you evaluate how effective your website content is in engaging users and driving conversions.
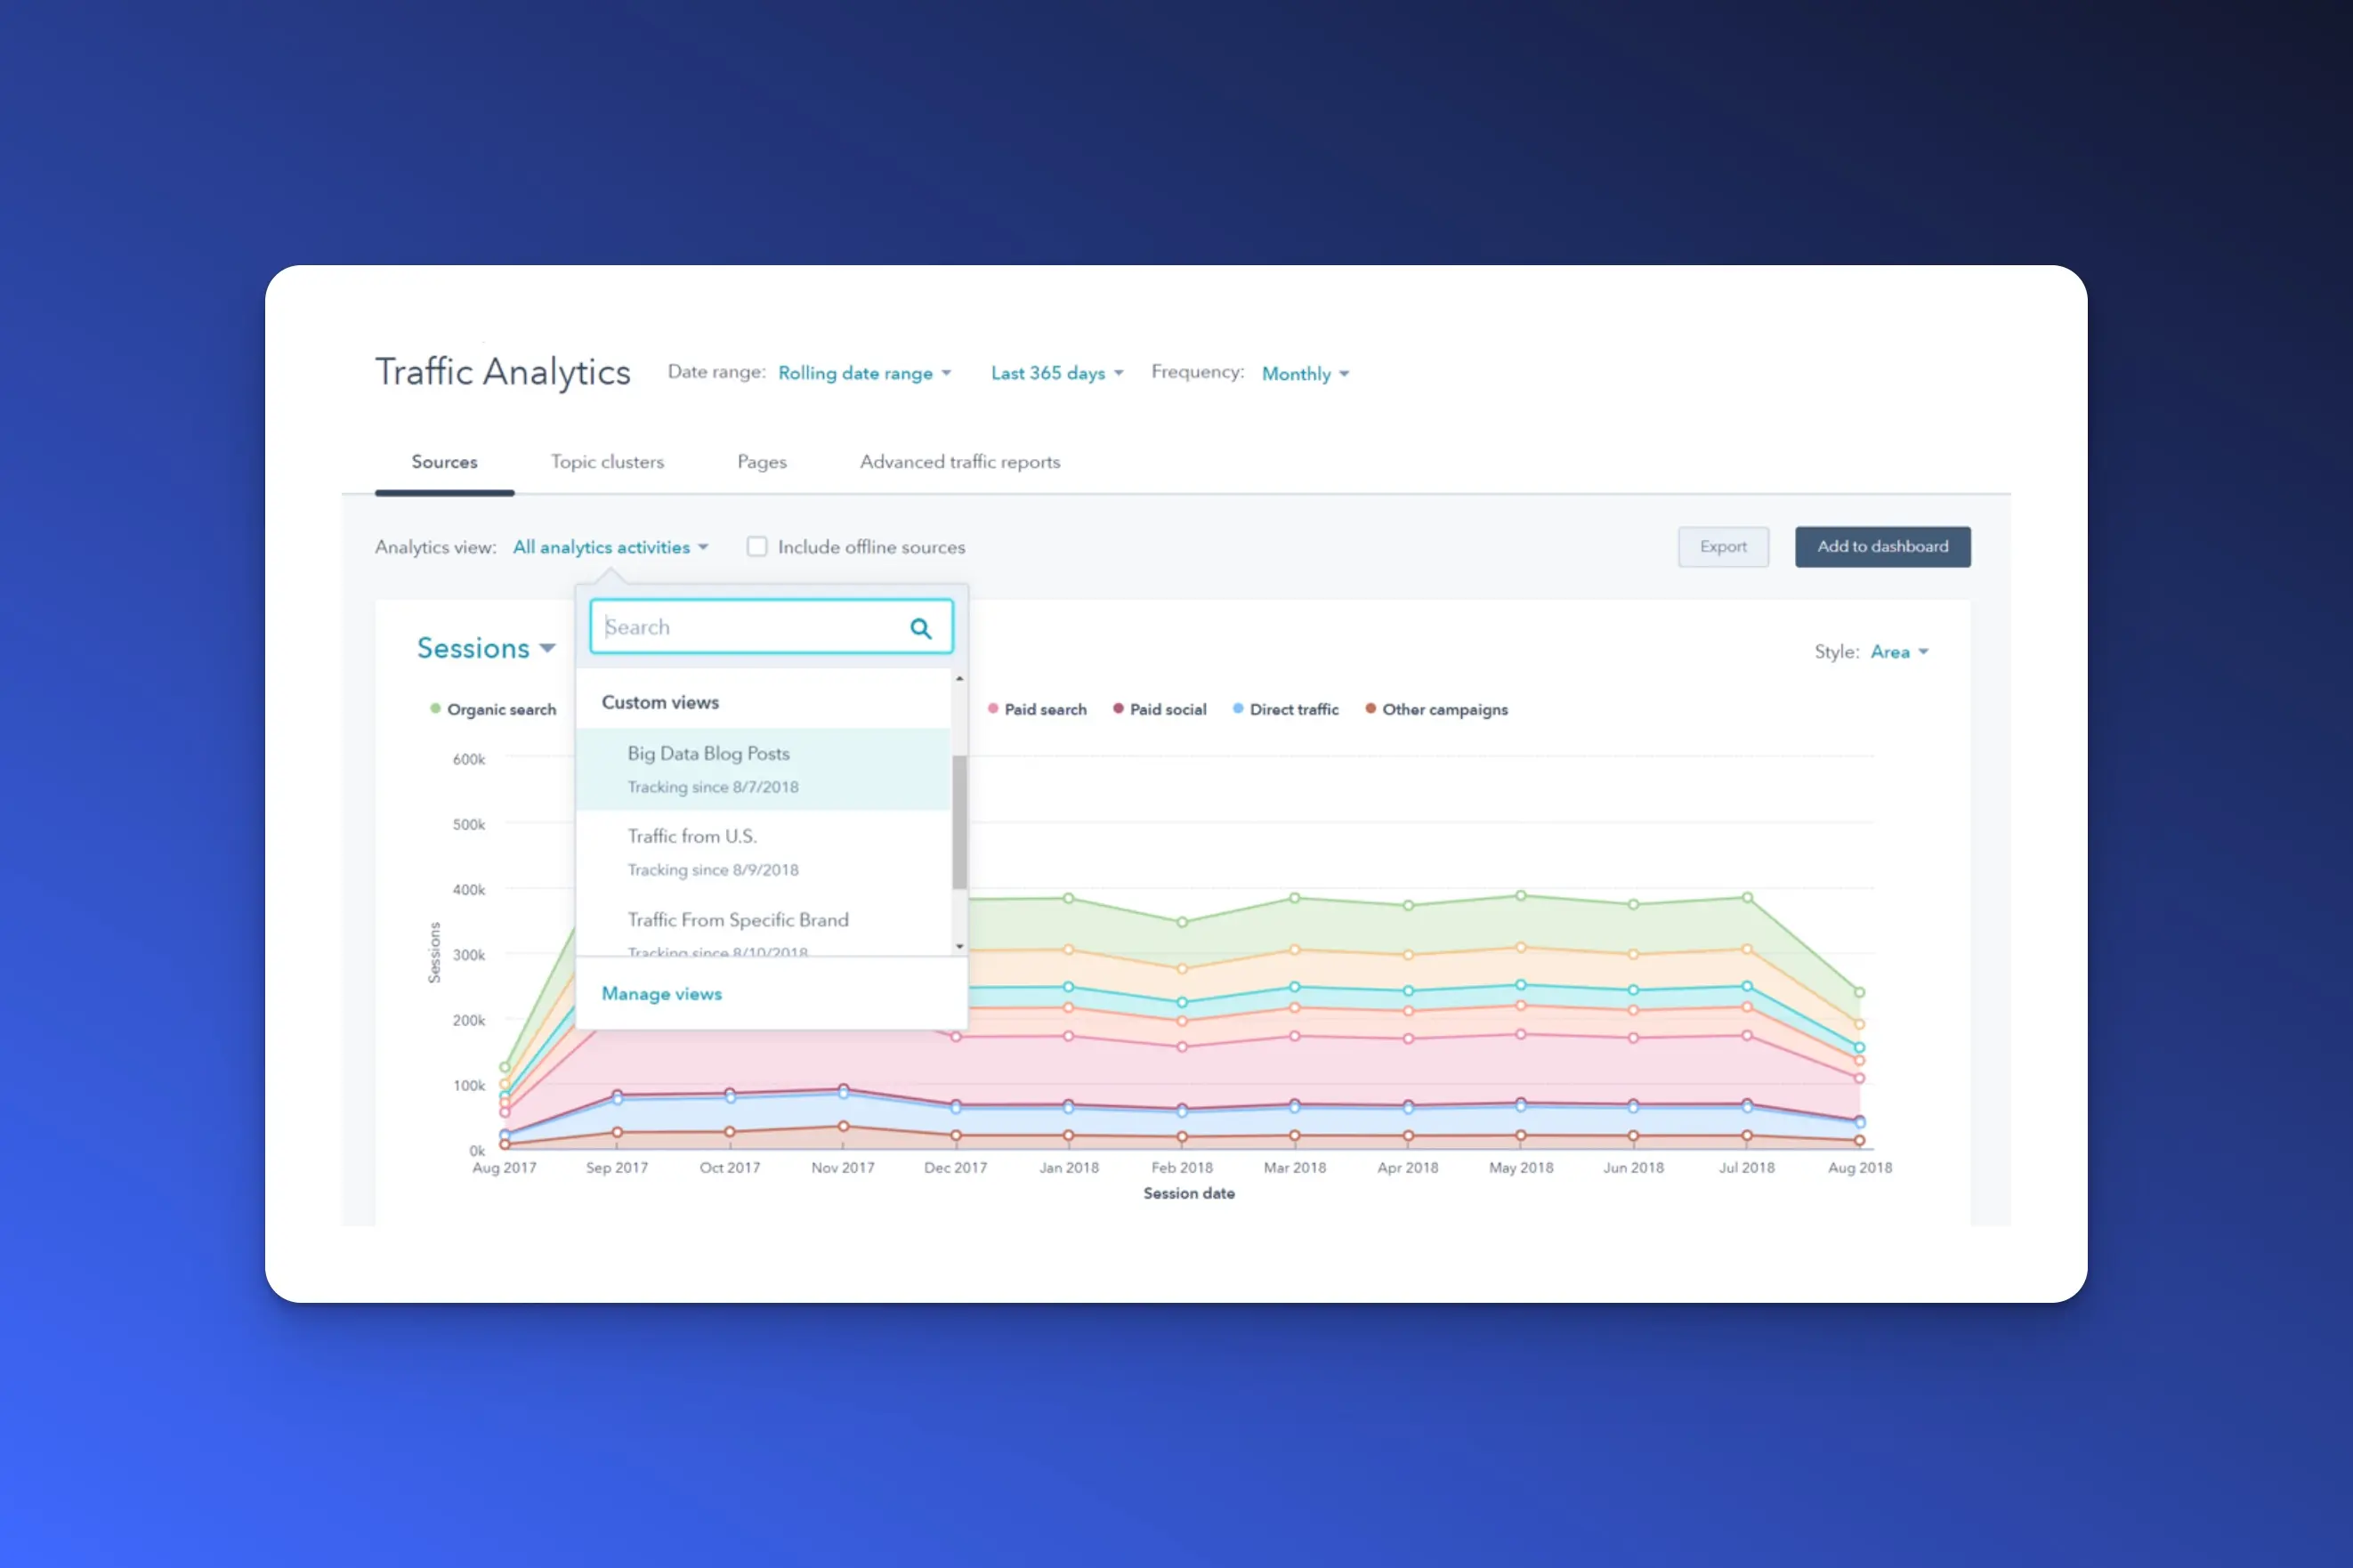
Key Metrics:
Page Views and Unique Visitors: Measure the popularity of each content piece.
Average Time Spent on Content: See how engaging your content is.
Social Shares and Engagement: Track how often content is shared or commented on.
Conversion Rates from Content Pages: Determine how well content leads to desired actions.
Bounce Rate for Content Pages: Identify content that doesn't meet user expectations.
SEO Performance of Content: Monitor how content ranks in search results.
Recommended tools:
Google Analytics: Provides detailed insights into content performance.
Hubspot marketing analytics: A CMS like Hubspot may offer additional data.
Tableau: Helps visualize content data effectively.
Best practices for using web analytics dashboards
Designing an effective web analytics dashboard is more than just displaying data—it's about creating a tool that provides valuable insights and drives informed decisions. By thoughtfully crafting your dashboard, you ensure it meets the needs of all users. Here are some best practices, enriched with expert advice, to guide you through the process.
1. Define clear objectives
Begin by involving stakeholders early in the planning phase. Engage the people who will use the dashboard to understand their needs and expectations. Their insights help tailor the dashboard to meet actual requirements.
Clearly define what you want your dashboard to achieve. Are you tracking marketing performance, monitoring site health, or enhancing user experience? Identifying your primary goals guides every decision you make in the dashboard's design.
Start simple and expand. Begin with a minimal set of essential metrics that align with your objectives. As you refine your goals, you can add more complexity without overwhelming users.
2. Choose the right analytics tool
Selecting the appropriate tool is crucial for building a dashboard that meets your requirements. Consider factors like ease of use, customization options, integration capabilities, and cost. The right tool will align with your objectives and technical expertise.
Automate where possible. Use tools that support automated data updates and reporting to ensure consistency and save time. This reduces the risk of human error in data handling.
Ensure security and compliance. Protect sensitive data by implementing robust security measures. Compliance with data protection regulations is not just best practice—it's a necessity.
3. Select relevant metrics
Choose key performance indicators (KPIs) that directly align with your objectives. Focus on actionable data rather than vanity metrics to avoid overwhelming yourself with unnecessary information.
Provide training and support. Offer guidance on how to interpret the metrics effectively. Even the best-designed dashboard requires users to understand the data presented.
4. Prioritize data visualization
Use appropriate visualizations to represent your data clearly. Line charts are excellent for showing trends over time, while pie charts effectively display composition percentages. The right visualization makes complex data easier to understand at a glance.
Monitor performance metrics of the dashboard itself. Keep an eye on how it performs technically. Slow load times or glitches can deter users from engaging with it.
5. Ensure accessibility and usability
Design your dashboard to be user-friendly and accessible across different devices. Implement responsive design so it functions well on desktops, tablets, and smartphones.
An intuitive layout helps users navigate the dashboard effortlessly. When users can easily find and interpret the data they need, they're more likely to use the dashboard regularly.
6. Implement data governance
Maintain data accuracy and consistency by establishing clear protocols for data collection, processing, and reporting. Data governance ensures that everyone is working with the same definitions and methodologies.
Ensure security and compliance. Protect sensitive data by implementing robust security measures. Compliance with data protection regulations builds trust and avoids legal issues.
7. Foster continuous improvement
Regularly review and update your dashboard to reflect changing business needs. Solicit feedback from users to identify areas for enhancement.
Provide training and support as the dashboard evolves. Offer guidance on new features to help users get the most out of the tool.
Conclusion
Web analytics dashboards are indispensable tools for monitoring, analyzing, and enhancing your website's performance. They provide you with real-time insights that enable you to make informed decisions and stay ahead of the competition.
Among the available tools, UXCam Web Dashboards stand out by offering specialized, user-centric insights. They go beyond mere metric tracking to provide actionable data that can significantly improve user experience and conversion rates.
By investing in a robust web analytics dashboard, particularly one that integrates the comprehensive features of UXCam, you can achieve substantial gains. You'll enhance user satisfaction, which often leads to better retention and increased revenue.
In today's competitive digital landscape, staying ahead means making data-driven decisions. A well-designed web analytics dashboard empowers you to transform raw data into meaningful information that guides your strategies.
Remember, the goal isn't just to collect data but to understand it and act upon it. By harnessing the power of web analytics dashboards, you're positioning your business for long-term success.
FAQs
What is a web analytics dashboard?
A web analytics dashboard is a visual representation of your website's crucial data points. It consolidates information like traffic, user behavior, and conversion rates into charts, graphs, and tables.
Why is a web analytics dashboard important?
Because it allows you to monitor and analyze your website's performance in real-time. With these insights, you can make informed decisions and strategic plans to improve your online presence. By understanding your users' needs and implementing best practices, you can leverage these dashboards to drive strategic decisions and achieve your business goals. They help you pinpoint areas of success and identify opportunities for improvement.Key benefits of using web analytics dashboards include:
Improved User Experience: Gain insights into how users interact with your site to enhance usability.
Increased Conversion Rates: Identify and address barriers in the user journey to boost conversions.
Data-Driven Decision Making: Base your strategies on concrete data rather than assumptions.
Real-Time Monitoring: Respond quickly to trends and issues as they arise.
What are some common examples of web analytics?
Web analytics dashboards are versatile tools that adapt to your specific needs and objectives. Whether you're aiming to monitor performance, optimize marketing efforts, or enhance user experience, there's a use case for you. Understanding these common applications will help you leverage your dashboard to its fullest potential.Let's explore into the most frequent ways people use web analytics dashboards to drive their websites forward.
Performance monitoring
You need to know how your website is performing to make improvements. Dashboards help you track:
Website traffic: See how many visitors are coming to your site and where they're coming from.
User behavior: Understand how users navigate your site, which pages they visit, and how long they stay.
Conversion rates: Monitor the percentage of visitors who complete desired actions, such as making a purchase or signing up for a newsletter.
Key performance indicators (KPIs): Keep an eye on the metrics that matter most to your business objectives.
By regularly monitoring these metrics, you can identify trends, spot issues early, and make data-driven decisions to enhance your website's performance.
Marketing optimization
Want to get the most out of your marketing efforts? Your dashboard can help by:
Assessing campaign effectiveness: Determine which marketing campaigns are driving the most traffic and conversions.
Evaluating SEO strategies: Track your search engine rankings and organic traffic to see if your SEO efforts are paying off.
Analyzing content performance: Find out which blog posts, videos, or other content pieces are engaging your audience and leading to conversions.
This information allows you to optimize your marketing strategies, allocate resources effectively, and ultimately increase your return on investment.
User experience (UX) enhancement
A great user experience keeps visitors on your site longer and encourages them to return. Your dashboard can aid in:
Understanding user interactions: See where users click, how they scroll through pages, and which elements they interact with the most.
Identifying pain points: Discover areas where users may be experiencing frustration or difficulty, such as slow-loading pages or confusing navigation.
Improving site usability: Use insights to make adjustments that enhance the overall usability of your site.
You might also be interested in these;
What is Web Analytics? Definition, Metrics & Best Practices
Website Visitor Tracking - A Comprehensive Guide
Top 10 Digital Analytics Tools You Need to Know
Ultimate Website Optimization Guide: Must-Know Tactics
Website Analysis 101: How to Analyze for Peak Performance
AUTHOR

Tope Longe
Product Analytics Expert
Ardent technophile exploring the world of mobile app product management at UXCam.
What’s UXCam?
Related articles
Website Analysis
Best Free Web Analytics Tools [2026]
Compare the best free web analytics tools for UX, product, and privacy. See why UXCam is the top choice for behavioral insights, compliance, and...

Jonas Kurzweg
Product Analytics Expert
Website Analysis
What is Web Analytics? Definition, Metrics & Best Practices
Discover what web analytics is, its definition, key examples, and the best tools to optimize your website's performance and user...

Tope Longe
Product Analytics Expert
Website Analysis
Website Heatmap - Ultimate Guide and Best Tools [2026]
Read the ultimate 2026 guide to website heatmaps: discover types, implementation, and the best heatmap tools to optimize user experience and site's...

Jonas Kurzweg
Product Analytics Expert
